




Audit Core Web Vitals Before Website Launch
Set Core Web Vitals Pass Criteria
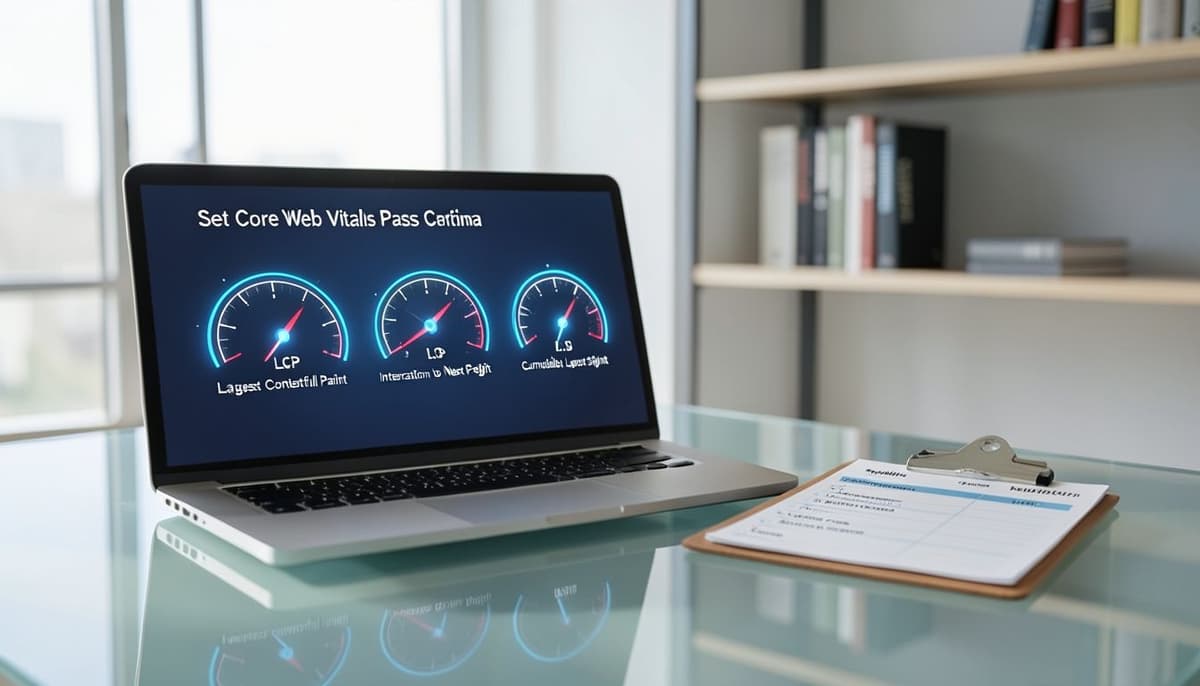
Begin the audit by defining measurable release criteria for the three Core Web Vitals: Largest Contentful Paint, Interaction to Next Paint, and Cumulative Layout Shift. A good experience requires LCP at or below 2.5 seconds, INP at or below 200 milliseconds, and CLS at or below 0.1. Google evaluates these thresholds at the 75th percentile of page visits, separately for mobile and desktop. Treat them as launch requirements rather than optional optimization targets.
Create a representative URL list before running any tools. Include the homepage, one page from every major template, and high-value conversion paths such as product, pricing, checkout, registration, or lead forms. A 500-page site built from eight templates usually needs deeper testing on those eight templates, plus unusual pages, rather than identical checks on all 500 URLs. Record the template, device profile, test environment, metric result, suspected cause, owner, and retest status for every sample.
Test Pages in a Production-Like Environment
Audit a production-like build because development mode can distort performance results. Enable the same minification, image compression, caching, content delivery network, redirects, analytics, consent manager, and third-party scripts planned for launch. Verify that test pages are not accidentally serving unoptimized source maps, debug bundles, or local assets. Keep staging blocked from search engines with authentication or appropriate indexing controls, but configure the application itself as closely as possible to production.
Network location and server configuration also matter. A page may achieve an LCP of 1.8 seconds from an office near the origin server but exceed 3 seconds for a mobile user on another continent. Test from regions where the target audience is located and include slower mobile network and CPU profiles. Warm-cache and cold-cache runs should be recorded separately because a first-time visitor does not benefit from assets already stored in the browser.
Combine Lighthouse with Field Data

Use Google Lighthouse or PageSpeed Insights for repeatable laboratory diagnostics, but do not mistake one score for complete evidence. Run at least three mobile tests per page and use the median result because network and CPU conditions vary between runs. Examine the individual metrics, waterfall, main-thread work, render-blocking resources, and layout-shift evidence instead of focusing only on the overall performance score. A score of 90 can still hide a failing metric on a business-critical template.
Field data reflects real visitors and is therefore essential when it exists. PageSpeed Insights and the Chrome User Experience Report may show a rolling 28-day view at URL or origin level, but a new domain or new template may have no usable history before launch. In that case, compare equivalent pages on the current site, run a controlled beta, or add real user monitoring to pre-release traffic. Remember that lab tests estimate Total Blocking Time as a useful proxy, while INP itself depends on real user interactions.
Diagnose Largest Contentful Paint

When LCP fails, first identify the exact element reported as the largest visible content item. It is often a hero image, product photograph, poster image, or large heading, but the bottleneck may begin before that element downloads. Break the metric into server response delay, resource discovery delay, resource loading time, and rendering delay. This decomposition prevents a team from compressing an image when the real problem is a slow server or client-side rendering.
For an image-based LCP, use an appropriately sized AVIF or WebP asset, include responsive image candidates, and avoid lazy-loading content visible above the fold. Preload only a genuinely critical image, set a high fetch priority where appropriate, and confirm that the browser discovers it directly in the initial HTML. If the HTML response takes 900 milliseconds and the hero begins downloading at 1.4 seconds, shaving 100 milliseconds from image decoding will not solve the larger delay. Also test authenticated, localized, and personalized pages because their server response paths may differ.
Measure Interaction to Next Paint
INP measures how quickly a page provides visual feedback after user interactions throughout a visit. During the audit, click menus, filters, accordions, form controls, search suggestions, add-to-cart buttons, and consent controls rather than testing page load alone. Use Chrome DevTools performance recordings to locate long tasks and expensive event handlers. A filter that responds in 80 milliseconds on desktop may take more than 250 milliseconds on a mid-range phone when a large JavaScript bundle blocks the main thread.
Reduce interaction delay by removing unused JavaScript, splitting bundles by route or feature, and postponing nonessential third-party code. Break CPU-heavy work into smaller tasks so the browser can process input and render feedback between them. Update only the necessary part of the interface instead of rebuilding a large component tree after every click. For example, changing one product filter should not synchronously recalculate hundreds of hidden items before showing the selected state.
Find and Prevent Layout Shifts

CLS problems often appear when images, advertisements, embeds, banners, or web fonts change the layout after initial rendering. Add explicit width and height attributes or a CSS aspect ratio to media so the browser reserves space before files arrive. Reserve predictable containers for advertisements and embeds, even when inventory is unavailable. Insert late notices below existing content when possible instead of pushing navigation, headings, or purchase controls downward.
Test layout stability through complete user journeys, not only during the first few seconds of page load. Open a cookie banner, trigger validation messages, switch filters, load more results, and wait for delayed promotional components. DevTools can highlight shift regions and group related layout shifts, making the responsible element easier to identify. A small shift repeated five times can produce a poor cumulative result even when no single movement looks dramatic.
Run the Final Technical SEO Gate

After fixes are deployed, rerun the same URLs with the same device, network, location, and cache conditions used for the baseline. Compare median results from multiple runs and investigate regressions in transfer size, request count, long tasks, and server response time. Test at common responsive breakpoints because a mobile template may load different images or scripts from its desktop counterpart. Also verify that performance changes did not break canonical tags, structured data, redirects, analytics, accessibility, or conversion tracking.
Define a release gate that reflects both performance and business risk. For example, require every critical template to meet all three thresholds in repeatable lab scenarios, allow documented exceptions only with an owner, and schedule field-data review 28 days after launch. Add Lighthouse CI or another automated web performance check to the deployment pipeline so later releases cannot silently reintroduce oversized images or blocking scripts. Core Web Vitals support Technical SEO, but the final launch decision should also account for crawlability, indexability, content quality, and functional testing.
Further Reading
Tags :
- Technical SEO