



In this fourteen-minute beginner lesson, learners discover how the cash flow statement explains changes in a company's cash balance through operating, investing, and financing activities. Using fictional Example Corp and Company C, learners reconcile net income to operating cash flow, calculate free cash flow, evaluate working capital movements, and explain why positive accounting profit does not always mean positive free cash flow. The lesson builds a repeatable financial research process using hypothetical data and simulated money only.
What the Cash Flow Statement Shows
The cash flow statement explains how cash and cash equivalents change during a reporting period. It organizes cash movements into operating, investing, and financing activities. This differs from the income statement, which measures revenue, expenses, and accounting profit, and from the balance sheet, which reports financial position at a particular date. A company can recognize revenue before collecting payment, incur expenses without an immediate cash payment, or spend cash on assets that are recognized over multiple periods.

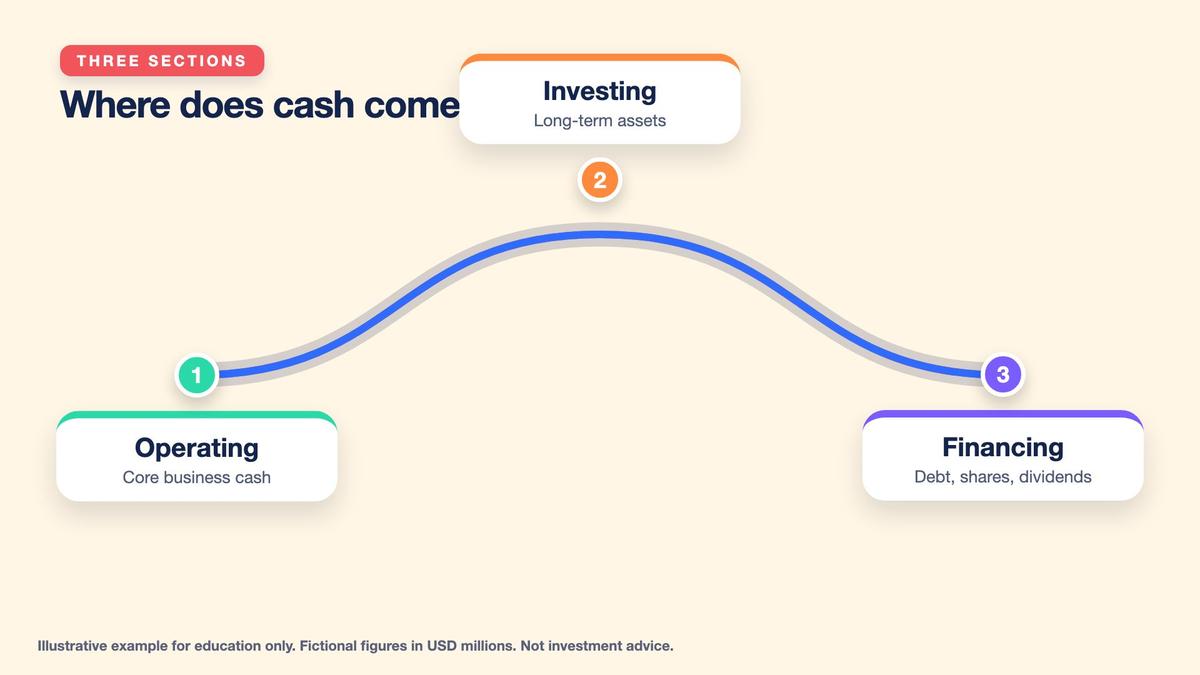
Operating activities generally concern cash generated or used by the company's principal business activities. Investing activities commonly include purchases and sales of property and equipment, acquisitions, and certain financial investments. Financing activities include transactions involving borrowing, debt repayment, issuing or repurchasing shares, and distributions such as dividends. Classification details depend on the applicable accounting standards. For this lesson, we use simplified U.S. reporting examples from the entirely fictional Example Corp.
Key points
- Profit follows accounting rules; cash flow records money in and out.
- Three sections: operating, investing, financing.
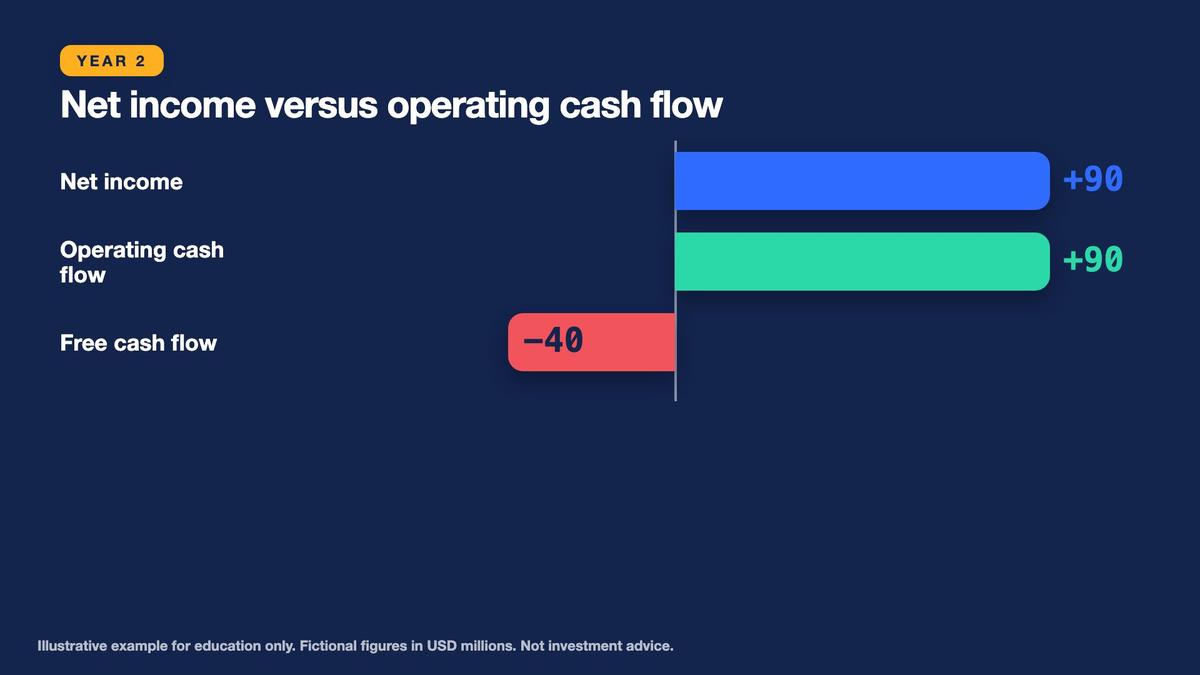
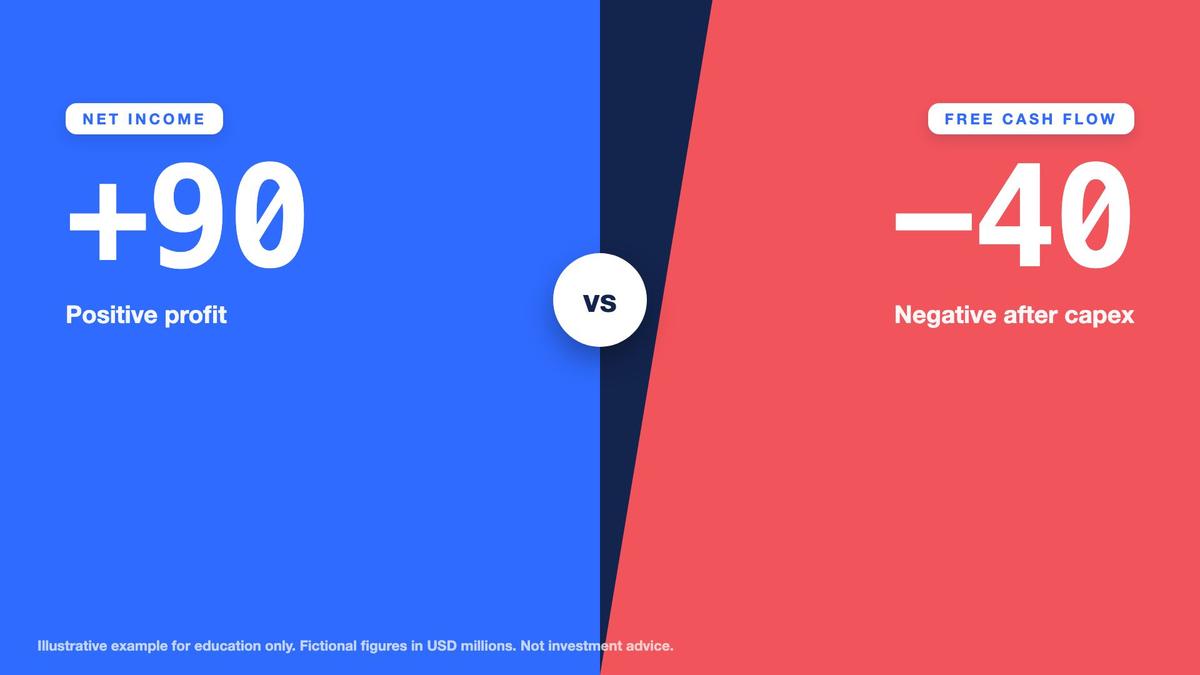
- Net income of 90 can sit beside a cash decline of 100.
Our central question is why Example Corp reports positive Year 2 net income of $90 million while cash decreases by $100 million. Answering requires following cash through all three sections instead of assuming that accounting profit must increase the bank balance. You will also learn a consistent course definition of free cash flow and understand why an FCF figure must be interpreted alongside financial statement notes, investment spending, working capital, and financing choices.
Reconcile Net Income to Operating Cash Flow
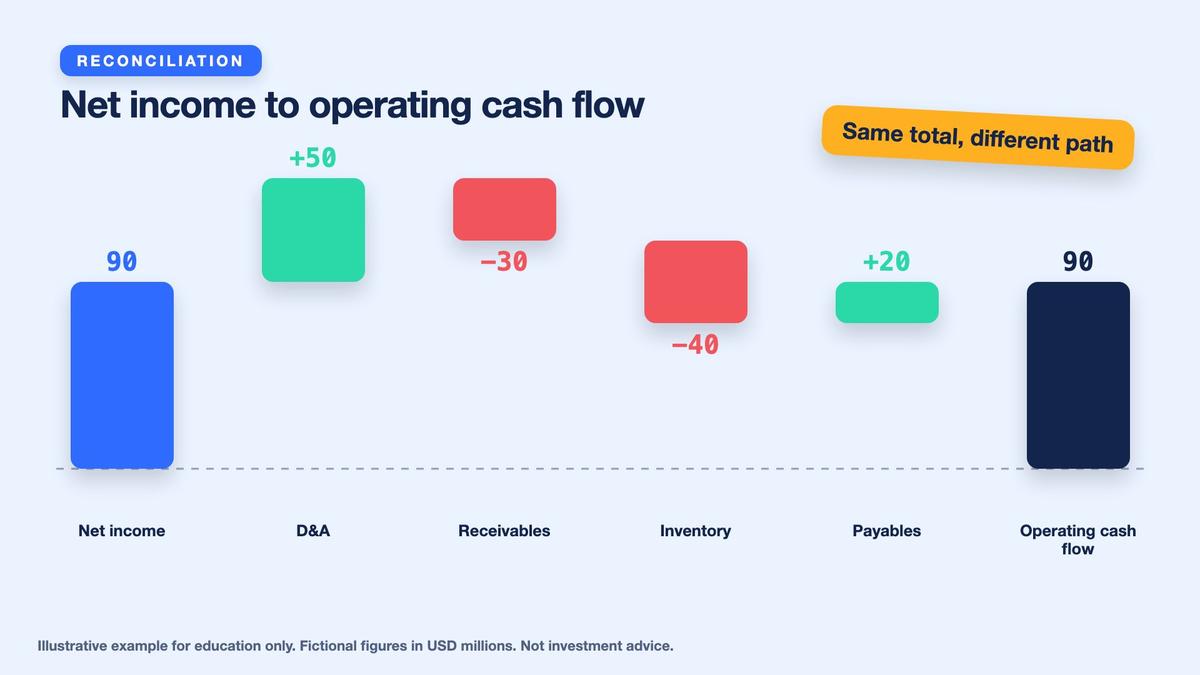
The indirect method of presenting operating cash flow begins with net income and adjusts for items that affect accounting earnings without representing current operating cash movements. It also adjusts for timing differences involving operating assets and liabilities. This approach connects the income statement to the cash flow statement. Example Corp begins with $90 million Year 2 net income, the same fictional profit figure used in Lesson Seven. The objective is to explain how that accounting result translates into actual operating cash flow.
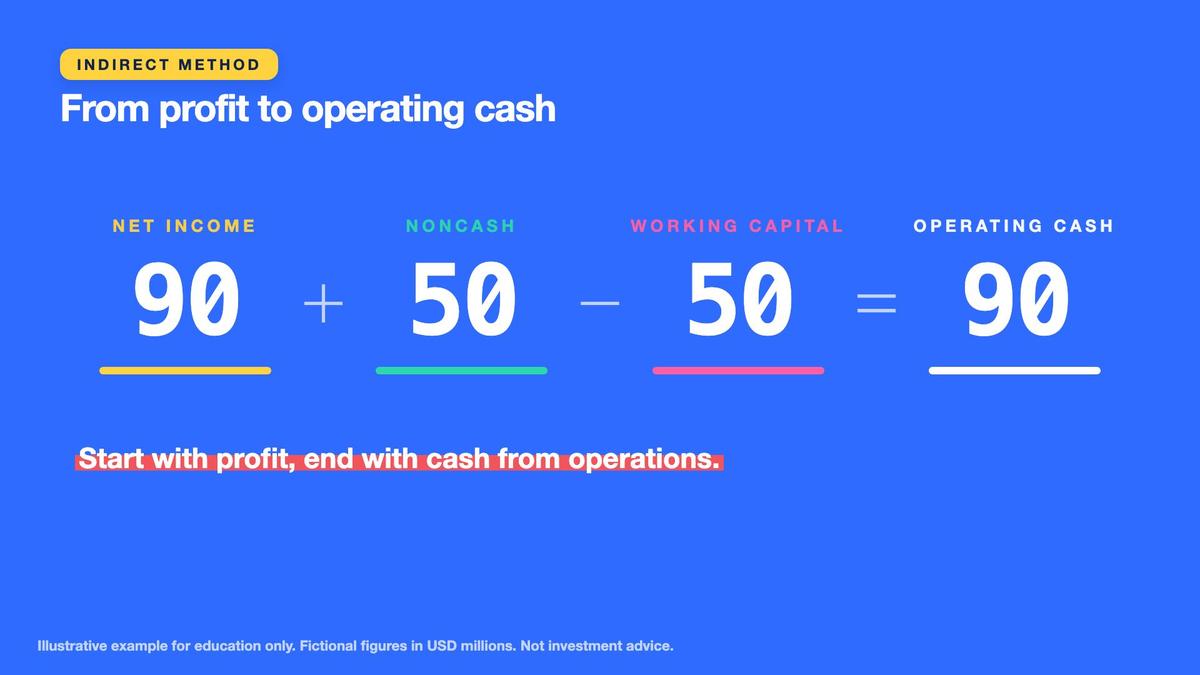
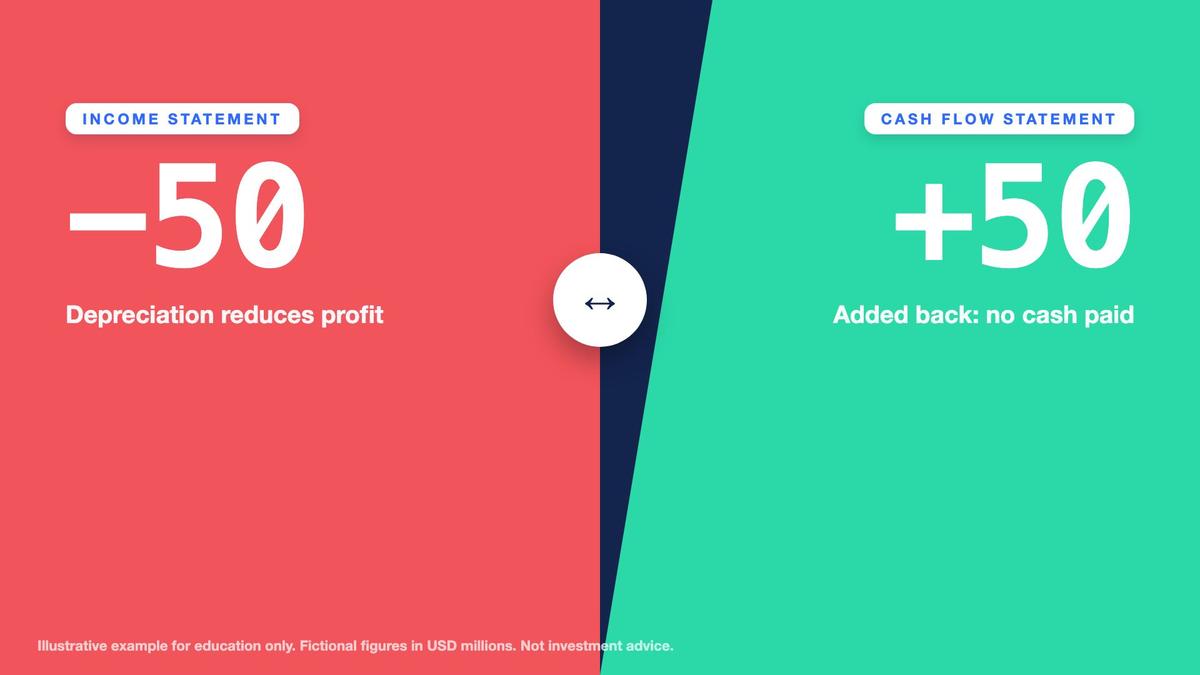
Depreciation and amortization allocate the accounting cost of certain long-lived assets and intangible assets over applicable periods. They reduce net income but typically do not represent cash paid in the period when the expense is recognized. Example Corp records $50 million in depreciation and amortization. Adding that amount back to its $90 million net income produces $140 million before working capital adjustments. Other noncash expenses may also require adjustments, but our simplified example assumes none beyond the stated amount.
Key points
- Start with net income: 90.
- Add back depreciation and amortization: +50 (140 before working capital).
- Then adjust for working capital changes.
Working capital movements complete the reconciliation. Example Corp has a $30 million increase in receivables, a $40 million increase in inventory, and a $20 million increase in accounts payable. These correspond to cash adjustments of negative $30 million, negative $40 million, and positive $20 million. Together, they create a negative $50 million working capital effect. Starting from $140 million before those adjustments gives exactly $90 million in operating cash flow.
Understand Receivables, Inventory, and Payables
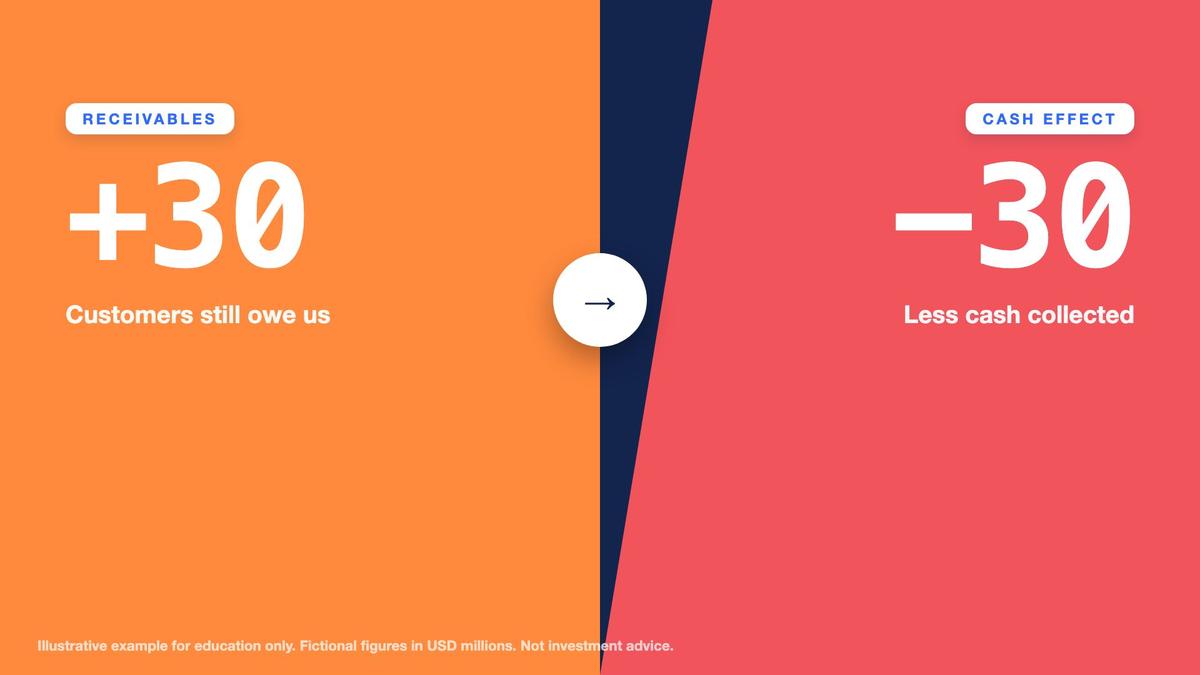
Receivables arise when a company recognizes sales before collecting payment. If accounts receivable increases, some recognized revenue has not yet been converted into cash. Under a simplified indirect-method reconciliation, an increase in operating receivables reduces operating cash flow. Example Corp's $30 million receivables increase is therefore recorded as negative $30 million. This does not automatically indicate bad debt or poor management. However, persistent receivables growth relative to sales may justify investigating collection practices and customer payment terms.
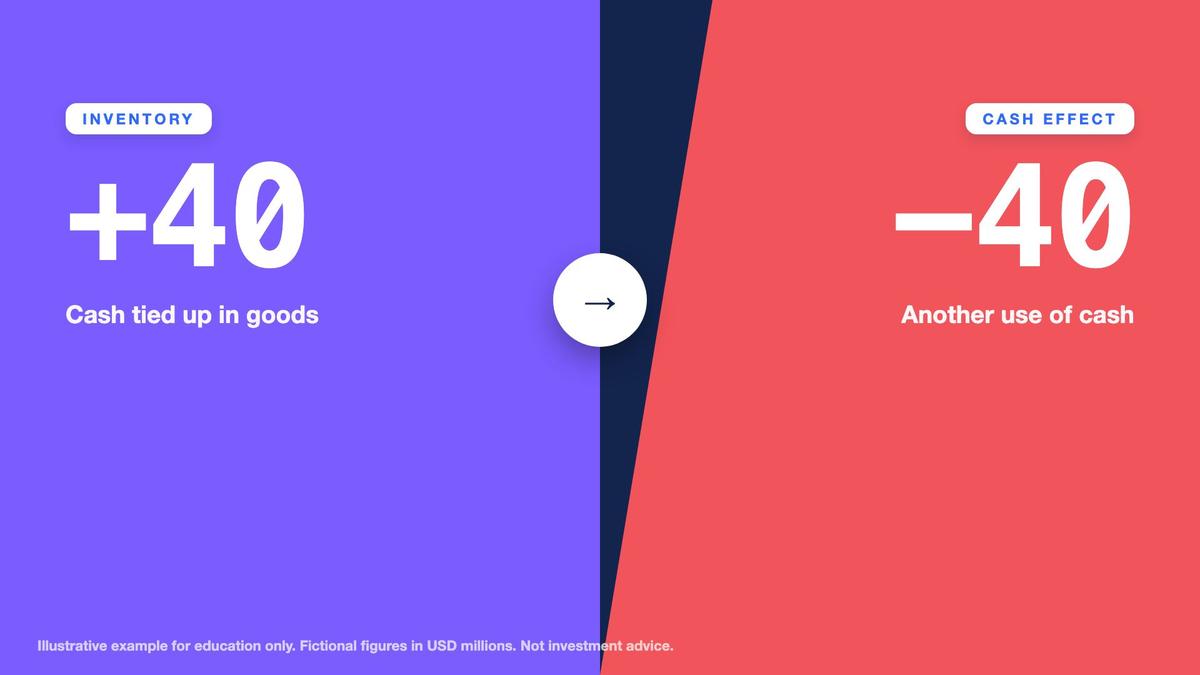
Inventory also affects operating cash flow. A company may purchase materials, manufacture products, and store finished goods before collecting money from customers. When inventory increases, cash or other operating resources may become tied up in goods that have not yet been sold. Example Corp's $40 million inventory increase produces a negative $40 million operating cash adjustment. Growing inventory may support future sales, but it may also reflect slowing demand, overproduction, or inventory management problems.
Key points
- Receivables +30 and inventory +40 use cash: −30 and −40.
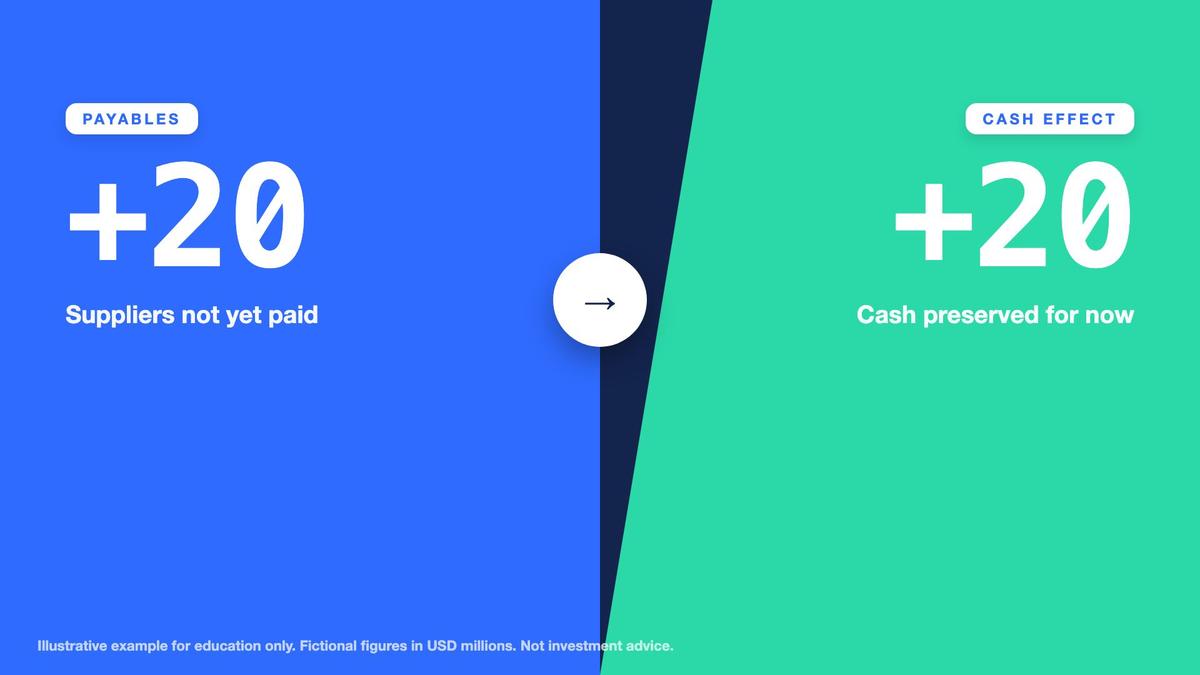
- Payables +20 preserve cash: +20.
- Operating cash flow = 90 + 50 − 30 − 40 + 20 = 90.
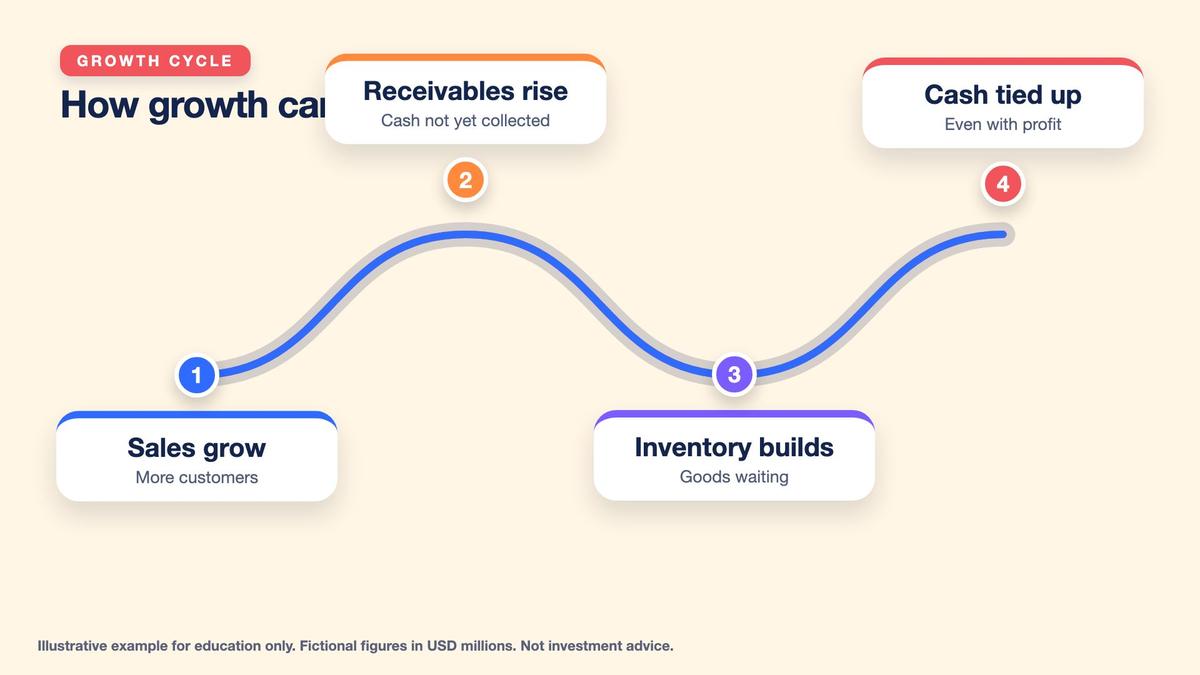
Accounts payable moves in the opposite direction in a simple reconciliation. When the company receives goods or services but has not yet paid suppliers, cash remains temporarily available. Example Corp's $20 million increase in accounts payable therefore adds $20 million to operating cash flow. This positive adjustment does not represent free money; the underlying obligation still exists. Reviewing receivables, inventory, and payables together helps learners understand why business growth can consume cash even when reported revenue and profit increase.
Investing and Financing Activities: Explain the Cash Decline
The investing section records cash movements associated with long-term resources and specified investment transactions. Capital expenditures, usually abbreviated capex, include cash spent acquiring or improving property, plant, equipment, and certain other qualifying assets. Companies may also purchase or sell investments or acquire other businesses. Example Corp spends $130 million on capital expenditures during Year 2. Because the simplified example contains no other investing cash flows, total cash flow from investing activities is exactly negative $130 million.

Financing activities show how cash moves between the company and its providers of capital. Borrowing produces a cash inflow, while repayment consumes cash. Issuing shares may provide cash, whereas share repurchases and dividends generally consume it. Example Corp receives $40 million through net borrowing, pays $20 million in dividends, and repurchases $80 million of shares. Combining these amounts gives $40 million minus $20 million minus $80 million, resulting in negative $60 million financing cash flow.

Key points
- Investing: capex of 130, so investing cash flow is −130.
- Financing: +40 borrowing, −20 dividends, −80 buybacks = −60.
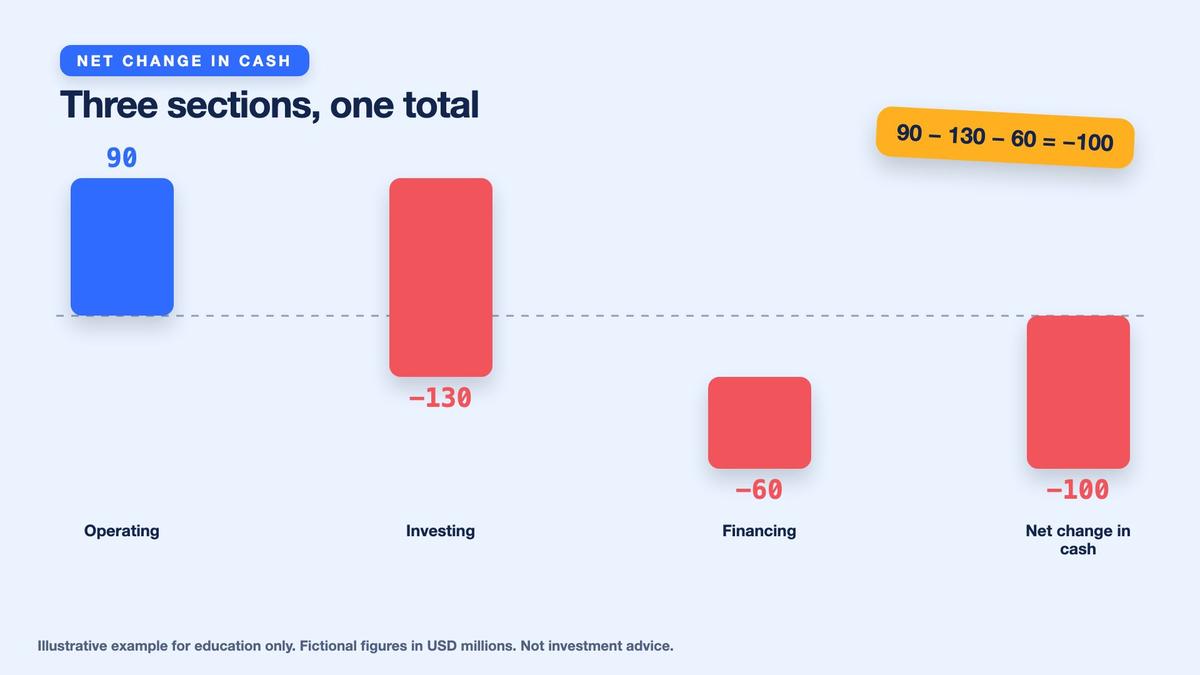
- Net change in cash = 90 − 130 − 60 = −100 (300 to 200).
The three cash flow sections now reconcile. Operating activities provide $90 million, investing activities use $130 million, and financing activities use $60 million. The net change in cash is exactly negative $100 million. Beginning cash of $300 million therefore becomes $200 million at year-end, matching Example Corp's Lesson Eight balance sheet. Positive earnings did not prevent the cash decline because spending on capital expenditures, dividends, and repurchases exceeded operating cash generation after considering borrowing.

Free Cash Flow, FCF Margin, and Cash Conversion
Free cash flow, commonly abbreviated FCF, describes cash remaining after a defined measure of operating cash generation and investment spending. For this course, we use the simple definition: FCF equals cash flow from operations minus capital expenditures, with capital expenditures entered as a positive spending amount. This is a commonly used analytical measure, but other definitions exist. Companies and analysts may classify or adjust components differently, so always read the stated definition before comparing reported FCF figures.
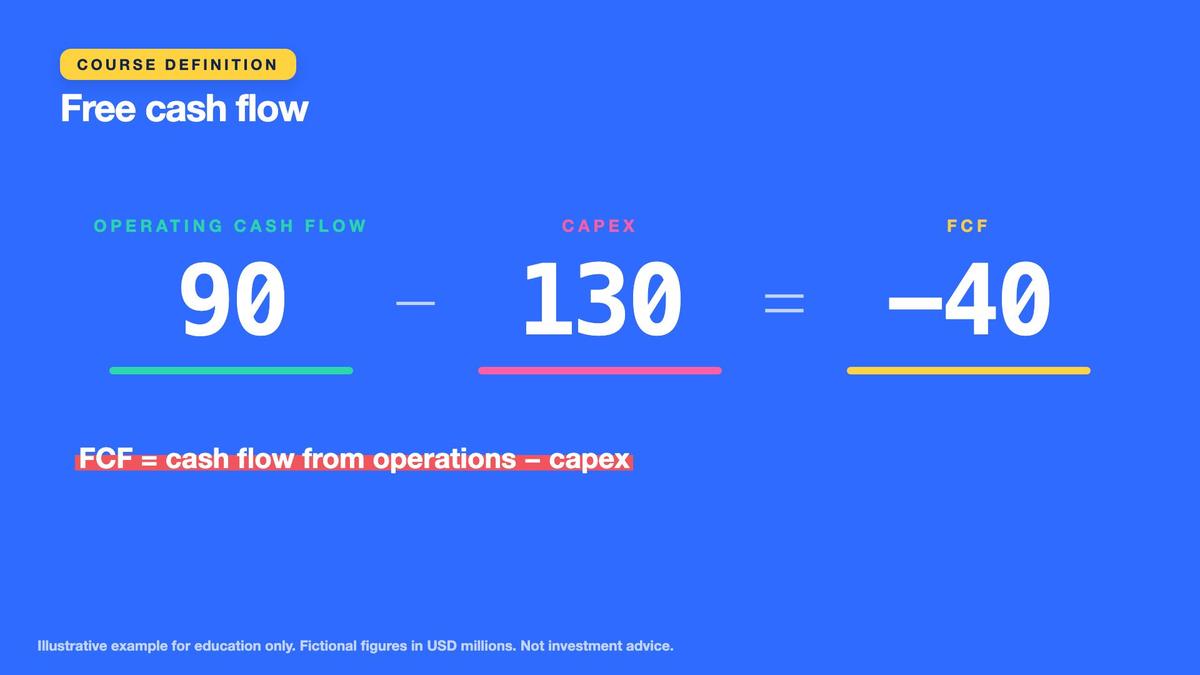
Example Corp generates $90 million in operating cash flow and spends $130 million on capex. Applying the course formula gives negative $40 million FCF. FCF margin expresses this amount relative to revenue. With Year 2 revenue of $1,100 million, FCF margin equals negative $40 million divided by $1,100 million. The exact fraction is negative 2/55, corresponding to negative 40/11 percent, approximately negative 3.64 percent, or negative 3.6 percent when rounded to one decimal place.
Key points
- Course FCF = cash flow from operations − capex = 90 − 130 = −40.
- FCF margin = −40 ÷ 1,100 ≈ −3.6%.
- Cash conversion = 90 ÷ 90 = 100%.
Cash conversion provides another perspective by comparing operating cash flow with net income. Under the simple ratio used here, Example Corp's cash conversion is $90 million divided by $90 million, or exactly 1.0 times, equivalent to 100 percent. Yet its FCF remains negative because capital expenditures exceed operating cash flow. This distinction matters: cash conversion evaluates the relationship between earnings and operating cash, while FCF additionally considers capital spending under the course definition.
Why Positive Profit Can Coexist With Negative FCF
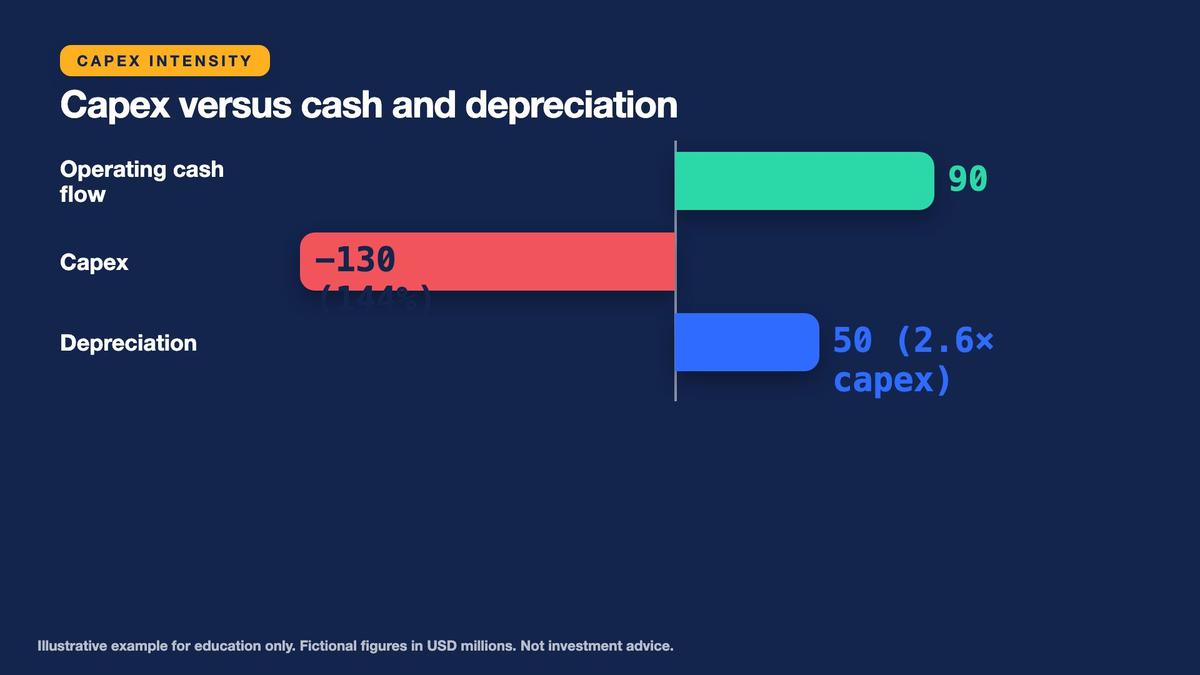
Positive accounting profit combined with negative free cash flow is not automatically evidence of financial weakness. A growing company may be spending heavily on factories, equipment, technology, or other long-term investments expected to support future operations. Example Corp's $130 million capex is greater than its $90 million operating cash flow, creating negative $40 million FCF. Capex equals exactly 13/9 of operating cash flow, approximately 144.4 percent, and is 2.6 times the company's $50 million depreciation and amortization.
Nevertheless, investment spending must be examined rather than automatically celebrated. Some capex maintains existing operations, while other spending may expand production capacity. Financial statement disclosures do not always separate these categories perfectly. Heavy investment may produce future benefits, but projects can disappoint or require additional funding. In Example Corp's case, operating cash before working capital adjustments is $140 million, but working capital changes consume $50 million, leaving less cash available to support capital investment.
Key points
- Negative FCF is not automatically bad, but it needs an explanation.
- Capex is 130, about 144% of operating cash flow and 2.6× depreciation.
- Growth can tie cash up in receivables and inventory.
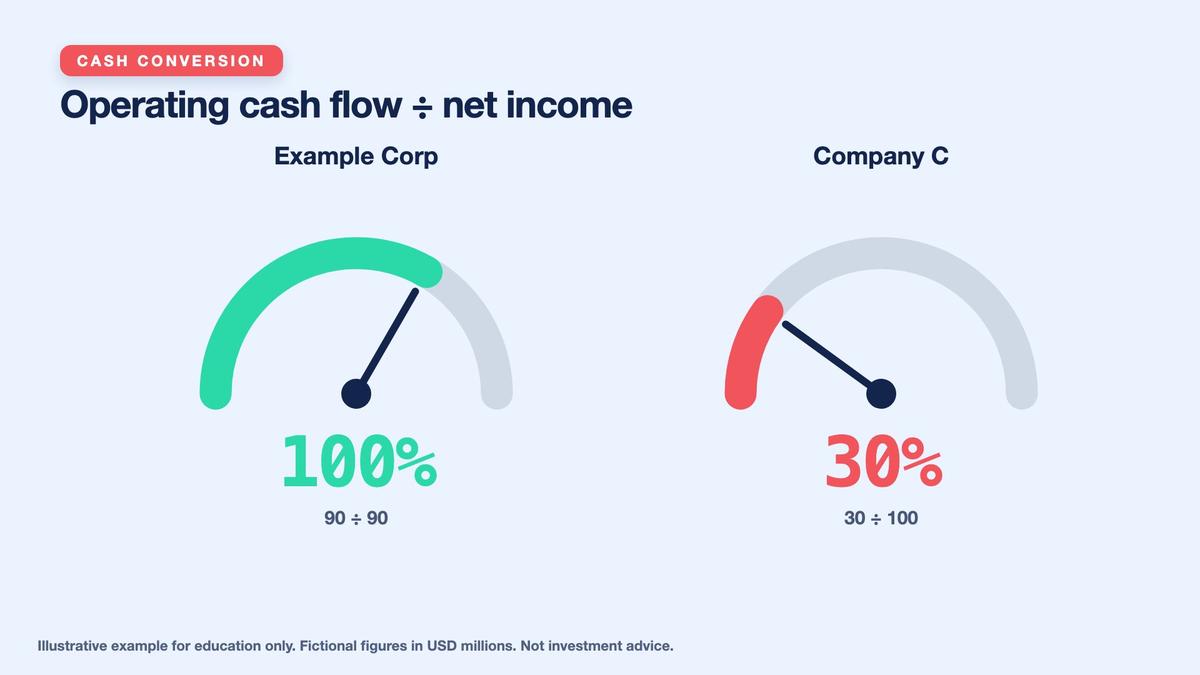
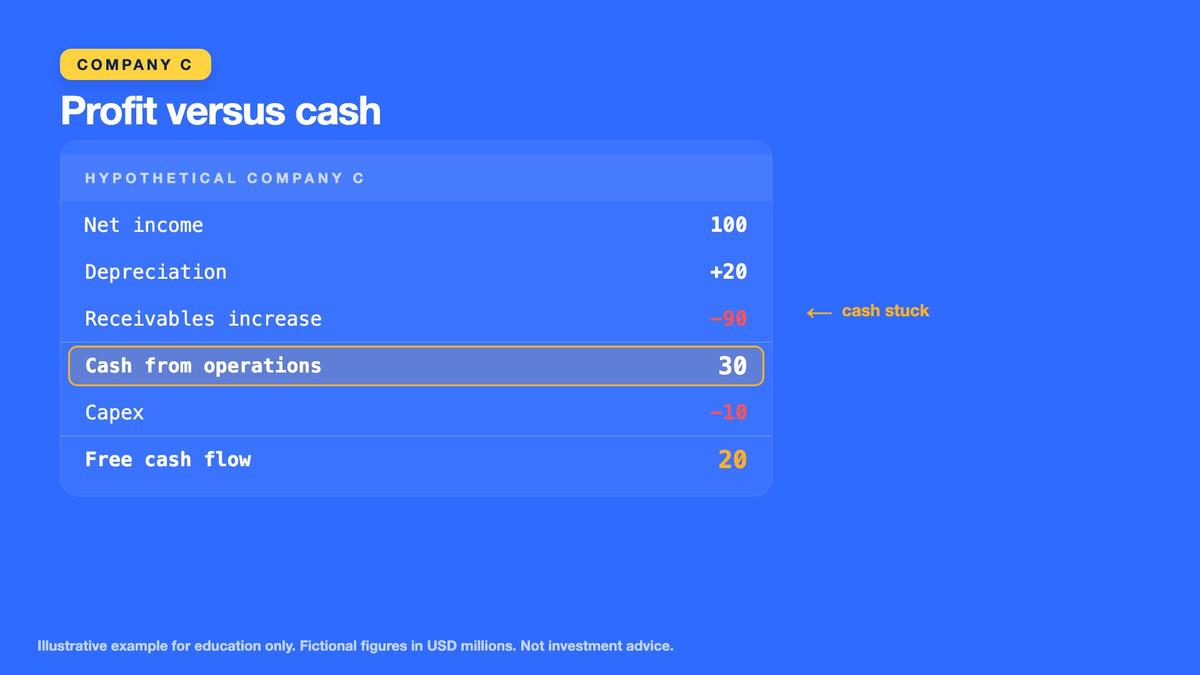
A company may also report positive profit with weak operating cash generation because customers have not yet paid. Consider fictional Company C, with $100 million net income, $20 million depreciation, and a $90 million receivables increase. Ignoring other adjustments, operating cash flow is $30 million. With $10 million capex, FCF equals $20 million. Cash conversion is only 0.3 times, or 30 percent. The contrast shows why strong accounting profit should be considered alongside cash collection and investment needs.
One-Off Items, Stock-Based Compensation, and Statement Connections
Unusual transactions can change cash flow and complicate period comparisons. Acquisition payments, asset sales, settlements, and changes in working capital may create large movements that are not representative of recurring operations. Identify these items and examine the financial statement notes before drawing conclusions. Some transactions are recorded in investing or financing activities rather than operating activities, while others affect more than one section. A clear research journal should distinguish recurring operational cash generation from unusual or nonrecurring events.
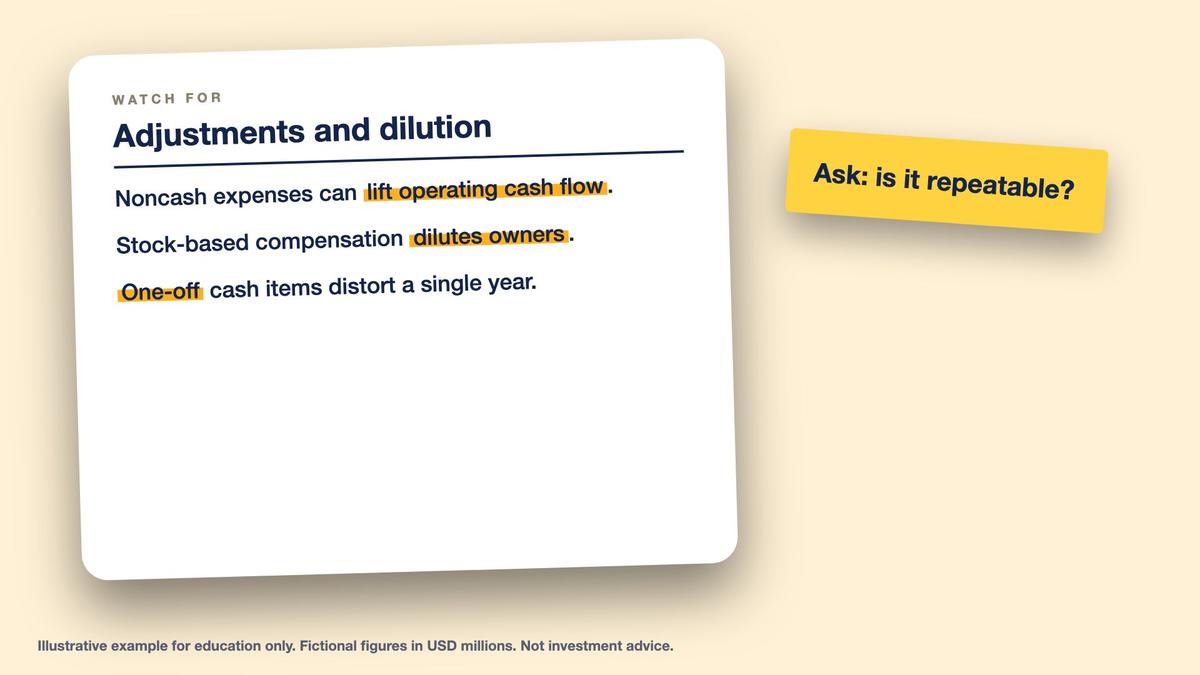
Stock-based compensation deserves particular attention. Under the indirect method, qualifying noncash compensation expense is commonly added back when reconciling net income to operating cash flow. That adjustment does not mean employee equity awards are economically costless. Awards may dilute shareholders, and companies may spend cash repurchasing shares to offset some dilution. Share repurchases generally appear in financing cash flows, not as a deduction in the basic CFO-minus-capex FCF formula. Learners should examine compensation disclosures and share-count changes.
Key points
- Company C: 100 + 20 − 90 = 30 operating cash flow; FCF = 30 − 10 = 20.
- Cash conversion is only 30 ÷ 100 = 30%.
- Watch one-off items and stock-based compensation.
This lesson also connects directly with Lessons Seven and Eight. Example Corp's $90 million net income comes from the income statement. Its beginning cash of $300 million and ending cash of $200 million connect to the balance sheet, while net debt rises from $80 million to $220 million. The cash flow statement explains why cash changed during the year. Reading all three statements together provides a more complete picture than interpreting net income, cash balances, or free cash flow in isolation.
Final Practice: Reconcile Profit and State the FCF Definition
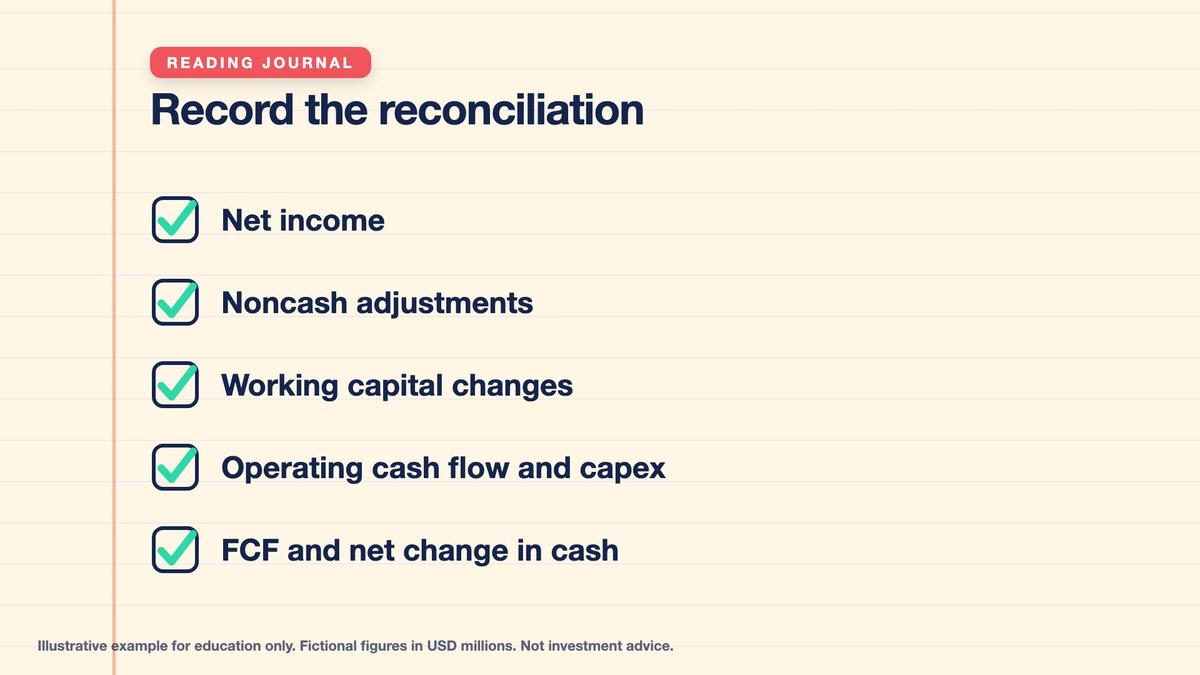
Your final checkpoint begins with Example Corp's $90 million Year 2 net income. Add $50 million depreciation and amortization, subtract $30 million for increased receivables, subtract $40 million for increased inventory, and add $20 million for increased accounts payable. The result is exactly $90 million operating cash flow. Explain each adjustment in plain language. Depreciation is a noncash expense adjustment, while the working capital changes reflect timing differences between recognized business activity and cash payments or collections.

Practice Lab: Reconcile Profit to Operating Cash Flow and Calculate FCF
Use only fictional Example Corp and hypothetical Company C. All monetary values are in millions of US dollars. Apply the indirect-method adjustments with the correct signs, then reconcile operating, investing, and financing cash flows to beginning and ending cash. For this course, FCF equals operating cash flow minus positive capital expenditure spending. State the definition whenever reporting FCF. Show calculations, distinguish exact values from rounded percentages, and explain what the results do and do not prove. Use simulated research only.
- Decision 1: Example Corp reports $90 million net income, $50 million depreciation and amortization, a $30 million increase in receivables, a $40 million increase in inventory, and a $20 million increase in accounts payable. — Reconcile net income to operating cash flow, identify cash before working capital changes, and calculate the net working capital adjustment.
- Decision 2: Example Corp generates $90 million operating cash flow, spends $130 million on capital expenditures, and reports $1,100 million revenue. — Calculate FCF using the course definition and determine FCF margin.
- Decision 3: Example Corp has operating cash flow of $90 million, investing cash flow of negative $130 million, and financing cash flow composed of $40 million net borrowing, negative $20 million dividends, and negative $80 million share repurchases. — Calculate financing cash flow, net cash change, and ending cash when beginning cash is $300 million.
- Decision 4: Example Corp's operating cash flow is $90 million, depreciation and amortization is $50 million, capex is $130 million, and net income is $90 million. — Calculate cash conversion, capex divided by operating cash flow, and capex divided by depreciation and amortization.
- Decision 5: Hypothetical Company C reports $100 million net income, $20 million depreciation, a $90 million increase in accounts receivable, and $10 million capex, with no other cash flow adjustments. — Calculate operating cash flow, FCF, and cash conversion, then identify the issue requiring investigation.
Answer key
Next, state the course definition of FCF: operating cash flow minus capital expenditures. Example Corp's calculation is $90 million minus $130 million, yielding negative $40 million FCF. With revenue of $1,100 million, its FCF margin is approximately negative 3.6 percent. Operating cash conversion is exactly 100 percent. Explain why neither measure alone establishes business quality. Negative FCF may reflect investment spending, weak cash generation, or a combination of factors requiring further investigation.
Finally, reconcile the entire change in cash. Operating cash flow of $90 million, investing cash flow of negative $130 million, and financing cash flow of negative $60 million sum to negative $100 million. Beginning cash of $300 million becomes $200 million, matching the balance sheet. Record the calculation, source items, reporting period, assumptions, and one unanswered question in your journal. The objective is accurate financial interpretation using fictional data, not predicting stock prices or making investment recommendations.
Worked example at a glance
Key terms
- Cash flow statement: explains the change in cash over a period in three sections.
- Operating activities: cash flows from the core business.
- Investing activities: purchases and sales of long-term assets, acquisitions and investments.
- Financing activities: borrowing, repaying debt, issuing or repurchasing shares and paying dividends.
- Indirect method: starting from net income and adjusting to cash.
- Noncash charge: an expense that reduces profit without a current cash payment.
- Working capital change: cash effect of changes in receivables, inventory and payables.
- Capex: capital expenditures on long-term assets.
- Free cash flow (FCF): cash flow from operations minus capex (course definition).
- FCF margin: free cash flow divided by revenue.
- Cash conversion: operating cash flow divided by net income.
Multi Asset Trading Lab is an educational course and does not provide personalized investment, trading, financial, accounting, legal, or tax advice. Example Corp and Company C are entirely fictional, and all revenue, profit, cash flow, asset, debt, capital expenditure, working capital, and financial ratio figures in this lesson are hypothetical. All exercises involve simulated research only; no real-money investing or trading is required or encouraged. A cash flow statement describes cash movements over historical reporting periods and does not guarantee future cash generation, profitability, solvency, liquidity, or investment returns. Net income differs from operating cash flow because of accounting recognition, noncash items, and timing differences. Positive accounting profit does not guarantee positive operating cash flow or free cash flow. Negative free cash flow may reflect capital investment, weak operating cash generation, or other circumstances requiring investigation; it is neither automatically harmful nor automatically beneficial. This course defines free cash flow as cash flow from operating activities minus capital expenditures, with capital expenditures entered as a positive spending amount. Alternative FCF definitions exist and may include different adjustments, so learners should verify the definition and reconciliation used by each source. Depreciation and amortization are noncash adjustments in the operating cash flow reconciliation, but the underlying assets may require future replacement expenditures. Increases in receivables and inventory may consume cash, while increases in payables may temporarily preserve it without eliminating the underlying obligations. Stock-based compensation is commonly a noncash operating cash flow adjustment under the indirect method, but it may create shareholder dilution and other economic costs. Financing activities such as borrowing, dividends, and repurchases can materially change cash balances without directly determining operating income. Reported cash flow amounts may also be affected by unusual items, classification rules, restricted cash, foreign exchange effects, acquisitions, and accounting estimates. The simplified Example Corp reconciliation assumes no additional cash flow adjustments or foreign exchange effects on cash. Financial analysis should consider the income statement, balance sheet, cash flow statement, notes, management commentary, and subsequent disclosures together. No numerical example, financial ratio, or analytical conclusion in this lesson constitutes a recommendation to buy, sell, or hold securities. Learners should verify original filings, understand their limitations, and consult qualified professionals before making actual financial decisions.
Lesson Checkpoint
Review what you learned and get feedback on your work.