



In this twelve-minute beginner lesson, learners read a U.S. public company's balance sheet, identify assets, liabilities, and shareholders' equity, and evaluate liquidity and debt using simple financial ratios. Through fictional Example Corp and a hypothetical Company B comparison, learners calculate working capital, current ratio, total debt, net debt, debt-to-equity, cash coverage, and interest coverage. The lesson emphasizes why a large cash balance alone does not establish financial strength and teaches learners to review debt maturities, restricted cash, obligations, and prior-year changes.
What a Balance Sheet Shows and How It Differs From an Income Statement
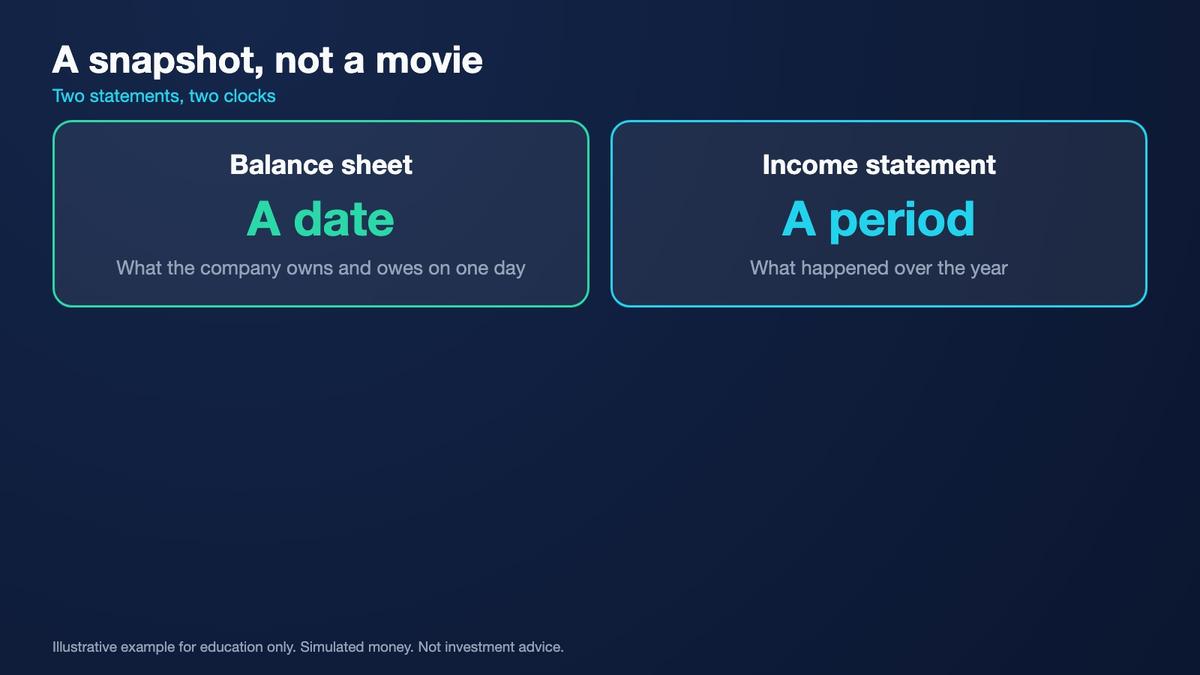
A balance sheet, also called a statement of financial position, describes a company's assets, liabilities, and shareholders' equity at a specific reporting date. Unlike the income statement covered in Lesson Seven, which measures revenue, expenses, and profits over a period, the balance sheet captures financial position at one point in time. This distinction is essential. A company may report strong annual profit while facing near-term obligations that require substantial cash payments. Financial performance and financial position are related but separate questions.

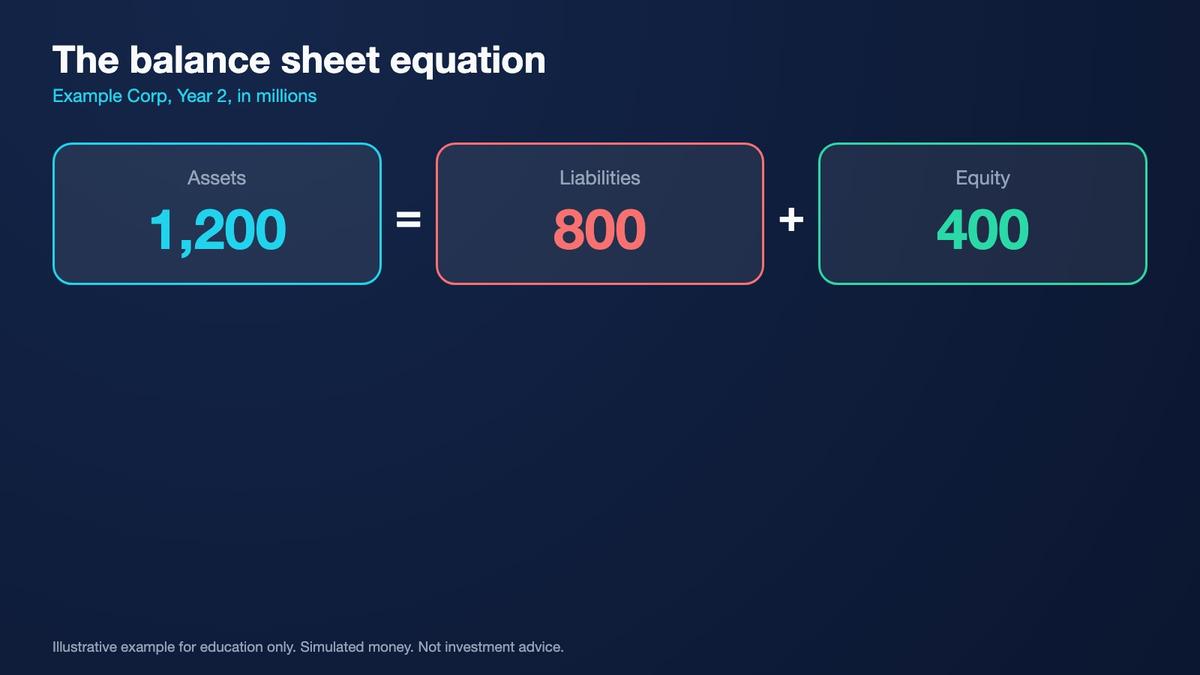
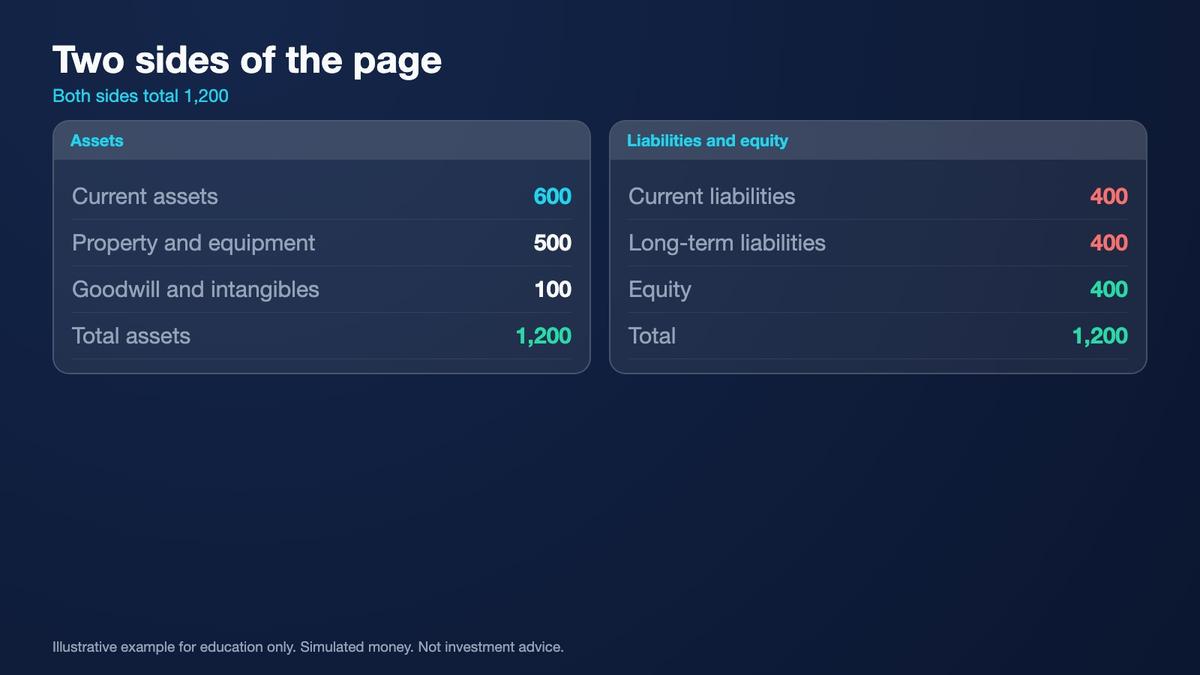
The central balance-sheet equation is assets equal liabilities plus equity. Assets represent recognized economic resources controlled by the company. Liabilities represent recognized obligations. Shareholders' equity is the residual accounting interest after liabilities are deducted from assets. The equation must balance because the company's recorded resources are matched by creditor claims and owners' residual interests. A balanced statement does not automatically indicate financial health; it confirms consistency with the accounting equation.
Key points
- The balance sheet is a snapshot at a date.
- Assets = liabilities + equity (1,200 = 800 + 400).
- Cash alone says little: read debt beside it.
Our fictional Example Corp reports Year 2 assets of $1,200 million, liabilities of $800 million, and shareholders' equity of $400 million. The equation is exactly satisfied because $800 million plus $400 million equals $1,200 million. In this lesson, we will examine the composition of these figures rather than relying on the totals alone. Our goal is to compare cash with debt while understanding liquidity, other obligations, and the limitations of simplified financial ratios.
Understanding Current and Non-Current Assets
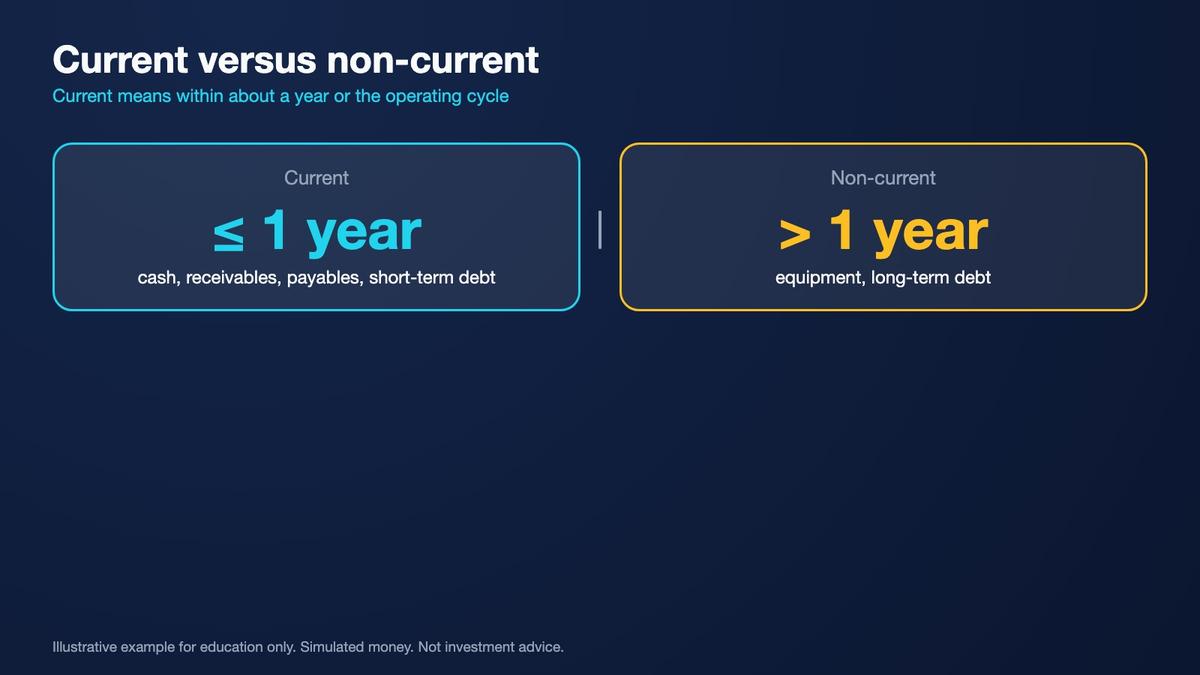
Assets are commonly organized into current and non-current categories. Current assets are generally expected to be realized, sold, or consumed during the normal operating cycle, or within twelve months when applicable. Cash and cash equivalents are generally current unless restricted in a way that changes their classification. Accounts receivable represent amounts owed by customers, while inventory represents goods or materials held for production and sale. Each asset category has different characteristics and different levels of practical liquidity.
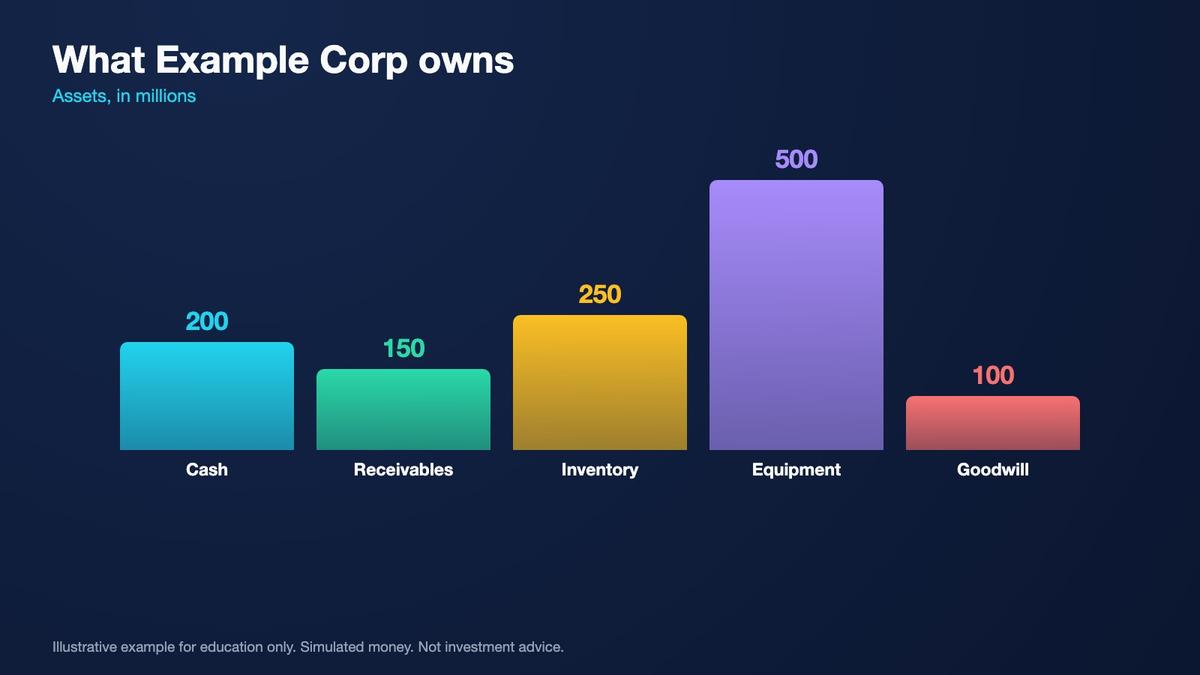
Example Corp reports $200 million in cash and equivalents, $150 million in accounts receivable, and $250 million in inventory. Together, these amounts produce $600 million in total current assets. However, the entire $600 million is not immediately available as cash. Some receivables may be collected late, and inventory must ordinarily be sold or used in operations before generating cash. When evaluating liquidity, learners should consider collection quality, inventory turnover, and any restrictions on cash or other assets.
Key points
- Current assets: cash 200, receivables 150, inventory 250 = 600.
- Non-current: equipment 500, goodwill and intangibles 100 = 600.
- Assets differ in how fast they become cash.
Non-current assets include longer-lived resources such as property, plant, and equipment, as well as goodwill and other intangible assets. Example Corp reports $500 million in net property and equipment and $100 million in goodwill and intangibles. Combined with $600 million in current assets, total assets equal $1,200 million. These balances reflect accounting measurements rather than necessarily representing amounts obtainable through an immediate sale. Goodwill, equipment, and other assets may have values that differ significantly from their book amounts.
Liabilities, Shareholders' Equity, and the Accounting Equation
Liabilities are obligations that the company is required to settle. Current liabilities generally include obligations due within twelve months or the normal operating cycle, subject to applicable accounting rules. Typical examples include accounts payable, short-term borrowings, the current portion of long-term debt, and accrued operating obligations. Example Corp has $180 million in accounts payable, $120 million in short-term debt, and $100 million in other current liabilities, giving total current liabilities of exactly $400 million.
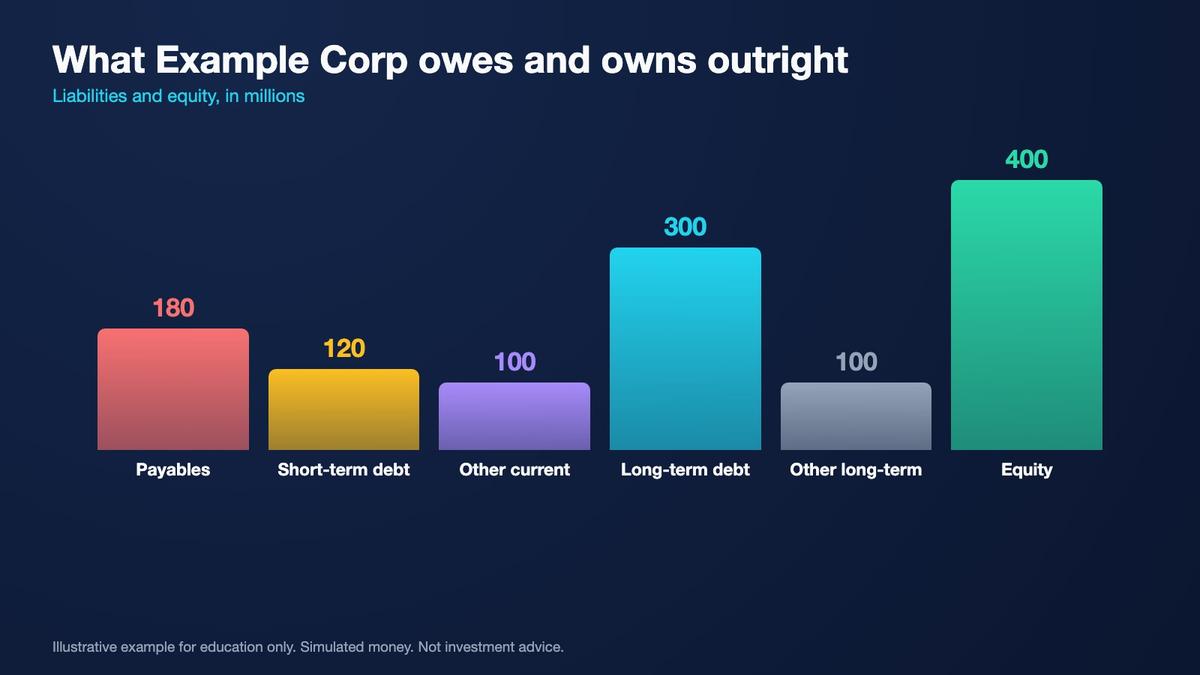
Non-current liabilities include obligations not classified as current, such as long-term borrowings and certain lease or other contractual liabilities. Example Corp reports $300 million in long-term debt and $100 million in other long-term liabilities. Total liabilities are therefore $400 million current plus $400 million non-current, or $800 million. Not every liability is interest-bearing debt. Accounts payable and many accrued operating obligations differ from conventional borrowings, although each can still require cash or other resources to settle.

Key points
- Current liabilities 400; long-term 400; total 800.
- Equity is the residual: 400, a book figure.
- Book equity is not market value.
Shareholders' equity includes components such as paid-in capital, retained earnings, and other recognized equity accounts. Retained earnings reflect accumulated earnings less applicable distributions and adjustments, not necessarily cash stored in a bank account. Example Corp's total equity is $400 million, completing the $1,200 million accounting equation. This is book equity, not market capitalization. Market capitalization depends on traded share prices and shares outstanding, while book equity follows accounting recognition and measurement rules.
Working Capital, Current Ratio, and Quick Liquidity Measures
Working capital is commonly calculated as current assets minus current liabilities. Example Corp has $600 million in current assets and $400 million in current liabilities, producing exactly $200 million in working capital. Positive working capital suggests that recognized current assets exceed recognized current liabilities at the reporting date. However, it does not guarantee that all obligations can be paid on time. Receivable collection, inventory conversion, payment schedules, and cash requirements can significantly influence practical liquidity.
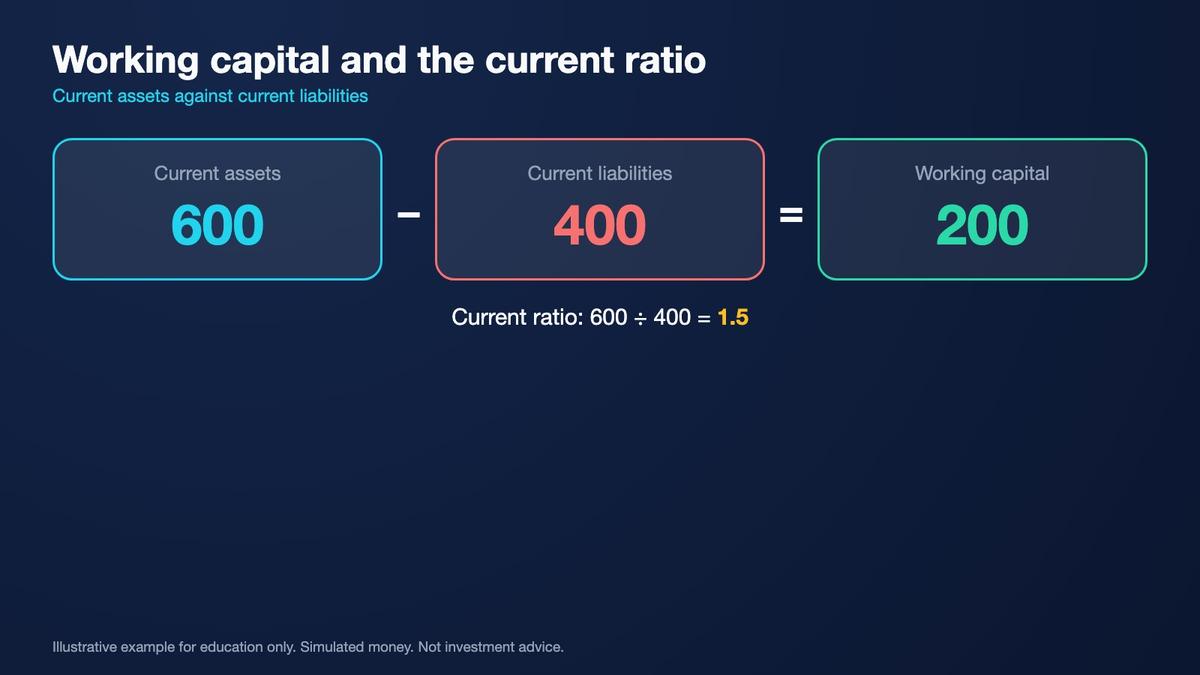
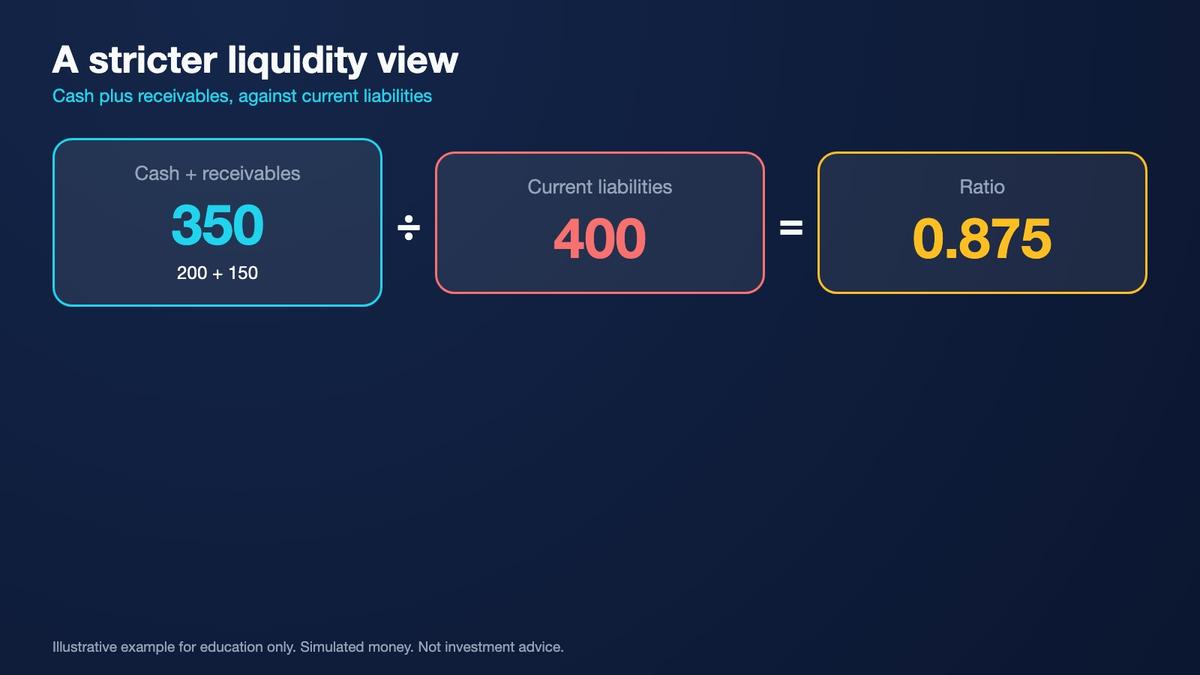
The current ratio divides current assets by current liabilities. Example Corp's current ratio is $600 million divided by $400 million, or exactly 1.5 times. A simplified quick ratio excludes inventory and uses cash plus receivables divided by current liabilities. Example Corp's calculation is ($200 million plus $150 million) divided by $400 million, giving exactly 0.875 times. This narrower view illustrates how apparent coverage changes when inventory is excluded from immediately available financial resources.
Key points
- Working capital = 600 − 400 = 200.
- Current ratio = 600 ÷ 400 = 1.5.
- Quick view: (200 + 150) ÷ 400 = 0.875.
Neither ratio should be interpreted alone. Different industries have different operating cycles, customer payment practices, inventory requirements, and supplier terms. A company with rapid customer collections may operate differently from one holding large amounts of slow-moving inventory. Restricted cash, overdue receivables, and unusually concentrated customers can also change the practical interpretation. Compare liquidity ratios across reporting periods and examine accompanying financial statement notes before concluding that a company has adequate short-term resources.
Total Debt, Net Debt, Debt-to-Equity, and Cash Coverage
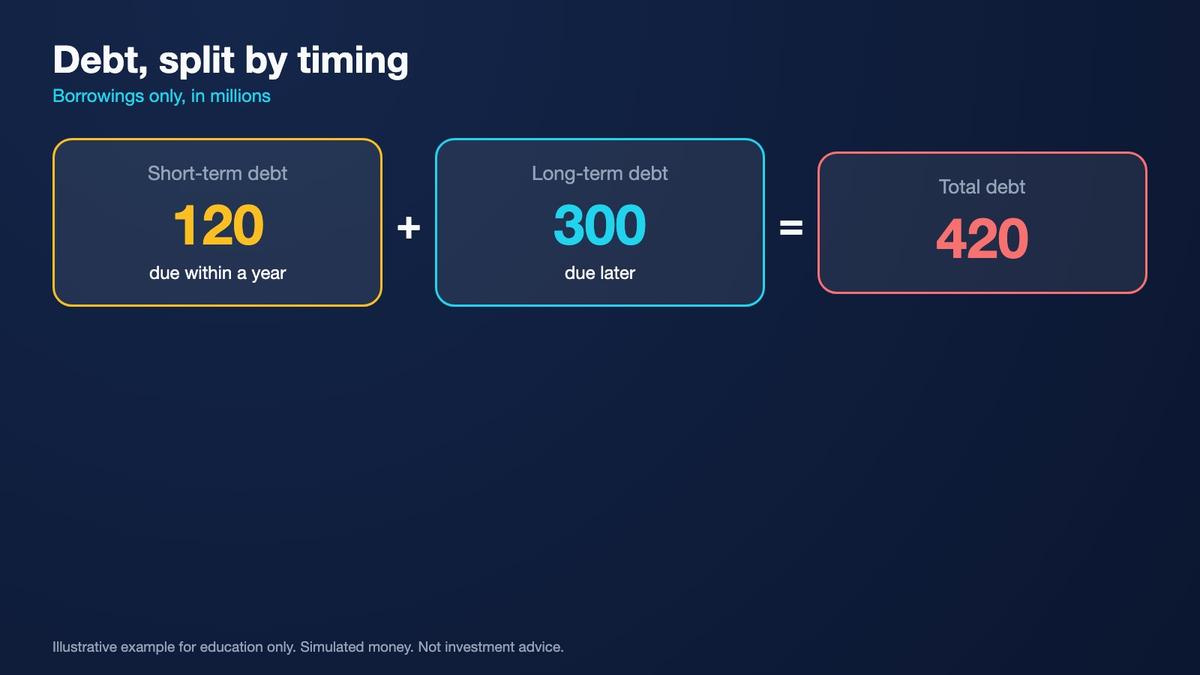
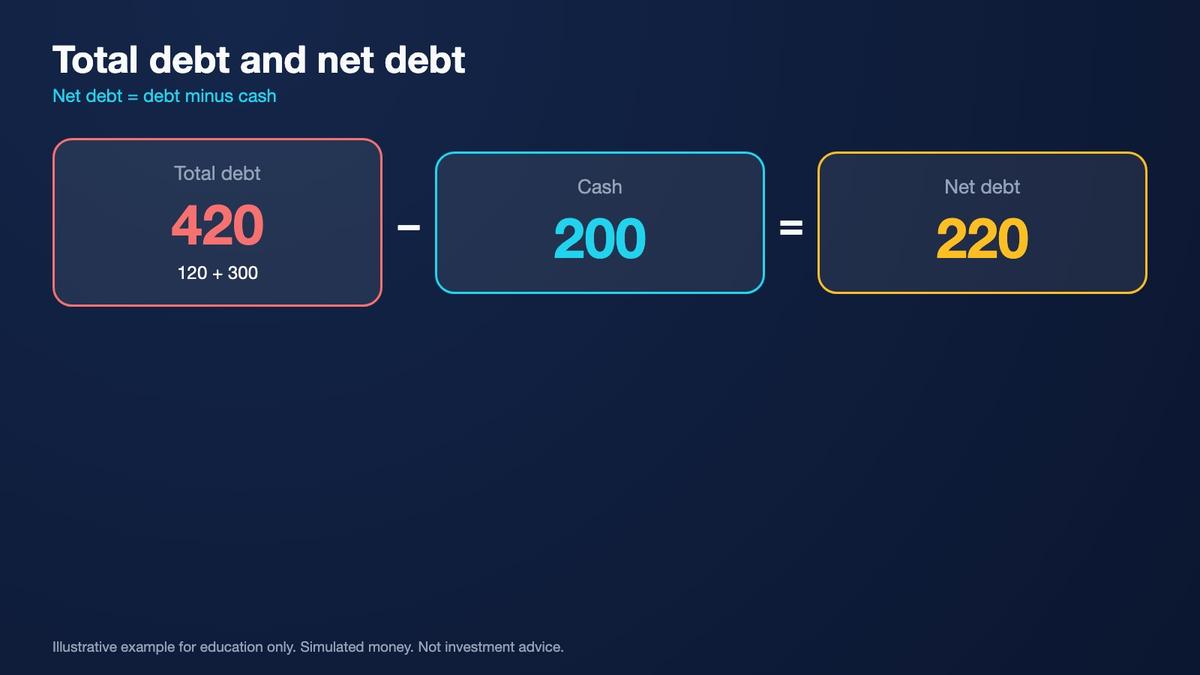
Total debt commonly combines short-term and long-term interest-bearing borrowings, although published definitions can vary. In our simplified Example Corp calculation, short-term debt is $120 million and long-term debt is $300 million. Total debt therefore equals exactly $420 million. Net debt subtracts cash and cash equivalents from total debt, producing $420 million minus $200 million, or $220 million. This simplified calculation assumes all reported cash can be used to offset debt and excludes adjustments sometimes included in other definitions.
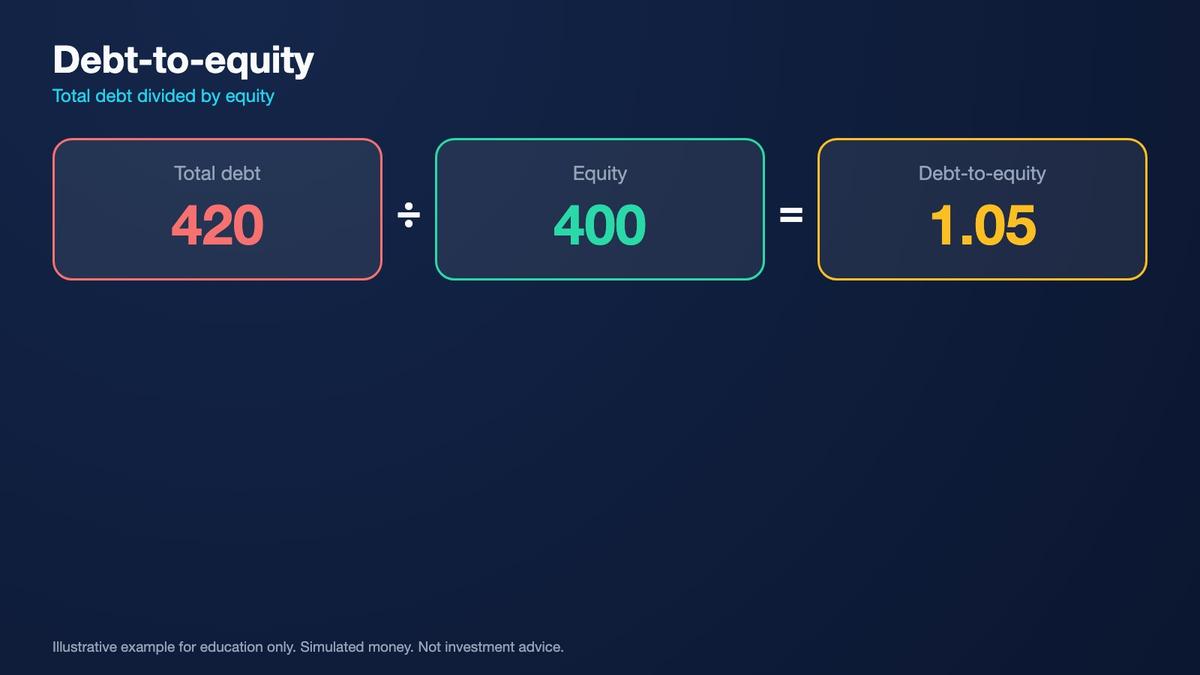
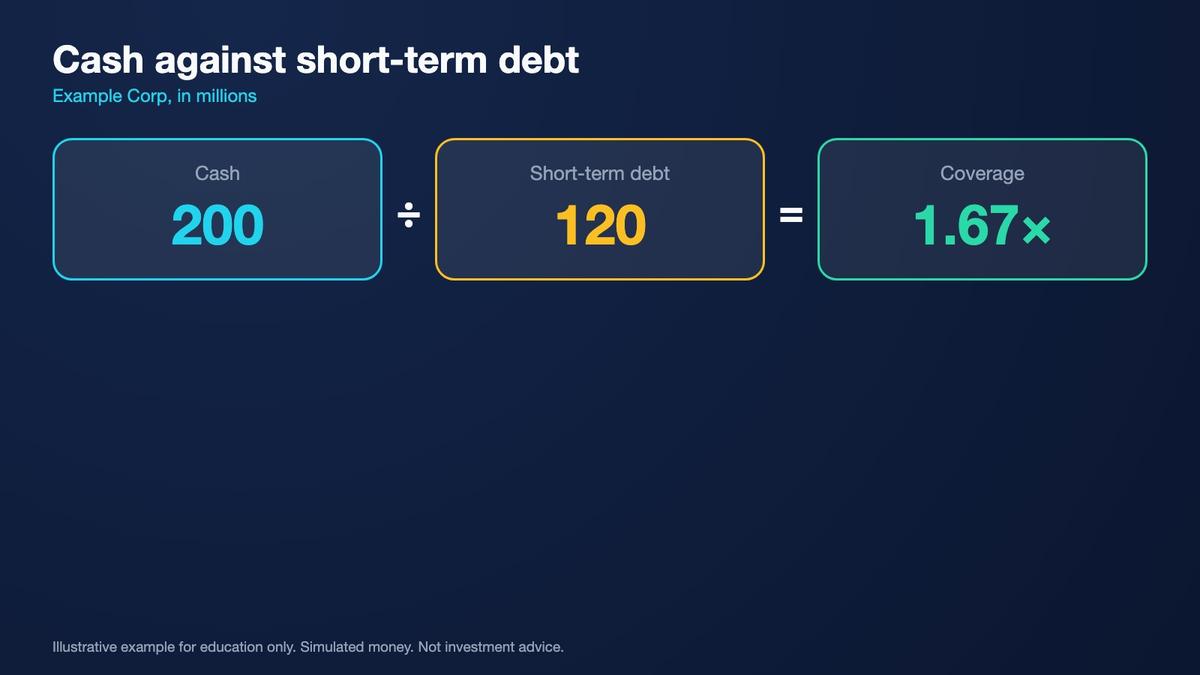
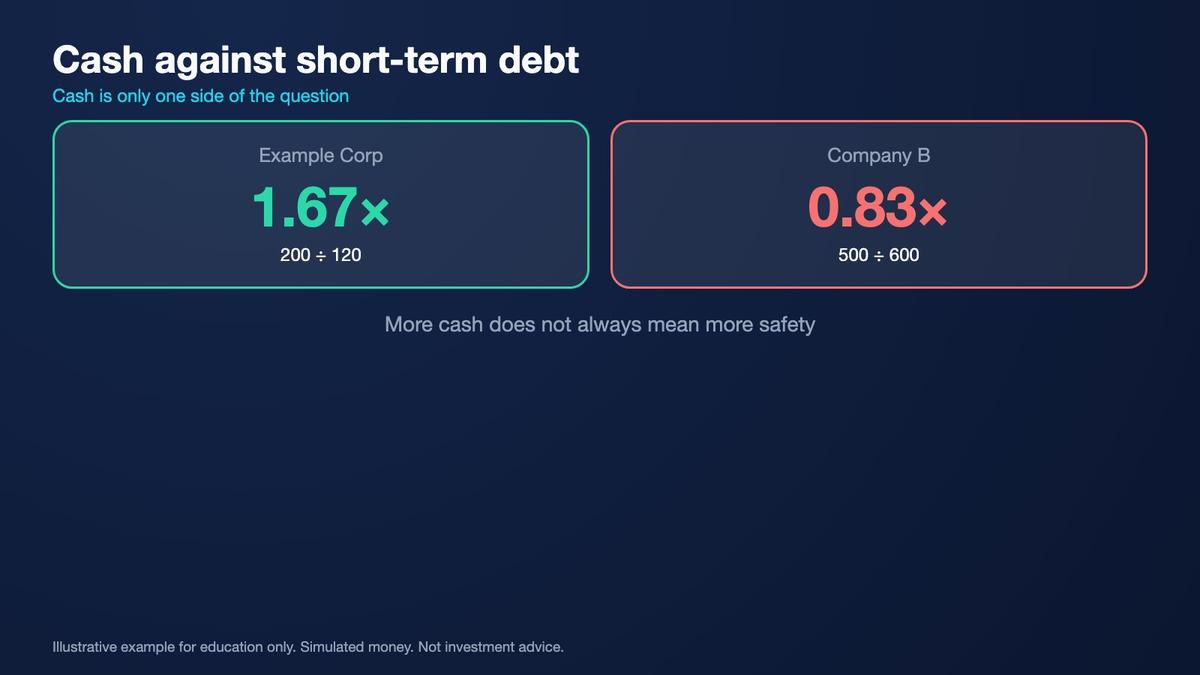
Debt-to-equity compares borrowings with book shareholders' equity. Example Corp's ratio is $420 million divided by $400 million, giving exactly 1.05 times. Another useful comparison is cash divided by short-term debt. Example Corp holds $200 million cash against $120 million short-term debt, producing exactly five-thirds, or approximately 1.67 times coverage. These calculations provide different perspectives on leverage and near-term borrowing obligations. They do not establish whether borrowing costs are affordable or repayments can be completed.
Key points
- Total debt = 120 + 300 = 420; net debt = 420 − 200 = 220.
- Debt-to-equity = 420 ÷ 400 = 1.05.
- Cash coverage of short-term debt: 200 ÷ 120 ≈ 1.67.
Cash coverage is especially easy to misunderstand. A company may report substantial cash while simultaneously facing payroll, supplier payments, taxes, capital expenditures, and debt maturities. Some cash may also be legally restricted or operationally unavailable. Consider hypothetical Company B, which holds $500 million cash but owes $600 million in short-term debt. Its cash coverage is five-sixths, approximately 0.83 times. Despite holding more cash than Example Corp, Company B has less direct cash coverage of short-term borrowings under this narrow measure.
Why Cash Is Not the Whole Story: Debt Terms, Maturities, and Interest
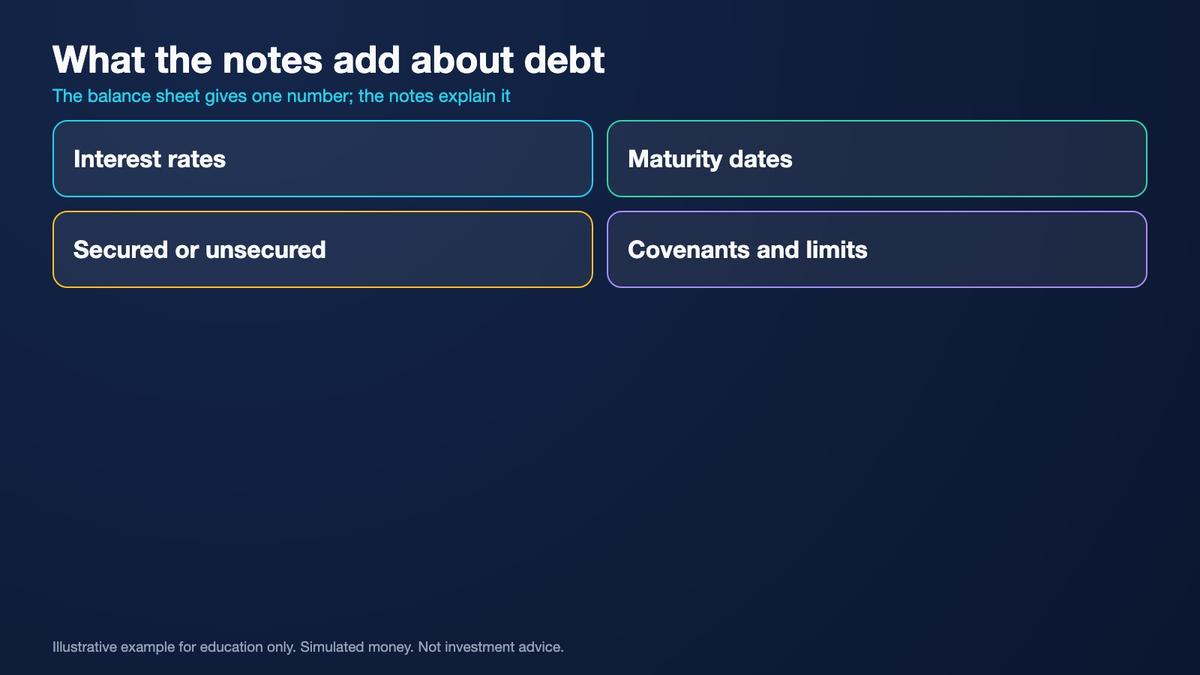
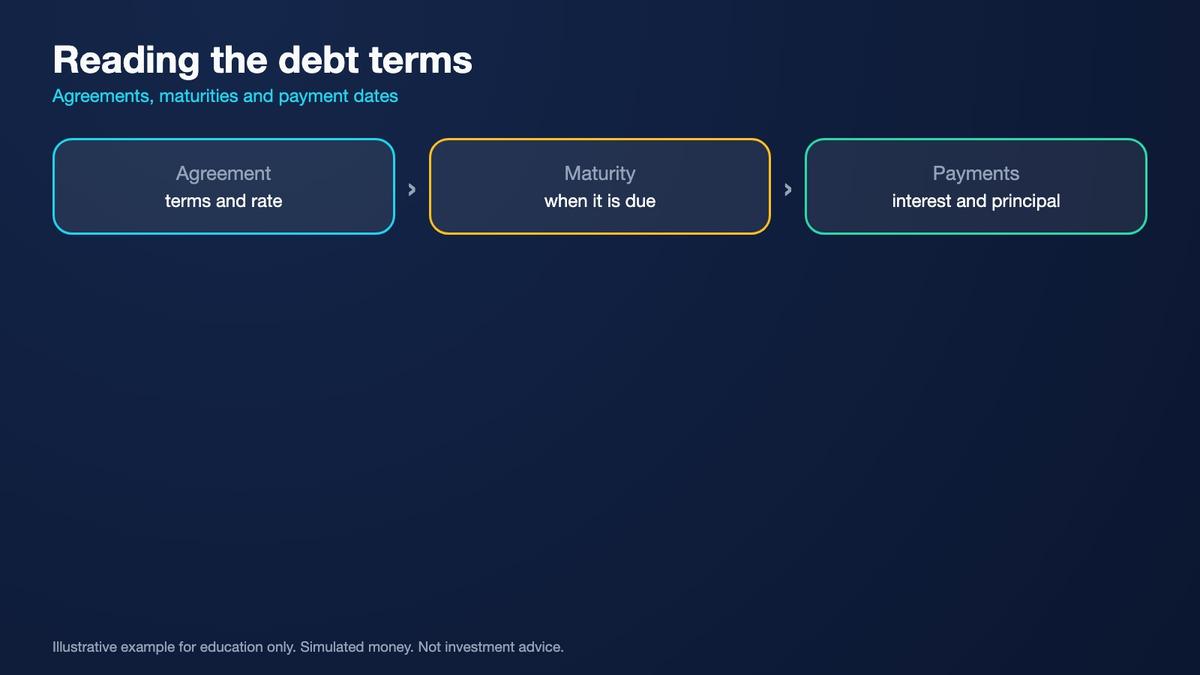
A cash balance represents only one component of a company's financial position. To understand debt-related risk, examine the amount owed, repayment dates, interest rates, security arrangements, covenants, and available financing options. Short-term obligations may create pressure even when total debt appears manageable. Long-term borrowings can also become problematic if future cash generation weakens or refinancing becomes expensive. The balance sheet provides the recorded amounts, while financial statement notes supply additional information about their economic and contractual characteristics.
Debt notes may describe fixed and variable interest rates, maturity schedules, borrowing facilities, lease obligations, collateral arrangements, and restrictions on the company's activities. Other long-term liabilities may also require substantial payments despite not being included in a simplified debt figure. Restricted cash deserves particular attention because reported cash may not be freely available to repay ordinary borrowings. Understanding the timing and purpose of cash commitments is often more informative than simply comparing two headline balances.
Key points
- Cash may have competing uses or restrictions.
- Company B: 500 of cash against 600 of short-term debt ≈ 0.83.
- Read the notes for rates, maturities and leases.
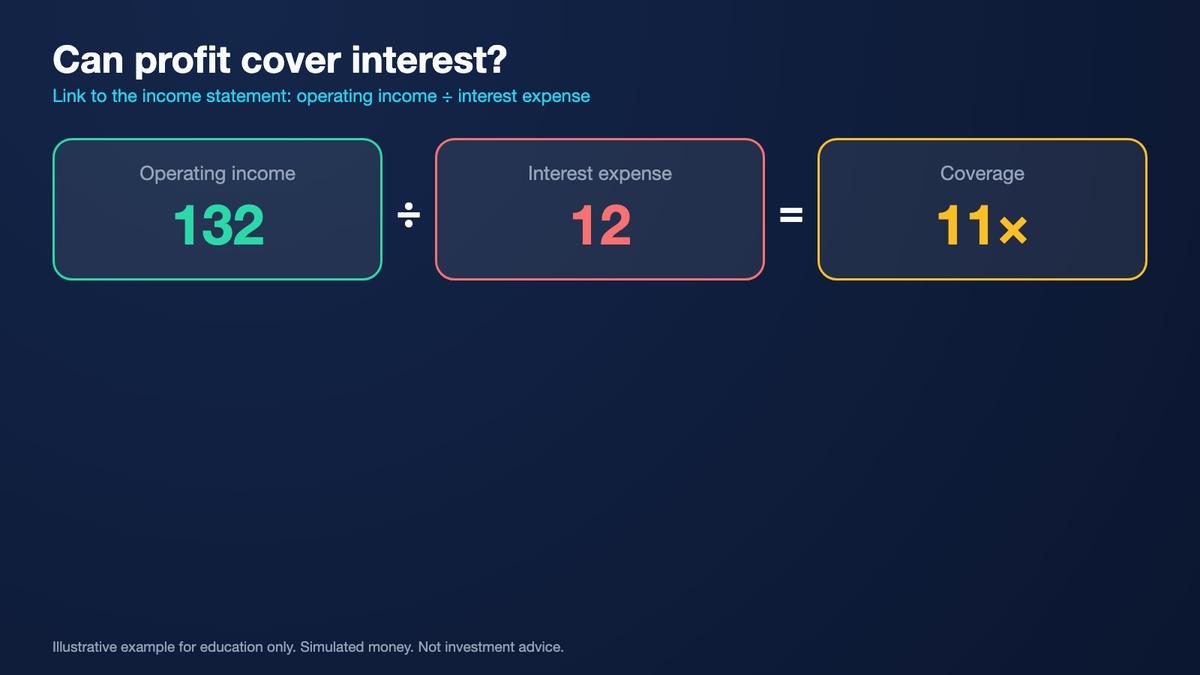
Link the balance sheet to the previous income-statement lesson. Example Corp reports Year 2 operating income of $132 million and interest expense of $12 million. Dividing operating income by interest expense gives exactly eleven times interest coverage under this simplified measure. This provides context for financing costs but does not replace cash-flow analysis. Operating income is an accounting measure, and cash needed for debt principal, capital expenditures, leases, or working capital may differ considerably.
Compare the Prior-Year Balance Sheet and Record Your Findings
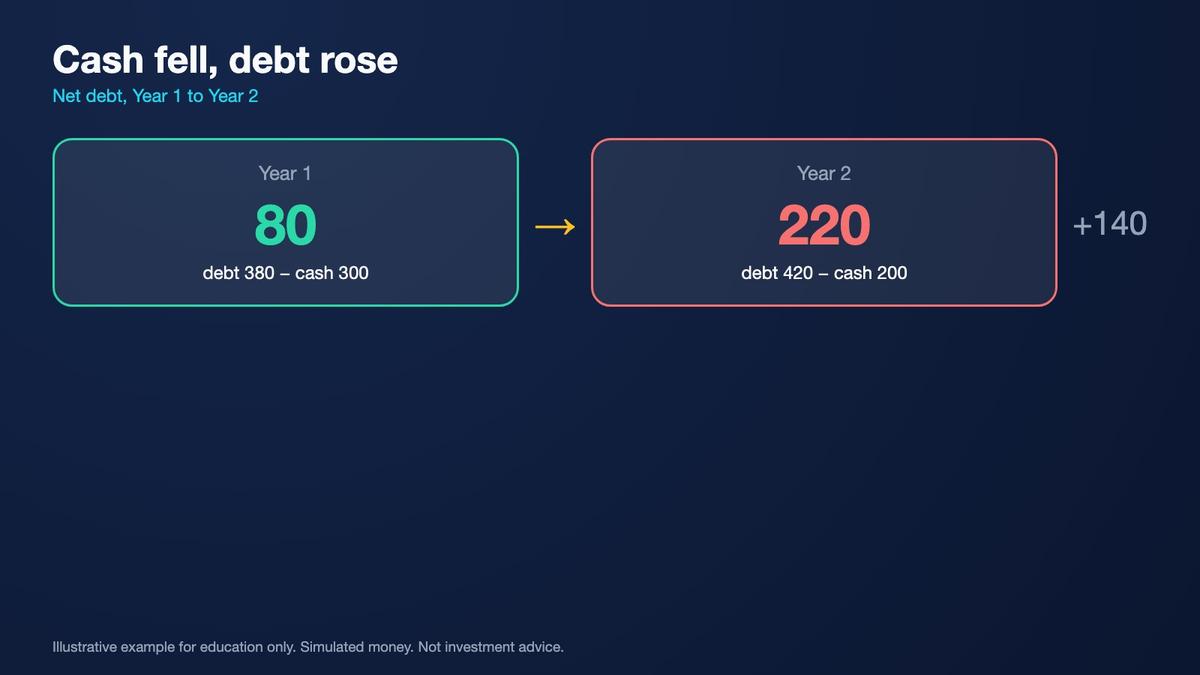
A balance sheet becomes more informative when compared with the prior-year column. Example Corp held $300 million cash and $380 million total debt in Year 1, producing $80 million net debt. In Year 2, cash falls to $200 million while total debt increases to $420 million. Net debt becomes $220 million. The change is exactly $140 million, reflecting a $100 million reduction in cash and a $40 million increase in debt. These movements require explanation rather than an automatic positive or negative judgment.
A decrease in cash can result from capital investment, acquisitions, debt repayment, shareholder distributions, operating losses, or changes in working capital. Debt can increase for similarly varied reasons. The balance sheet alone does not explain every cash movement. Review the cash-flow statement to understand operating, investing, and financing cash movements, and read MD&A for management's discussion. Confirm whether acquisitions, accounting reclassifications, or significant transactions affected comparability between the two dates.
Key points
- Net debt rose from 80 to 220 (+140).
- Cash fell 100 and debt rose 40.
- Interest cover: 132 ÷ 12 = 11 times.
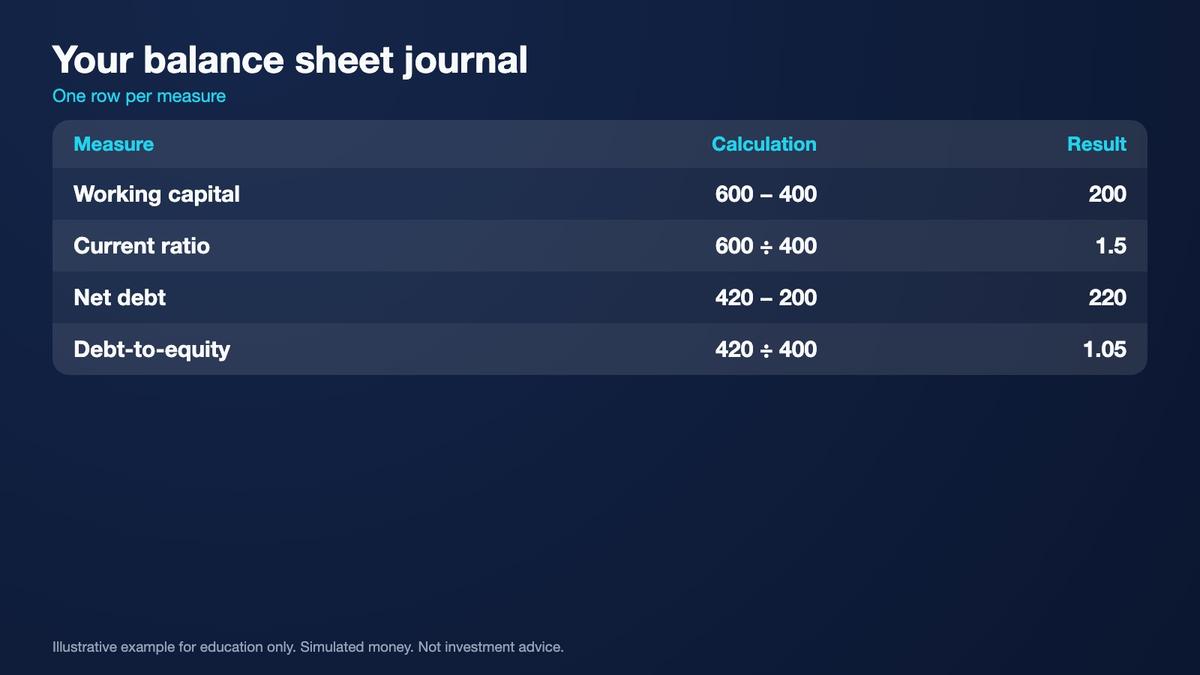
Maintain a reading journal recording the reporting date, currency units, current assets, current liabilities, borrowings, cash, equity, and calculated ratios. Include the source item and page reference from Form 10-K, usually Item 8 for the statements and notes. Record any assumptions about debt definitions or restricted cash. Compare results with the prior year, then write questions about maturities, liquidity, interest costs, and operating cash generation. These questions support disciplined analysis without predicting future share prices.
Final Practice: Compare Debt and Cash Without Oversimplifying
Your final checkpoint begins with the fictional Example Corp Year 2 balance sheet. Confirm that total assets equal $1,200 million, total liabilities equal $800 million, and shareholders' equity equals $400 million. Then calculate working capital of $200 million and a current ratio of 1.5 times. Next, calculate total debt of $420 million, net debt of $220 million, and debt-to-equity of 1.05 times. Explain what each measure describes and identify at least one important limitation.

Practice Lab: Compare Debt and Cash in a Hypothetical Balance Sheet
Use only the fictional Example Corp and hypothetical Company B figures in this lesson. All monetary values are in millions of US dollars. Calculate each ratio using the stated definitions and distinguish exact values from rounded presentations. Compare balances at the same reporting date, identify limitations, and record questions that would require financial statement notes or management discussion. Do not interpret any ratio as a guaranteed measure of financial safety. All activities are educational and use simulated research.
- Decision 1: Example Corp reports $200 million cash, $150 million receivables, $250 million inventory, $400 million current liabilities, and $500 million net property and equipment plus $100 million goodwill and intangibles. — Calculate total current assets, working capital, current ratio, and total assets.
- Decision 2: Example Corp has $120 million short-term debt, $300 million long-term debt, $200 million cash, and $400 million shareholders' equity. — Calculate total debt, net debt, debt-to-equity, and cash coverage of short-term debt.
- Decision 3: Example Corp reports Year 1 cash of $300 million and total debt of $380 million. In Year 2, cash falls to $200 million while total debt rises to $420 million. — Calculate net debt in both years and explain the movement.
- Decision 4: Hypothetical Company B has $500 million cash and $600 million short-term debt, while Example Corp has $200 million cash and $120 million short-term debt. — Which company has greater cash coverage of short-term debt under the simple ratio, and does that prove superior overall financial health?
- Decision 5: Example Corp reports operating income of $132 million and interest expense of $12 million in Year 2, while its balance sheet shows $420 million total debt. — Calculate interest coverage and explain why this income-statement ratio should be considered alongside debt balances and cash-flow information.
Answer key
Continue by comparing cash coverage of short-term debt. Example Corp has $200 million cash and $120 million short-term debt, approximately 1.67 times coverage. Hypothetical Company B has $500 million cash and $600 million short-term debt, approximately 0.83 times coverage. Although Company B holds more cash in absolute terms, its short-term borrowing obligations are even larger. This comparison demonstrates why the size of the cash balance alone cannot establish financial strength or repayment capacity.
Finish with the prior-year comparison. Example Corp's net debt increases from $80 million to $220 million, a $140 million rise. Read the financial statement notes and MD&A to investigate debt maturities, restricted cash, interest rates, other obligations, and reasons for the changes. Connect these observations with the eleven-times operating-income interest-coverage calculation. Your completed journal should explain liquidity and leverage together, acknowledge uncertainties, and avoid treating any one ratio as an investment recommendation.

Worked example at a glance
Key terms
- Balance sheet: a snapshot of assets, liabilities and equity at a date.
- Current assets: assets expected to become cash or be used within about a year.
- Current liabilities: obligations due within about a year.
- Working capital: current assets minus current liabilities.
- Current ratio: current assets divided by current liabilities.
- Total debt: short-term plus long-term borrowings.
- Net debt: total debt minus cash.
- Debt-to-equity: total debt divided by book equity.
- Book equity: assets minus liabilities, as recorded.
- Market value: what investors currently pay for the shares.
- Restricted cash: cash that is not free to use.
Multi Asset Trading Lab provides educational information only and does not constitute personalized investment, trading, financial, accounting, legal, or tax advice. Example Corp and Company B are entirely fictional, and all balances, debt amounts, cash figures, accounting statements, ratios, and comparisons are hypothetical educational examples. All exercises involve simulated research only; no real-money trading or investment is required or encouraged. A balance sheet describes recognized assets, liabilities, and equity at a reporting date and does not guarantee future liquidity, solvency, profitability, cash generation, or investment performance. Cash balances may be restricted, committed to operating needs, or unavailable for debt repayment. Accounts receivable may be difficult to collect, inventory may be difficult to sell, and recorded asset values may differ significantly from realizable market values. Debt obligations can involve variable interest rates, repayment schedules, covenants, collateral, refinancing requirements, and contractual restrictions. Current ratios, quick ratios, working capital, net debt, debt-to-equity, and interest-coverage measures are simplified analytical tools whose definitions and usefulness may vary by industry, accounting framework, and company circumstances. The simplified total-debt definition in this lesson includes stated short-term and long-term borrowings and does not automatically include every lease liability or other contractual obligation. Net debt calculations assume that reported cash is included without additional restrictions unless otherwise stated. Interest coverage based on operating income does not measure cash available for debt principal repayment and may differ from measures defined in lending agreements. Financial statements should be interpreted alongside notes, cash-flow statements, income statements, management discussion, reporting dates, and subsequent disclosures. Neither a large cash balance nor an attractive financial ratio guarantees financial strength or future shareholder returns. All calculations are for financial literacy and are not recommendations to buy, sell, or hold any security. Learners should verify official filings and seek qualified professional advice before making actual financial decisions.
Lesson Checkpoint
Review what you learned and get feedback on your work.