



In this ten-minute beginner lesson, learners read a U.S. public company's income statement, calculate revenue growth and profit margins, and explain why higher sales do not always produce higher operating income. Using fictional Example Corp, learners compare two financial years, calculate gross, operating, and net margins, distinguish percentage-point changes from percentage growth, and identify how costs, operating leverage, one-time items, and adjusted earnings affect reported performance.
What an Income Statement Shows
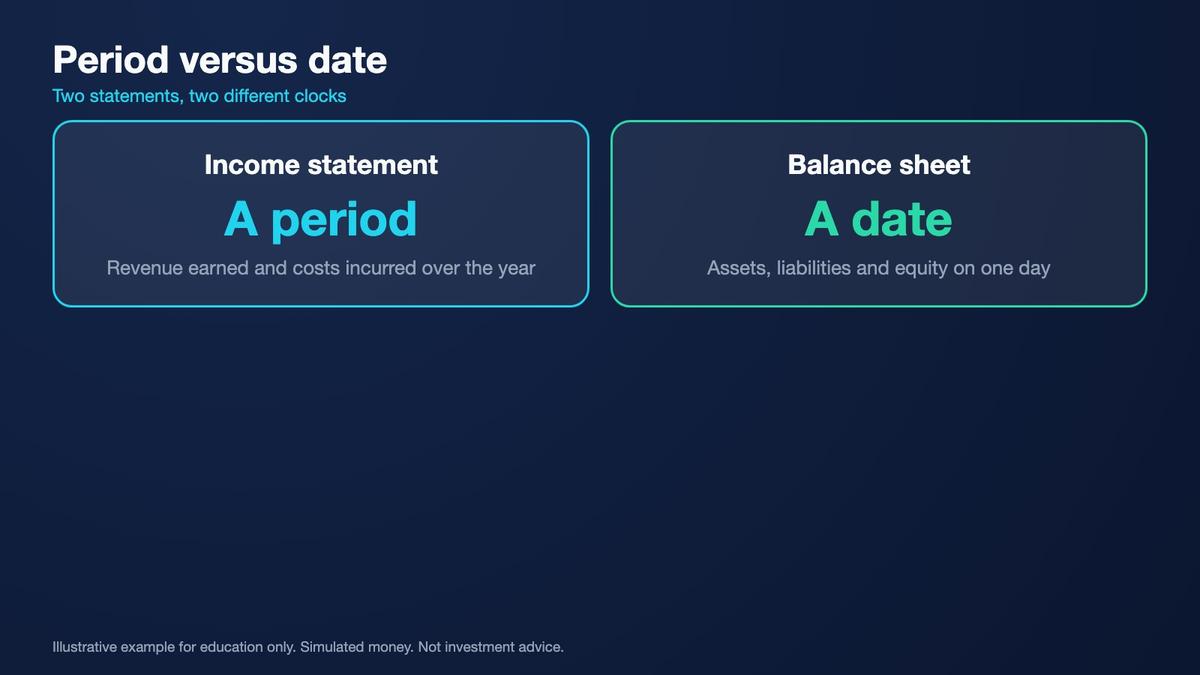
An income statement, also called a statement of operations or statement of earnings, explains a company's financial performance over a specified period. It shows recognized revenue, associated costs, operating expenses, financing items, taxes, and the resulting income or loss. Unlike a balance sheet, which describes assets, liabilities, and equity at a particular date, an income statement covers activity during a quarter or year. Understanding this distinction prevents learners from confusing financial performance with financial position.

In the previous lesson, we learned that annual financial statements appear in Item 8 of Form 10-K. Management's Discussion and Analysis, or MD&A, appears in Item 7 and provides management's explanations of operating performance and important developments. For this lesson, imagine reading the annual report of fictional Example Corp. We will compare two financial years using simplified financial statements. Every financial amount is expressed in millions of U.S. dollars unless otherwise noted.

Key points
- The income statement shows performance over a period.
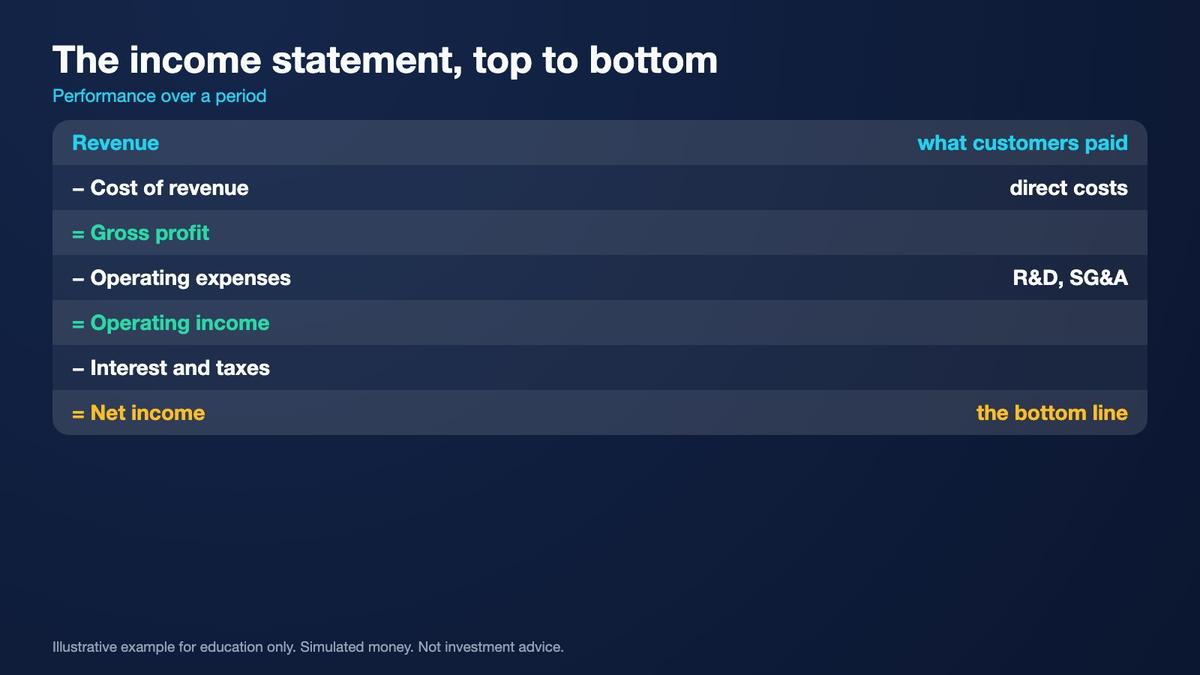
- It runs from revenue down to net income and earnings per share.
- The balance sheet, by contrast, is a snapshot at a date.
The central question is whether revenue growth and profit growth tell the same story. A company may increase sales while earning less profit because costs rise faster than revenue. Another company may increase sales modestly while producing much stronger profit growth because it operates more efficiently. Income statements help distinguish these possibilities. Learners should examine not only the amounts reported but also their relationships, reporting periods, accounting methods, and changes over time.
Revenue, Cost of Revenue, and Gross Profit
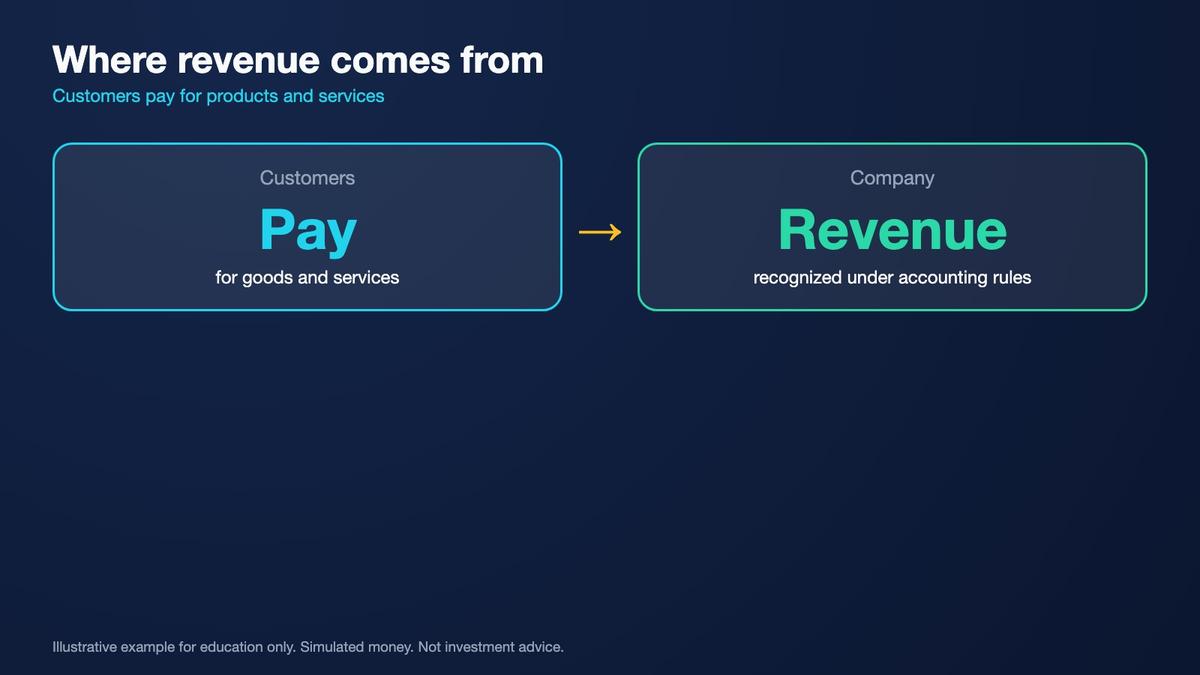
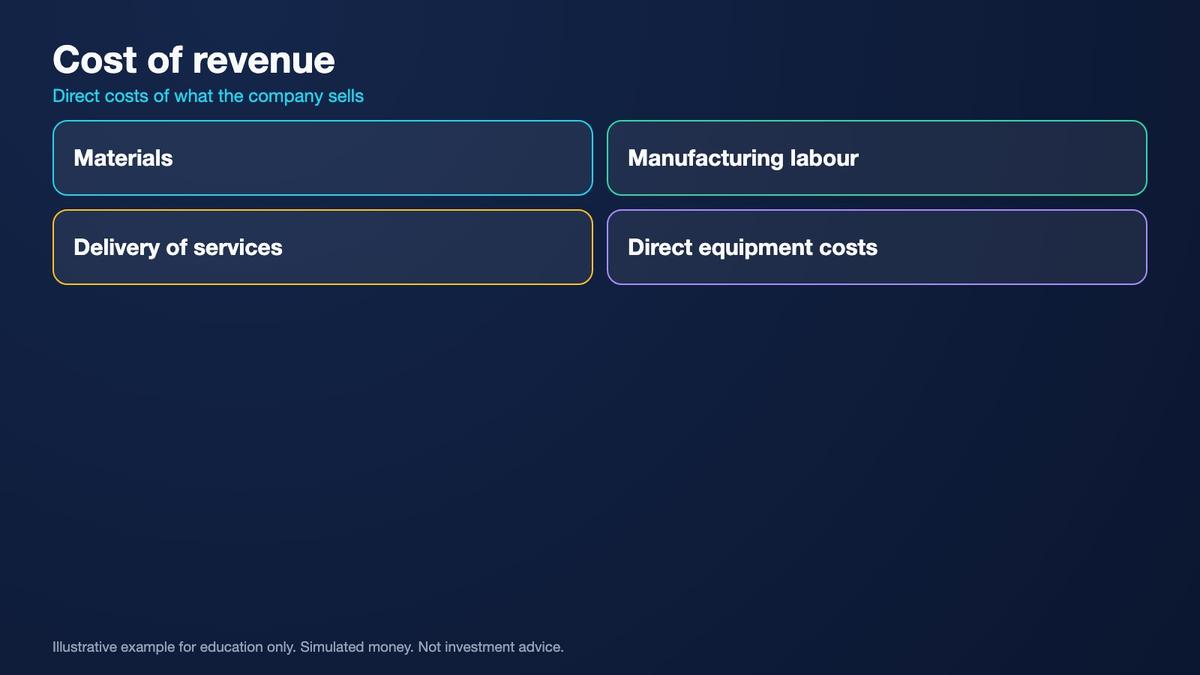
Revenue, sometimes described as net sales, usually appears near the top of the income statement. It represents revenue recognized from the company's activities under applicable accounting rules. Cost of revenue includes expenses directly associated with delivering the goods or services sold, although classifications vary by business and accounting policy. Subtracting cost of revenue from revenue produces gross profit. Gross profit shows how much remains before operating expenses, financing costs, income taxes, and other items.
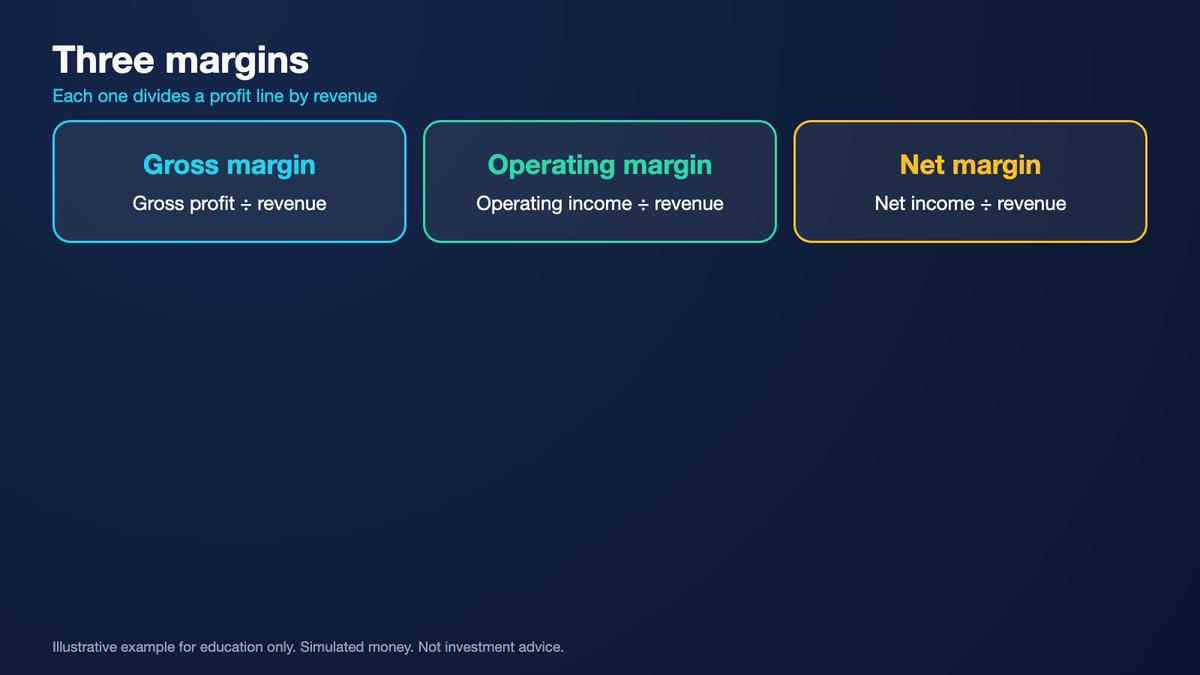
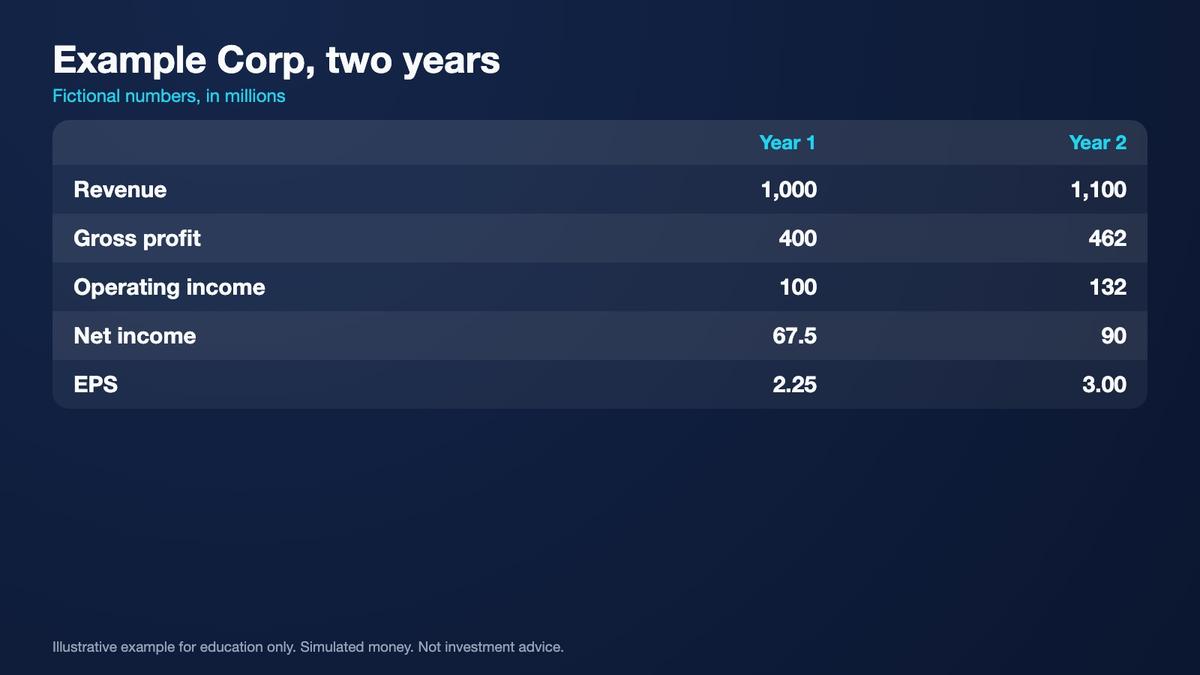
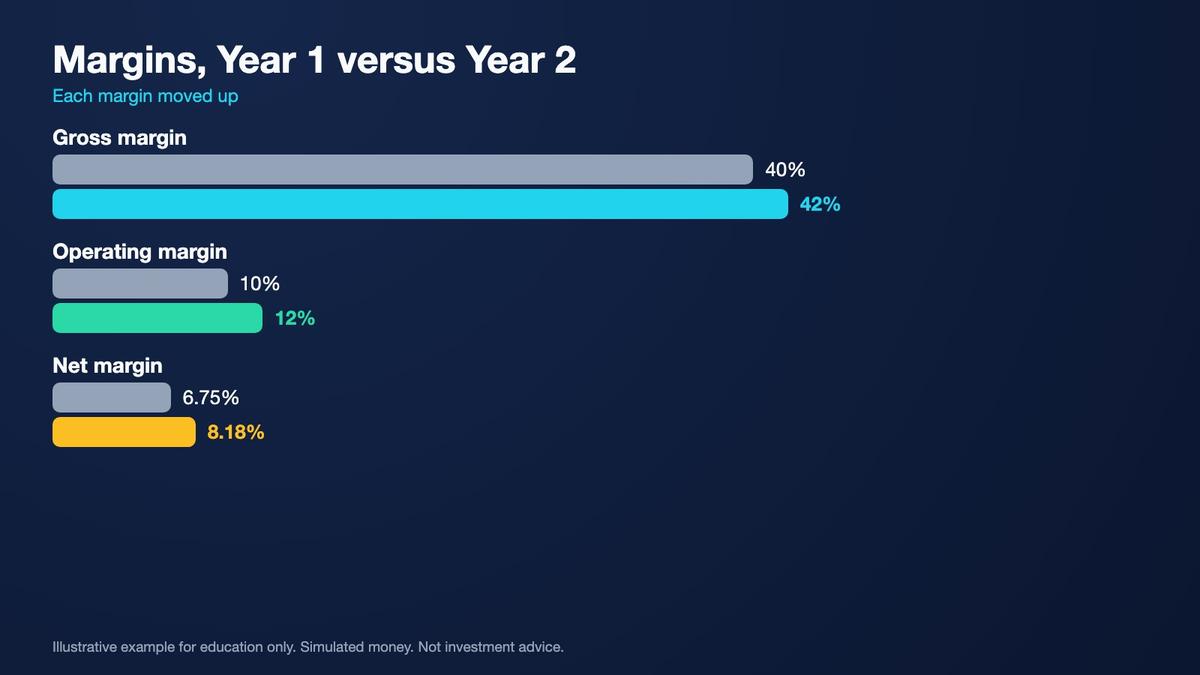
Example Corp reports Year 1 revenue of $1,000 million and cost of revenue of $600 million. Gross profit is therefore exactly $400 million. Gross margin equals gross profit divided by revenue, or $400 million divided by $1,000 million, producing forty percent. In Year 2, revenue increases to $1,100 million while cost of revenue reaches $638 million. Gross profit becomes $462 million, and the gross margin rises to exactly forty-two percent.
Key points
- Revenue (net sales) is the top line.
- Gross profit = revenue − cost of revenue.
- Gross margin = gross profit ÷ revenue: 400 ÷ 1,000 = 40%, then 462 ÷ 1,100 = 42%.
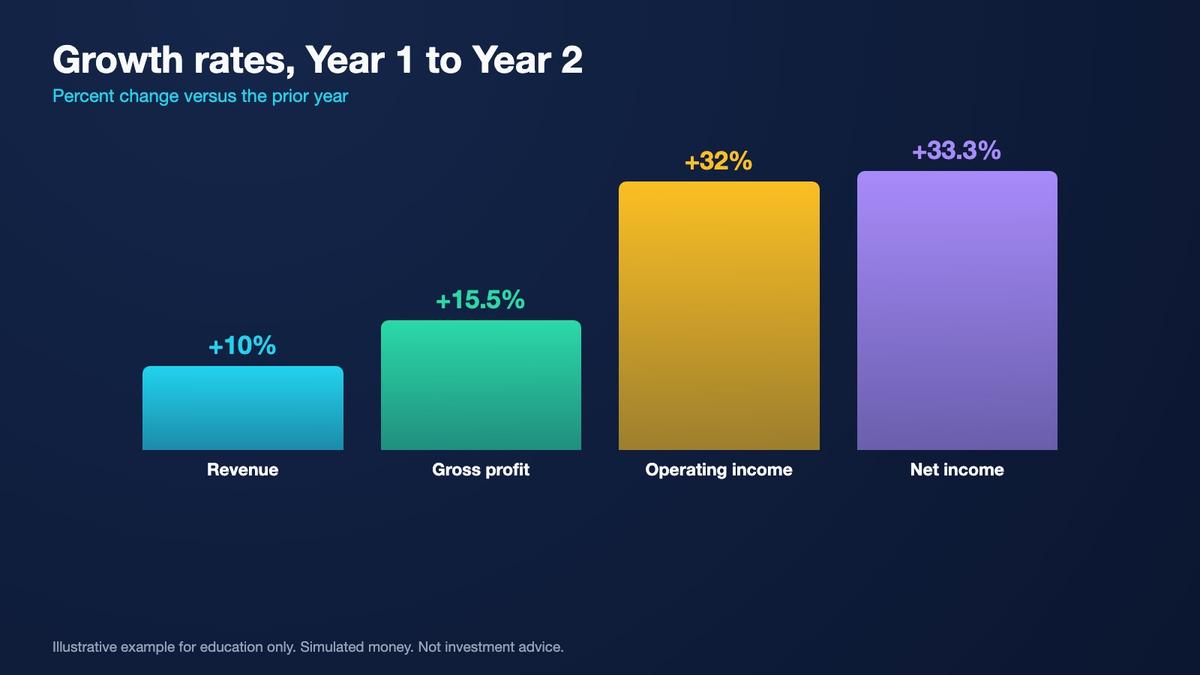
Revenue growth is calculated by subtracting the previous period's revenue from the current period's revenue, then dividing by the previous period. Example Corp's growth is ($1,100 million minus $1,000 million) divided by $1,000 million, giving ten percent. Gross profit grows from $400 million to $462 million, or exactly 15.5 percent. The faster growth in gross profit indicates that direct costs increased more slowly than revenue in this simplified example.
Operating Expenses, Operating Income, and Operating Margin
Below gross profit, many income statements show operating expenses such as research and development, selling expenses, general administration, and other operating costs. These expenses support the company's activities but are not included in its reported cost of revenue. Subtracting operating expenses from gross profit produces operating income under the simplified presentation used here. Operating income describes profit from operations before the financing and tax items presented below it. Actual financial statements may contain additional operating line items.

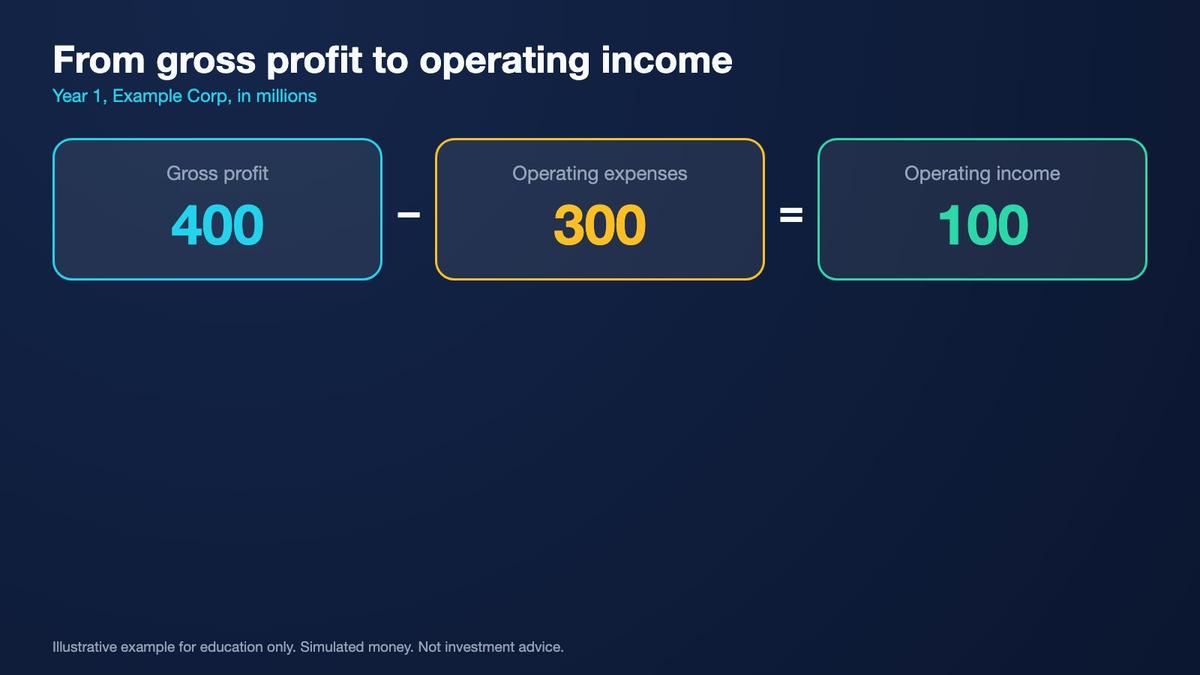
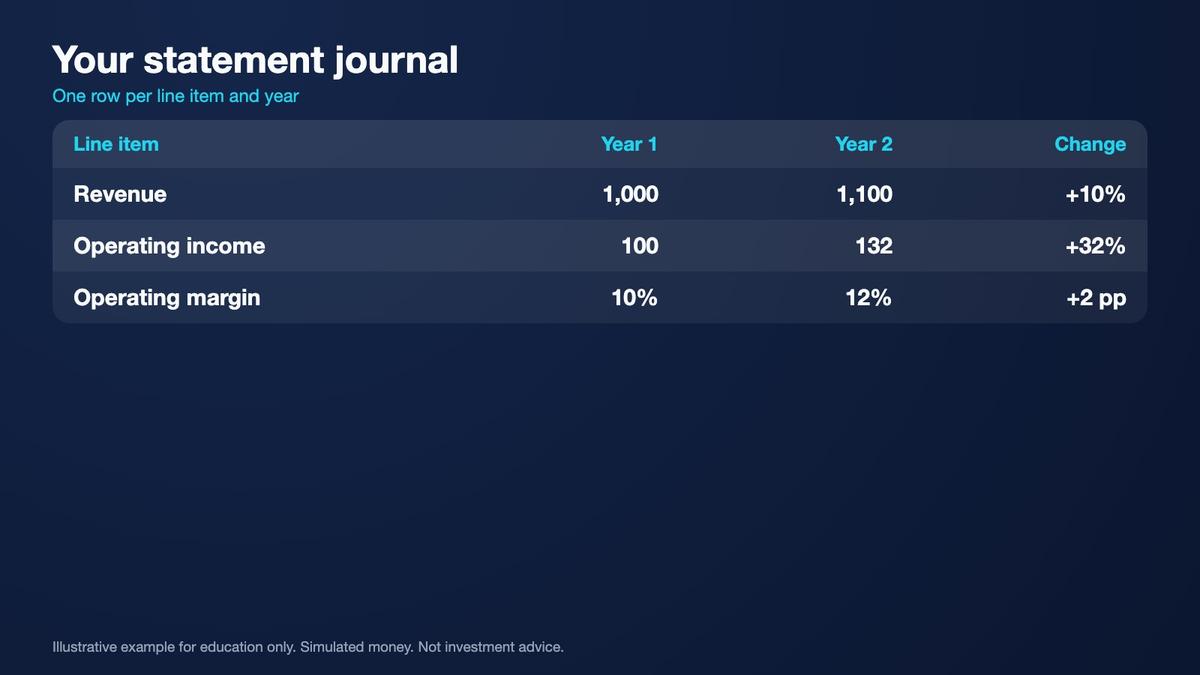
Example Corp records Year 1 operating expenses of $300 million. Gross profit of $400 million minus those expenses produces $100 million operating income. Dividing operating income by $1,000 million revenue gives a ten-percent operating margin. In Year 2, operating expenses rise to $330 million. Gross profit reaches $462 million, leaving $132 million operating income. Dividing $132 million by $1,100 million revenue produces an operating margin of exactly twelve percent.
Key points
- Operating income = gross profit − operating expenses.
- Operating margin = operating income ÷ revenue: 10%, then 12%.
- Operating income grew 32% on only 10% more revenue.
Operating income increased from $100 million to $132 million, representing thirty-two-percent growth. This is substantially faster than the company's ten-percent revenue growth. Operating margin increased from ten percent to twelve percent, an improvement of exactly two percentage points. The distinction matters because revenue growth measures expansion in sales, while operating margin measures the share of revenue remaining after operating costs. Combining both gives a clearer picture of business performance.

From Operating Income to Net Income and Earnings Per Share
Operating income is not necessarily the final profit reported to shareholders. Below operating income, companies may report interest income, interest expense, other income or expenses, and income tax expense. In the simplified Example Corp statement, interest expense is the only item between operating income and income before taxes. Year 1 operating income of $100 million minus $10 million interest expense leaves $90 million income before taxes. A hypothetical twenty-five-percent income tax expense equals $22.5 million.
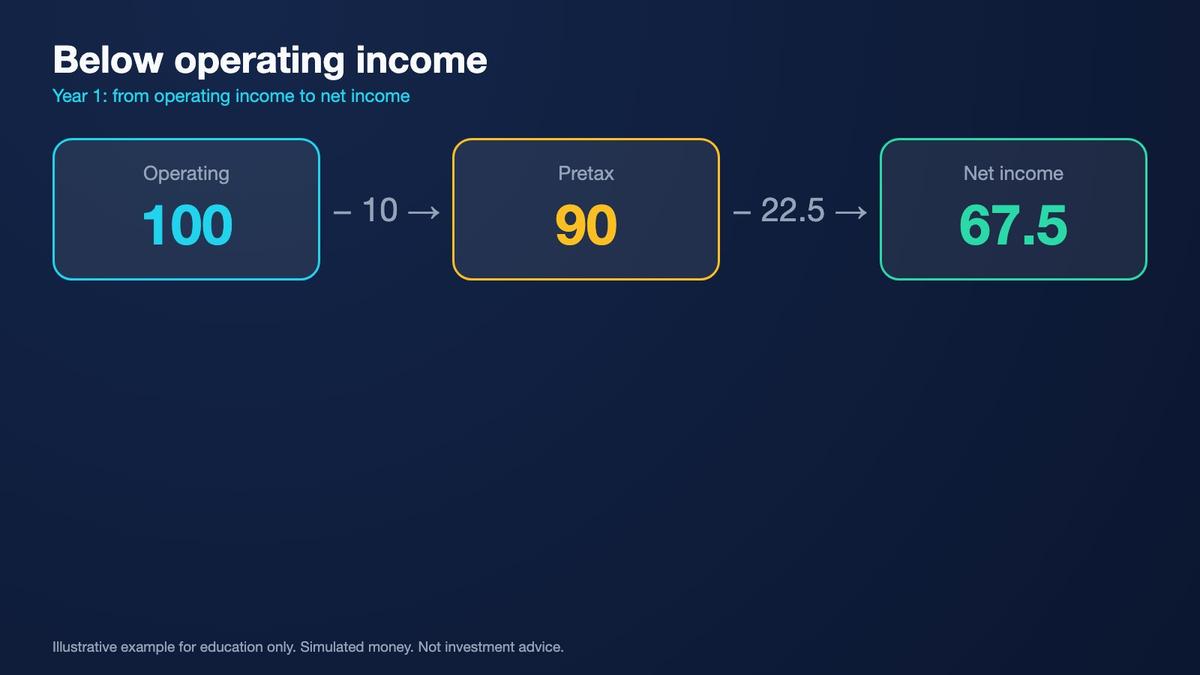
Subtracting Year 1 tax expense from pretax income produces $67.5 million net income. Dividing net income by $1,000 million revenue gives a net margin of exactly 6.75 percent. In Year 2, operating income reaches $132 million and interest expense increases to $12 million, leaving $120 million income before taxes. Applying the same assumed twenty-five-percent tax rate produces $30 million tax expense and $90 million net income, equivalent to approximately 8.18 percent of revenue.
Key points
- Pretax income = operating income − interest.
- Net income = pretax income − tax (25% in the example).
- EPS = net income ÷ weighted average shares: $2.25 to $3.00.
Earnings per share, or EPS, connects earnings attributable to ordinary shareholders with weighted-average shares. Basic EPS generally uses weighted-average common shares, while diluted EPS reflects specified potentially dilutive instruments under accounting rules. Assuming Example Corp has 30 million weighted-average shares in both years, no preferred-share adjustments, and no dilution, basic EPS equals $2.25 in Year 1 and $3.00 in Year 2. EPS increases by exactly one-third, approximately 33.3 percent, matching net income growth because the share count remains unchanged.

Revenue Growth Versus Margin Growth and Operating Leverage
Revenue growth describes the percentage change in sales between comparable periods. Margin growth describes how profitability ratios change. These measures should not be confused. Example Corp's revenue rises ten percent, while gross margin increases from forty to forty-two percent and operating margin from ten to twelve percent. Each margin improves by two percentage points. Relative to its original ten-percent operating margin, the move to twelve percent also represents a twenty-percent relative increase in the margin ratio.

Operating leverage describes how changes in revenue can produce proportionally larger changes in operating income when the cost structure does not increase at the same rate. Example Corp illustrates positive operating leverage. If its Year 2 operating margin had remained at ten percent, $1,100 million revenue would have generated $110 million operating income. Actual operating income is $132 million. The difference is exactly $22 million, attributable mathematically to the two-percentage-point margin expansion on Year 2 revenue.
Key points
- Revenue growth and margin growth are different questions.
- Margin expansion added 22 (132 vs 110 at the old margin).
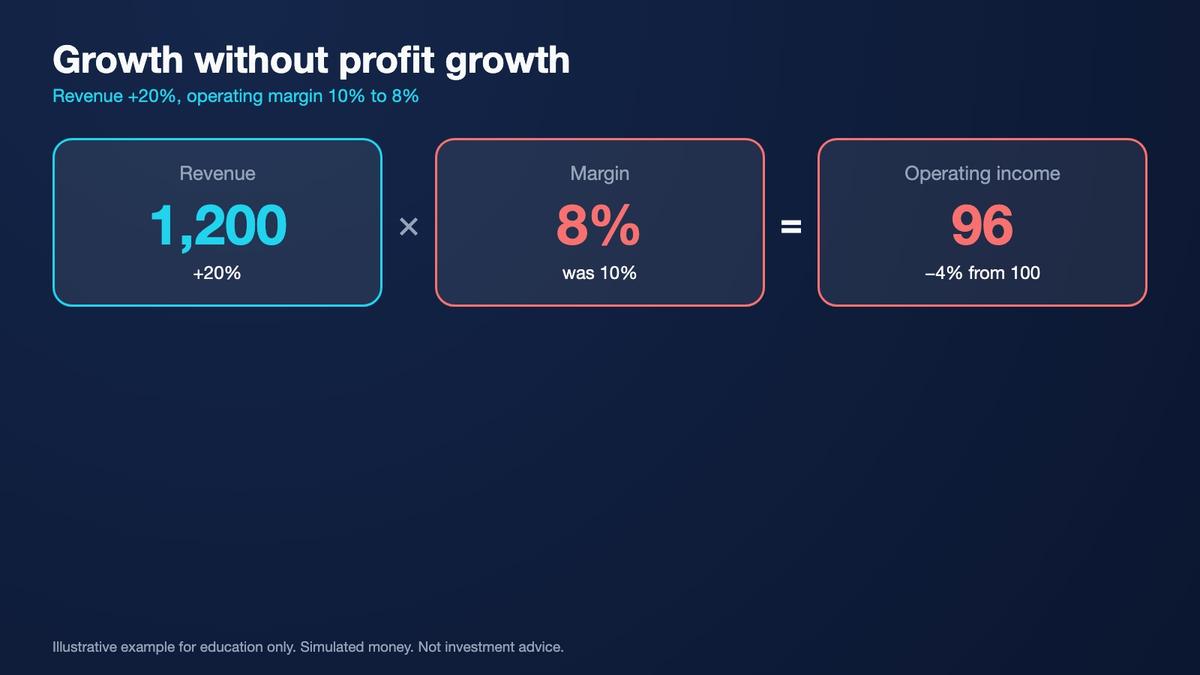
- Contrast case: revenue +20%, margin 10% to 8%, operating income −4%.
Operating leverage can work against a business too. Imagine an alternative Example Corp scenario where revenue rises twenty percent from $1,000 million to $1,200 million, but operating margin falls from ten percent to eight percent. Operating income would equal eight percent of $1,200 million, or $96 million. That is four percent below the original $100 million. Higher revenue therefore does not guarantee higher operating profit. Margin performance, cost behavior, and revenue growth must be examined together.
Percentage Points, Unusual Items, and Adjusted Earnings
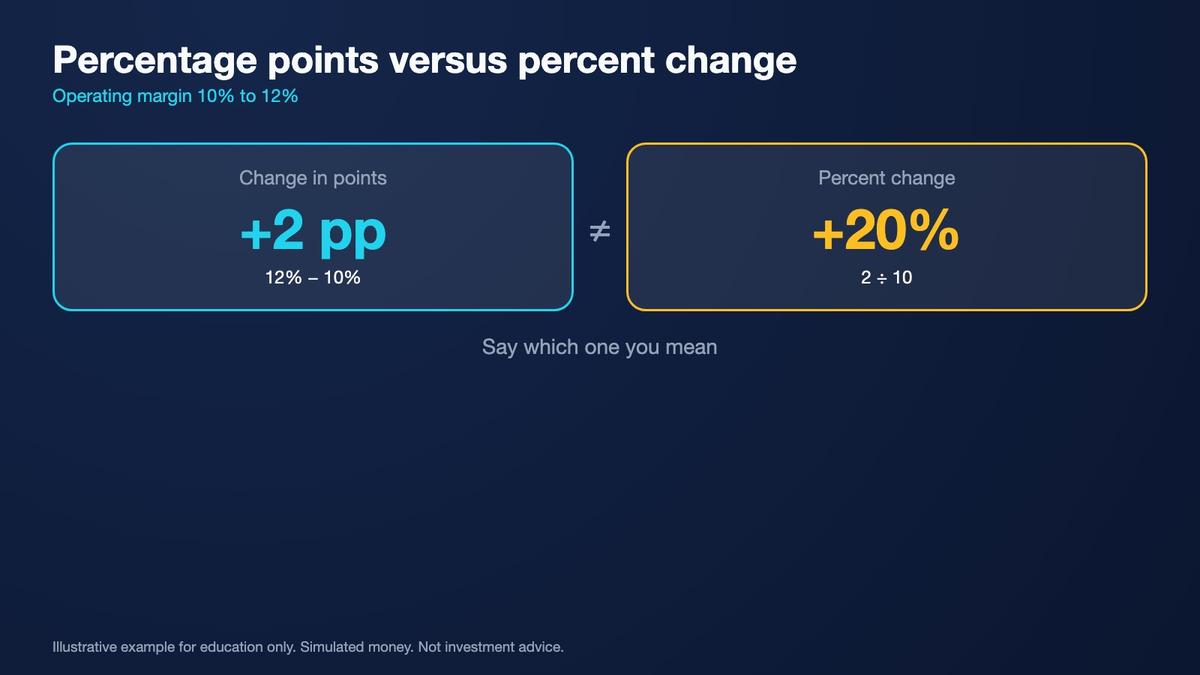
Percentage points describe the arithmetic difference between two percentages. Example Corp's operating margin rises from ten percent to twelve percent, which is an increase of two percentage points. The relative percentage change in the margin itself is twenty percent because the two-point increase is divided by the original ten-percent margin. These statements describe different measurements. Financial explanations should specify which one is intended, especially when discussing changes in profitability ratios.
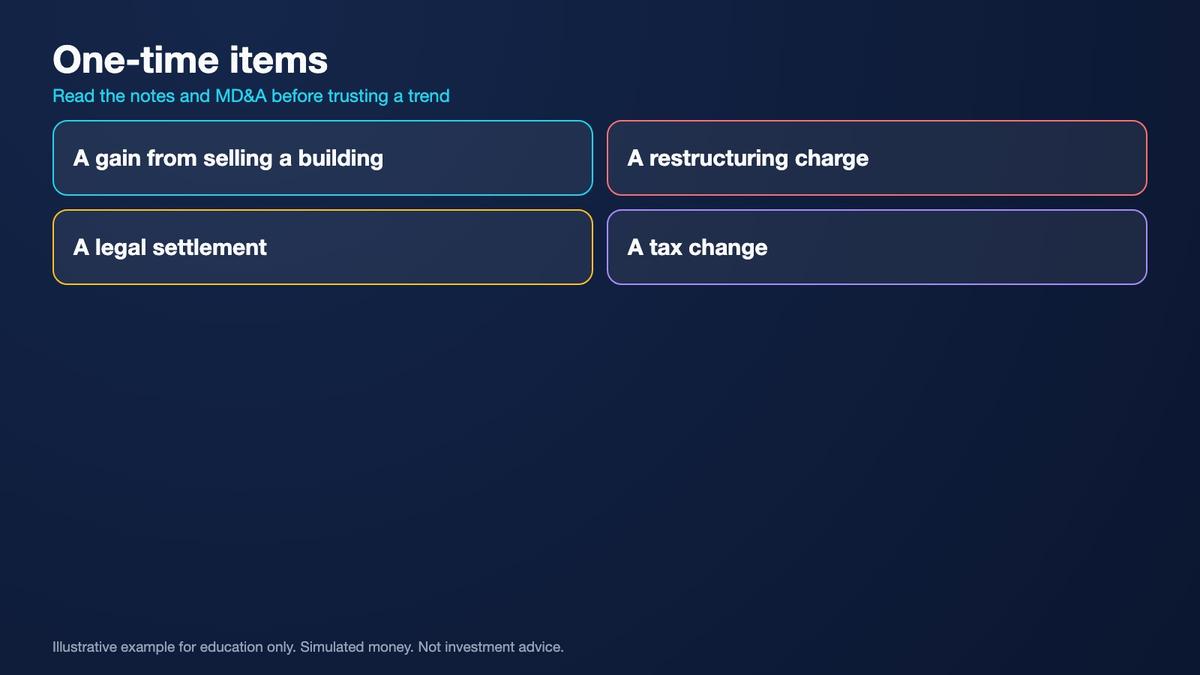
Income statements may include unusual or nonrecurring items such as restructuring expenses, asset impairments, litigation-related charges, or gains from selling assets. Such items can affect reported profit and complicate comparisons across periods. A charge described as one-time may still represent a real economic cost. Read the accompanying notes and MD&A to understand what occurred, how management classified the amount, and whether similar items appeared in earlier periods.
Key points
- Margin changes are in percentage points, not percent.
- Read the notes for one-time items.
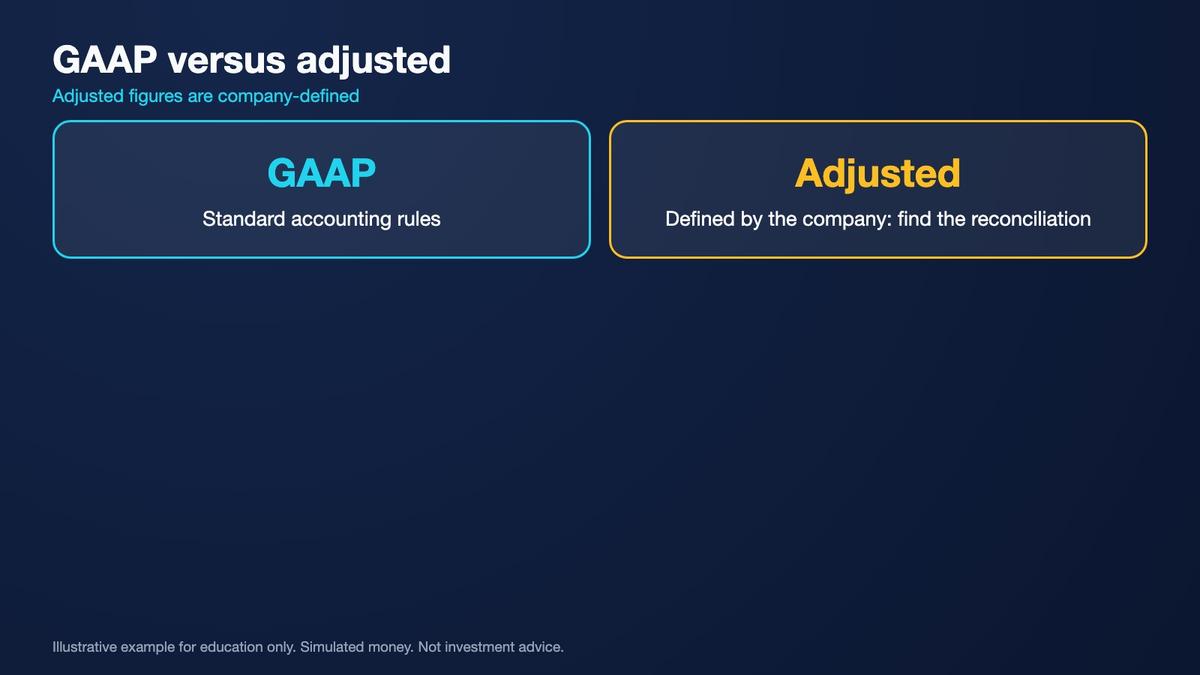
- Adjusted results are company-defined: find the reconciliation.
U.S. public companies report financial information under applicable accounting standards, including U.S. GAAP for domestic issuers. They may also present adjusted or non-GAAP measures that remove or modify selected items. Adjusted figures are defined by the reporting company and should not automatically replace GAAP results. Examine the reconciliation between adjusted and reported figures, understand every adjustment, and check whether the presentation is consistent over time. Removing an expense from an adjusted measure does not mean the economic cost disappeared.
Read Multiple Years and Record Findings in Your Journal
A 10-K commonly presents multiple comparative periods for income-statement information, allowing readers to examine trends across several years. When three years are available, place the figures side by side and calculate revenue growth, gross profit growth, operating income growth, net income growth, and EPS growth. Then calculate the corresponding margins for each period. Verify the fiscal year-end dates, reporting units, and whether accounting classifications have changed. A consistent comparison is more useful than isolated headline figures.
Quarterly figures require additional care. A three-month reporting period should not be compared directly with an annual total without an appropriate adjustment or explanation. Seasonal businesses may generate substantially different revenue and margins at different times of year. Compare equivalent quarters or trailing periods when relevant. Read Item 7 MD&A for management's explanations, and confirm important accounting information in Item 8 financial statements and accompanying notes.
Key points
- Compare matching periods and units.
- Log line items, growth and margin math, and page references.
- Check the MD&A before concluding.
Maintain a reading journal with the company name, filing date, fiscal year, source page, reported amounts, calculated percentages, and questions requiring further research. For Example Corp, record ten-percent revenue growth, 15.5-percent gross profit growth, thirty-two-percent operating income growth, and approximately 33.3-percent net income growth. Record the gross and operating margin improvements separately as two-percentage-point increases. This distinction supports the lesson's main outcome: explaining how changes in revenue and changes in profitability contribute differently to earnings.
Final Practice: Explain Revenue Growth and Margin Growth
Your final checkpoint is to write a short financial explanation using the fictional Example Corp figures. Begin by stating that revenue increased from $1,000 million to $1,100 million, or ten percent. Then explain that gross profit increased from $400 million to $462 million, or 15.5 percent. Gross margin rose from forty to forty-two percent, an improvement of two percentage points. These results show that gross profitability improved faster than sales in the simplified example.
Practice Lab: Explain Revenue Growth Versus Margin Growth
Use only fictional Example Corp financial figures. All monetary amounts are in millions of US dollars except earnings per share. Calculate growth as the change divided by the prior-period amount. Calculate margins as the relevant profit measure divided by revenue. Express differences between margin percentages in percentage points, and distinguish those differences from relative percentage growth. Show calculations before reading the answers. No real-money trading or investment is required.
- Decision 1: Example Corp reports Year 1 revenue of $1,000 million and Year 2 revenue of $1,100 million. Cost of revenue increases from $600 million to $638 million. — Calculate revenue growth, gross profit in both years, gross profit growth, and gross margins.
- Decision 2: Example Corp reports Year 1 operating income of $100 million on $1,000 million revenue and Year 2 operating income of $132 million on $1,100 million revenue. — Calculate both operating margins, operating income growth, and the additional Year 2 operating income associated with margin expansion.
- Decision 3: Example Corp records Year 1 income before taxes of $90 million, Year 2 income before taxes of $120 million, and an assumed income tax expense equal to 25% of pretax income in both years. — Calculate net income, net margins, and year-over-year net income growth.
- Decision 4: Example Corp has basic earnings attributable to common shareholders equal to net income and 30 million weighted-average common shares in both years, with no preferred dividends or potentially dilutive instruments. — Calculate basic EPS for each year and explain why EPS growth equals net income growth.
- Decision 5: In an alternative fictional scenario, Example Corp's revenue grows from $1,000 million to $1,200 million while operating margin falls from 10% to 8%. — Calculate revenue growth, new operating income, and operating income growth. Explain the apparent contradiction.
Answer key
Next, explain operating performance. Operating income increased from $100 million to $132 million, or thirty-two percent. Operating margin rose from ten to twelve percent, also an increase of two percentage points. At an unchanged ten-percent margin, Year 2 operating income would have been $110 million. Actual operating income was $22 million higher. This calculation illustrates how margin expansion contributed to profit growth beyond the effect of higher revenue alone.
Finally, explain the contrasting case: if sales increased twenty percent to $1,200 million but operating margin declined to eight percent, operating income would fall to $96 million, a four-percent decrease. The lesson is that sales growth, profitability ratios, and actual profit growth must be evaluated together. Review unusual items, accounting notes, adjusted measures, and MD&A before interpreting financial trends. All Example Corp figures are fictional, and the exercise involves research and simulated learning only.

Worked example at a glance
Key terms
- Income statement: the statement of performance over a period.
- Revenue: recognized sales of goods and services (net sales).
- Cost of revenue: the direct costs of what the company sells.
- Gross profit: revenue minus cost of revenue.
- Gross margin: gross profit divided by revenue.
- Operating income: gross profit minus operating expenses.
- Operating margin: operating income divided by revenue.
- Net income: profit after interest and taxes.
- EPS: earnings per share: net income divided by weighted average shares.
- Percentage points: the arithmetic difference between two percentages.
- Operating leverage: profit growing faster than sales when costs grow slowly.
- GAAP: standard accounting rules; adjusted figures are company-defined.
Multi Asset Trading Lab provides educational information only and does not constitute personalized investment, trading, financial, accounting, legal, or tax advice. All financial statements, revenue figures, costs, margins, tax assumptions, earnings per share, growth rates, and business scenarios in this lesson relate exclusively to the fictional Example Corp. All examples use hypothetical data and simulated learning; no real-money investing or trading is required or encouraged. Income statements describe financial performance during historical reporting periods and do not guarantee future revenue, profitability, cash generation, or shareholder returns. Revenue growth, margin expansion, operating leverage, net income growth, and EPS growth can reverse because of business conditions, costs, competition, accounting estimates, financing changes, taxes, and other factors. An increase in accounting profit does not automatically mean an equivalent increase in cash flow. U.S. GAAP financial statements may contain estimates, unusual items, and accounting judgments that require careful consideration. Company-defined adjusted or non-GAAP measures should be evaluated alongside reported GAAP figures and their reconciliations. Quarterly and annual performance figures should be compared using appropriate reporting periods, consistent units, and relevant context. The assumed twenty-five-percent tax rate and constant thirty-million-share count are simplified educational inputs, not universal company characteristics. None of the financial calculations, historical comparisons, or hypothetical scenarios constitutes a recommendation to buy, sell, or hold securities. Learners should verify official disclosures, review the financial statement notes and MD&A, and seek qualified professional advice before making actual financial decisions.
Lesson Checkpoint
Review what you learned and get feedback on your work.