



In this 13-minute beginner lesson, learners explore three essential dimensions of financial risk: volatility, drawdown, and liquidity. Through simulated portfolio examples, recovery mathematics, practical liquidity comparisons, and risk-management exercises, learners discover why a 25% drawdown requires a 33⅓% gain to recover, how leverage can magnify losses, and how position sizing, diversification, and disciplined monitoring help manage financial exposure without guaranteeing protection.
Introduction: Why the Path Matters as Much as the Result
Imagine two simulated portfolios beginning at $1,000 and finishing one year later at $1,100. Both have achieved the same ten-percent nominal return. However, their experiences may have been completely different. The first portfolio may have increased relatively steadily, while the second may have fallen to $500 before recovering. Although their ending values match, the second investor experienced much greater uncertainty, a deeper temporary loss, and potentially more emotional pressure.

This difference illustrates why returns alone cannot describe financial risk. Volatility concerns how strongly prices or returns fluctuate. Drawdown measures the decline from an earlier portfolio peak. Liquidity describes how easily an asset can be traded without unacceptable price impact or transaction costs. Together, these concepts help explain why two strategies with similar reported performance may behave very differently under unfavorable market conditions.
Key points
- Two paths can end at the same price but feel very different.
- Volatility, drawdown and liquidity are related but distinct.
- Simulated money only: all numbers here are illustrations.
In this lesson, you will learn to interpret volatility, calculate drawdown, understand recovery percentages, and recognize liquidity warning signs. You will also examine how leverage, position sizing, and diversification influence portfolio exposure. The central exercise is explaining why a simulated twenty-five-percent drawdown requires a gain of exactly thirty-three and one-third percent to recover. Every example uses hypothetical figures and simulated money.
Volatility: Measuring Movement Without Confusing It With Risk
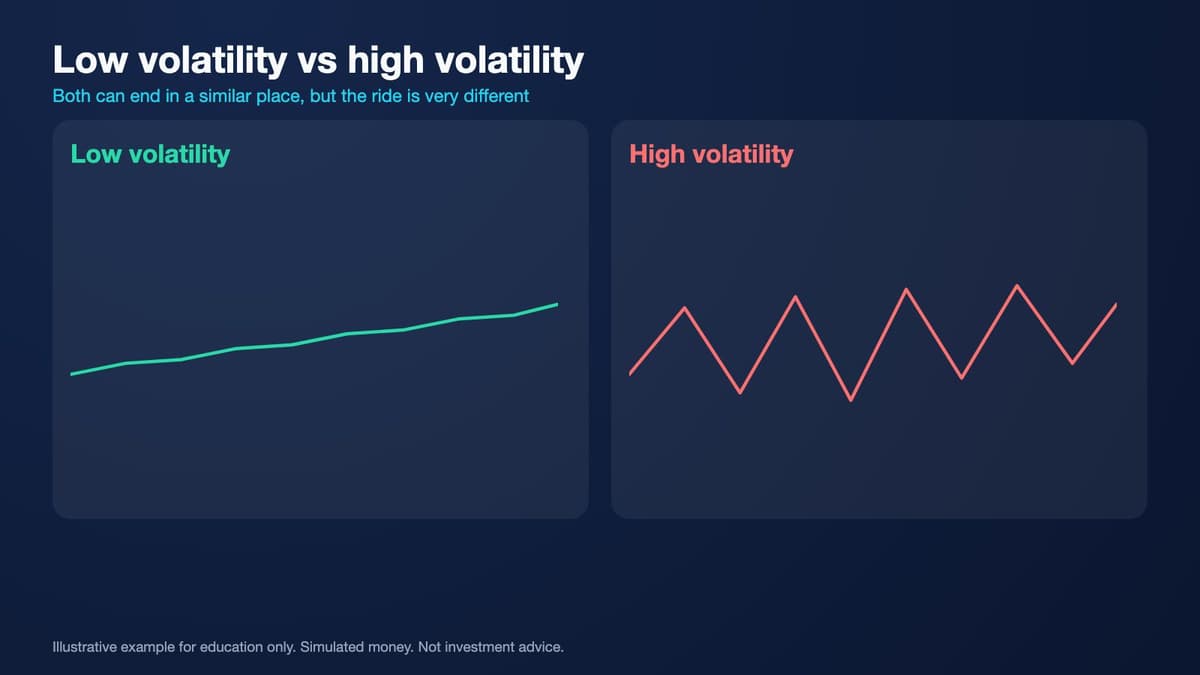
Volatility describes the degree to which market returns or prices fluctuate over time. An asset experiencing small, relatively consistent movements is generally less volatile than one experiencing frequent, substantial changes. Consider two simulated assets that both begin and end a month at $100. One trades mostly between $98 and $102, while the other repeatedly moves between $75 and $125. Their final prices match, but the second asset experienced much larger fluctuations.
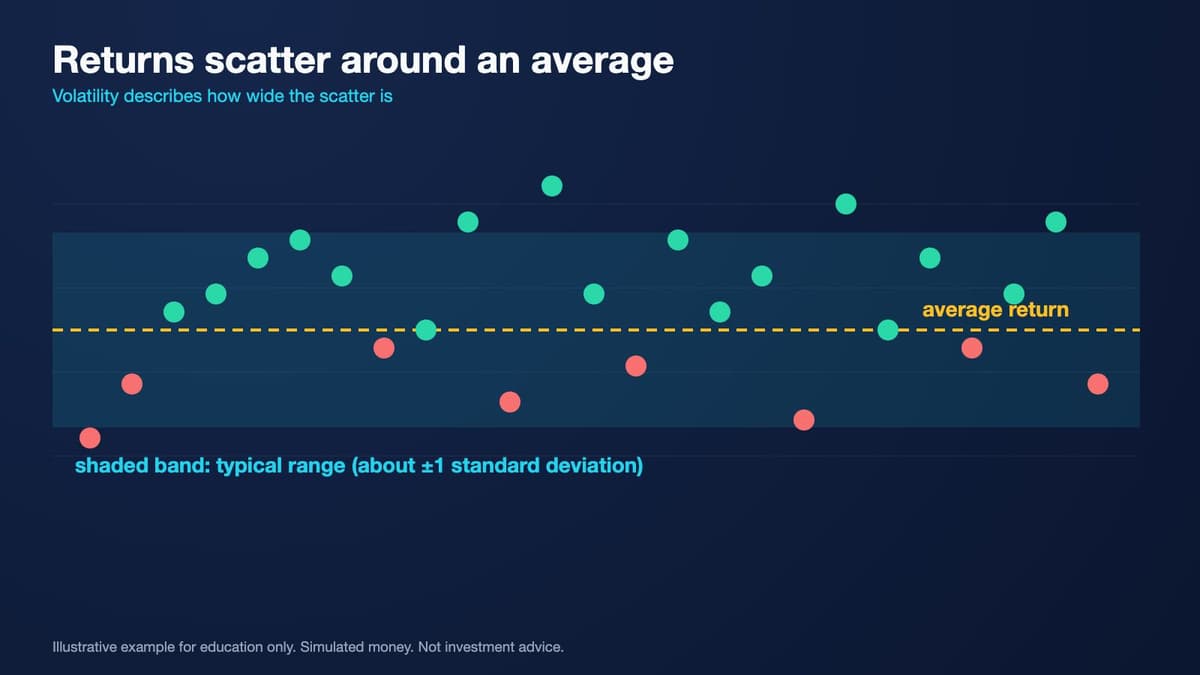
Standard deviation is a common statistical measure of return variability. In beginner-friendly language, it describes how widely observations tend to differ from their average. When daily returns remain close to their average, measured standard deviation is relatively low. When they vary substantially, measured standard deviation is higher. This measure depends on the observation period, sampling frequency, and calculation method. It summarizes historical variability but cannot reliably predict every future market movement.
Key points
- Volatility = how widely returns fluctuate over a period.
- Standard deviation is one common way to measure it.
- Volatility is not the same as risk: it describes variation, not consequences.
Volatility is related to risk, but the concepts are not identical. A temporary price fluctuation may not permanently damage a long-term objective, while an apparently stable asset can still experience default, fraud, or sudden illiquidity. The consequences also depend on when funds are needed and how positions are financed. High volatility can create opportunities and difficulties, but it does not guarantee returns. Risk analysis must consider unfavorable outcomes beyond price variation alone.

Drawdown: From the Previous Peak to the Trough
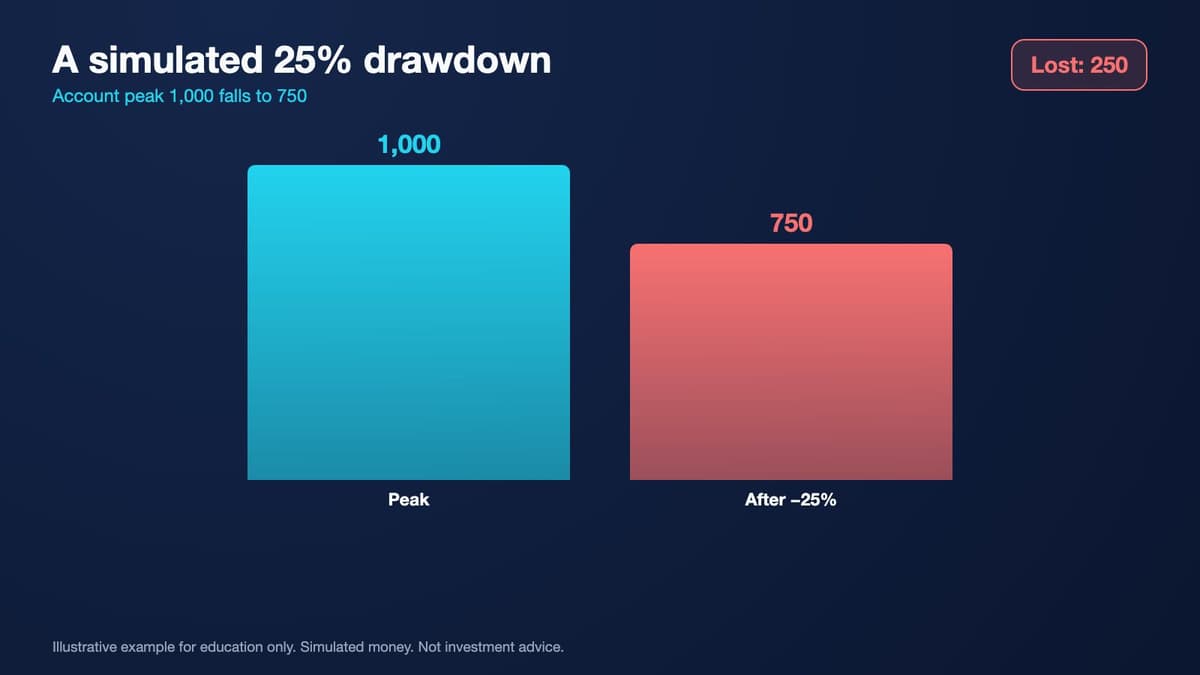
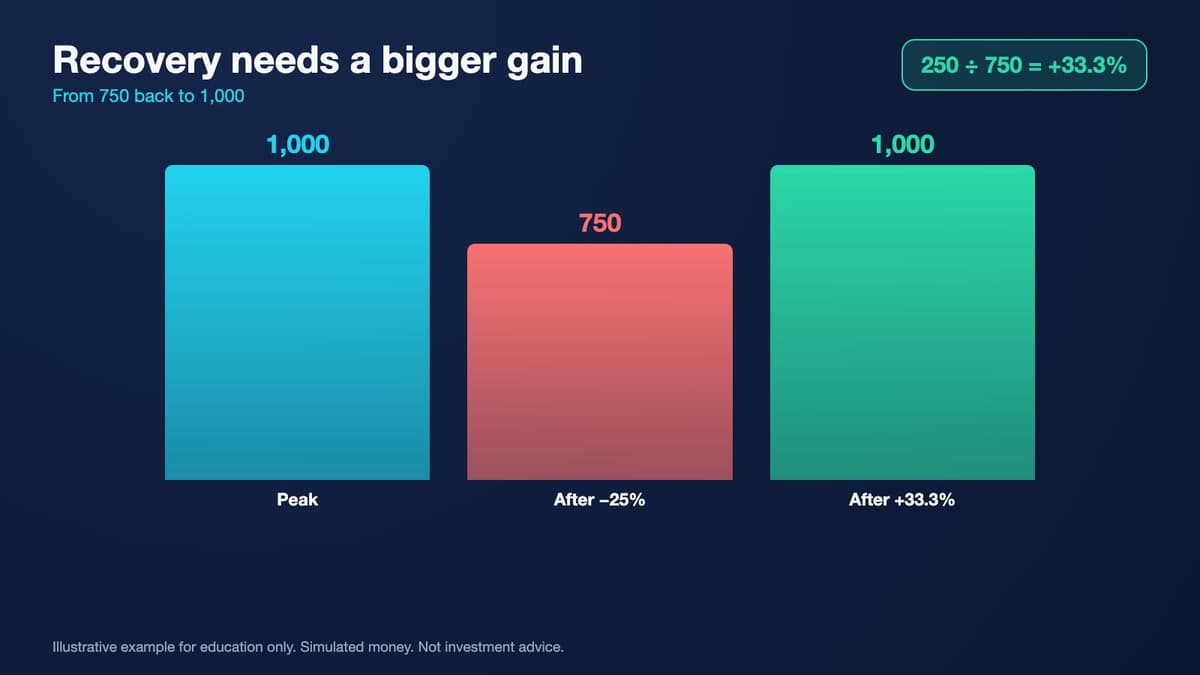
Drawdown measures how far a portfolio or asset has declined from a previous peak. Suppose a simulated portfolio rises from $800 to $1,000, then falls to $750. Its drawdown is measured from the $1,000 peak rather than the original $800 balance. The decline is $250, and dividing that amount by the peak gives a twenty-five-percent drawdown. Drawdown is commonly expressed as a percentage because this allows comparisons between portfolios of different sizes.
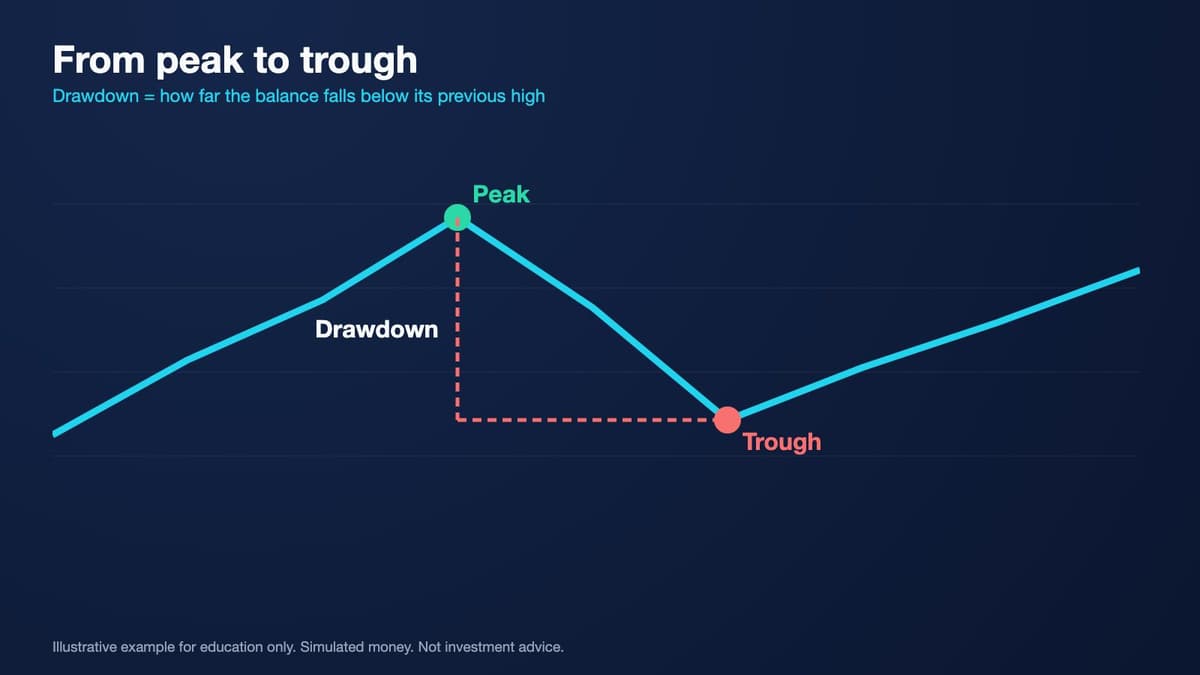
Maximum drawdown is the largest observed peak-to-trough decline over a specified measurement period. It is useful for evaluating the severity of historical losses, but it cannot establish the worst loss that could occur in the future. A portfolio can experience multiple drawdowns, and the largest one may occur only after several smaller declines. Measurement also requires a consistent definition of portfolio value, especially when contributions, withdrawals, or other external cash flows occur.
Key points
- Drawdown = (peak − trough) ÷ peak.
- Maximum drawdown is the largest peak-to-trough decline in a period.
- Measure from the previous peak, not from your starting amount.
Drawdown is particularly important because financial losses create an asymmetric recovery problem. A twenty-five-percent decline leaves only seventy-five percent of the previous peak. Recovering requires gaining the missing twenty-five percentage points relative to that smaller balance. Consequently, the required recovery is one-third, or thirty-three and one-third percent. This mathematical relationship becomes increasingly demanding as drawdowns deepen and helps explain why limiting uncontrolled losses is a central risk-management objective.
Recovery Mathematics and Time Under Water
Recovery percentages are calculated using the remaining balance after a loss. If a $1,000 simulated portfolio declines ten percent, it falls to $900. Returning to $1,000 requires a $100 gain, which represents exactly one-ninth of the remaining balance, or approximately 11.11 percent. After a fifty-percent decline, the account contains $500 and requires another $500 to recover. That is exactly a one-hundred-percent gain, demonstrating why equal negative and positive percentage changes do not cancel.
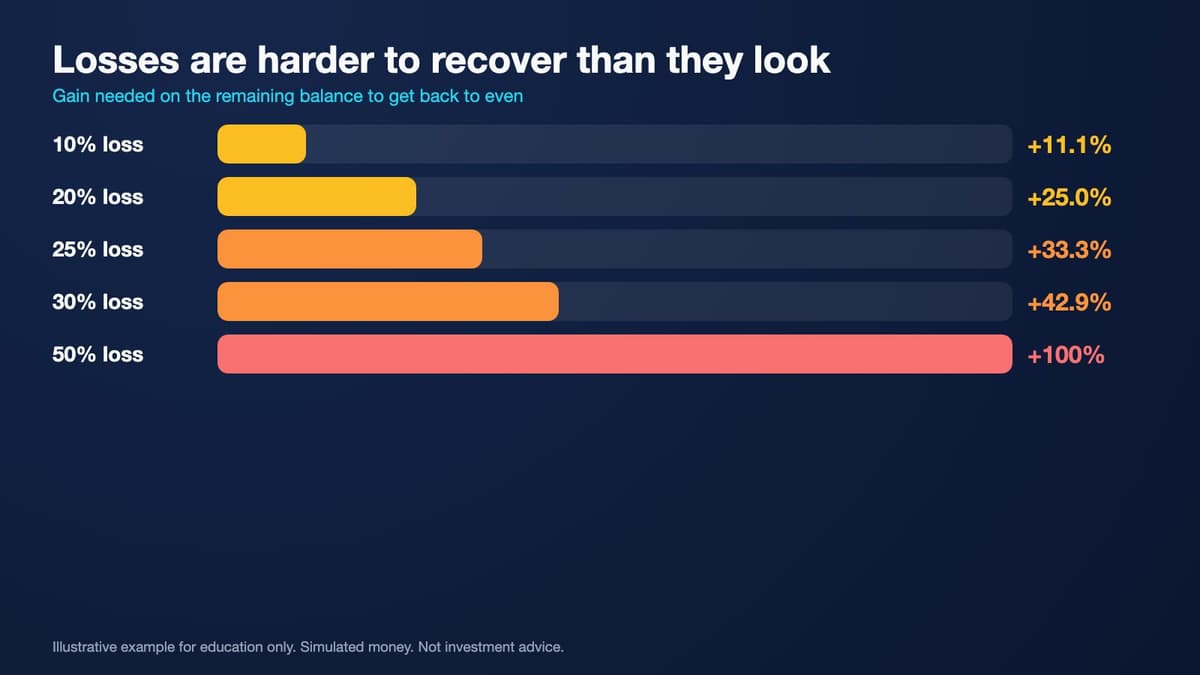
The general recovery formula is loss fraction divided by one minus the loss fraction. For a twenty-five-percent decline, the calculation is 0.25 divided by 0.75, which equals exactly one-third. For a seventy-five-percent decline, it is 0.75 divided by 0.25, producing a required three-hundred-percent gain. A complete loss is different: recovery as a percentage of a zero balance is undefined, and the original balance cannot be restored through percentage growth without adding capital.
Key points
- Recovery needed = loss ÷ remaining balance.
- Losing 25% needs a 33⅓% gain; losing 50% needs 100%.
- Time under water counts too: recovery is never guaranteed.
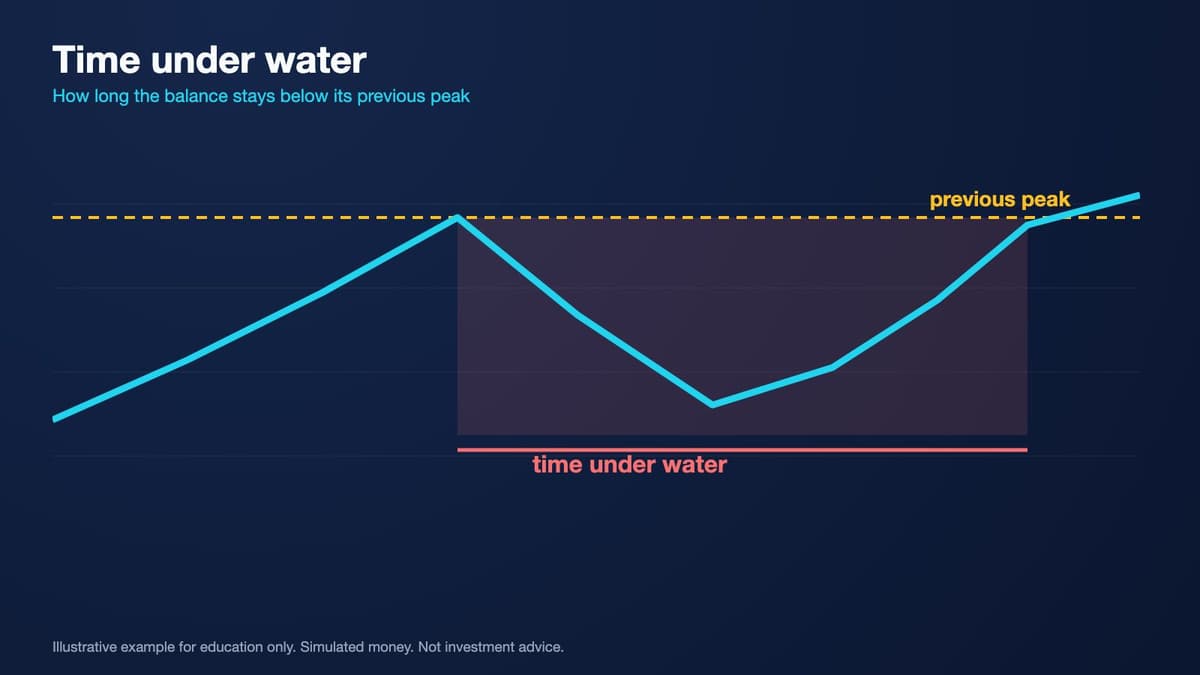
Drawdown also has a duration. Time under water describes how long a portfolio remains below a previous peak before reaching or exceeding it again. Two portfolios can experience the same maximum drawdown but different recovery periods. One might recover within several weeks, while another remains below its peak for years. This matters when capital may be needed for a planned expense. A portfolio's ability to recover eventually does not guarantee that recovery will occur before a financial deadline.

Liquidity: Can You Exit at a Reasonable Price?
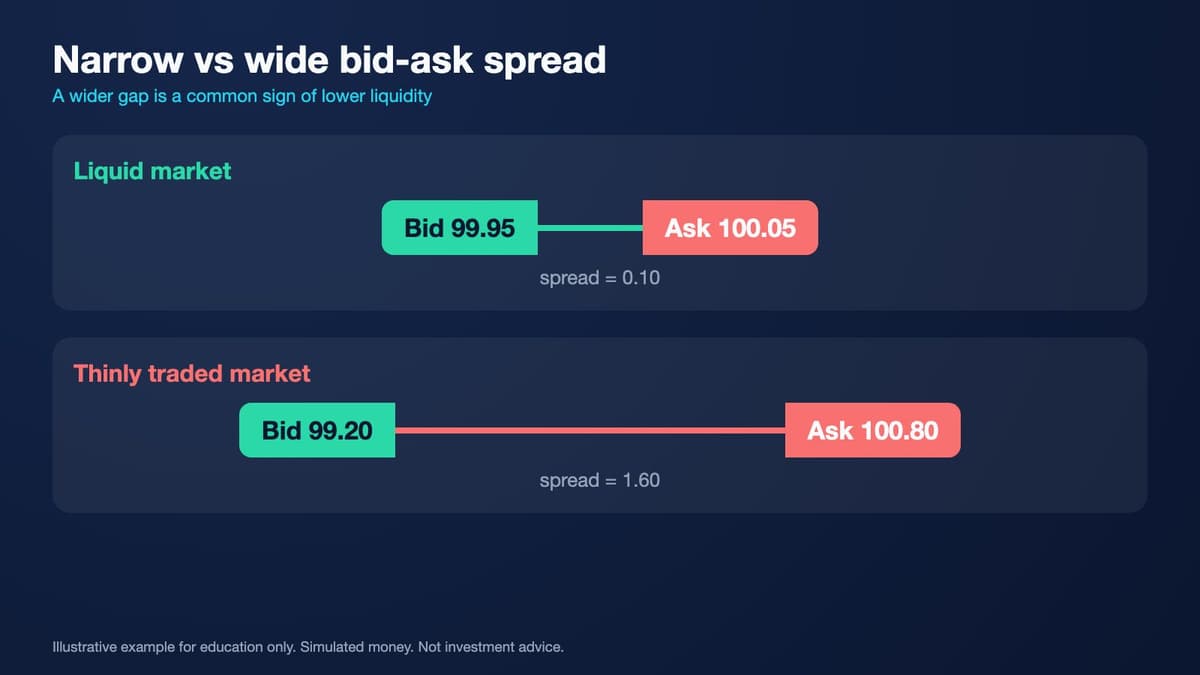
Liquidity describes the ability to buy or sell an asset relatively quickly, in a meaningful quantity, without creating an unacceptable change in price or excessive trading costs. Highly liquid markets generally contain many active buyers and sellers. Thinly traded markets may contain fewer participants and less available volume near current prices. A displayed market price does not guarantee that an entire position can be sold at that price, particularly when the position is large relative to available demand.

The bid-ask spread offers one practical liquidity signal. The bid represents a price buyers are willing to pay, while the ask represents a price sellers request. Suppose the best bid is $99.50 and the best ask is $100.00. Their difference is exactly $0.50 per unit. Buying at the ask and immediately selling at the bid would incur that difference before commissions and other costs, assuming both quotations remain available and sufficient quantity can execute.

Key points
- Liquidity = how easily you can trade meaningful size at an acceptable price.
- A narrow bid-ask spread helps, but depth and volume matter as well.
- Liquidity can vanish when many participants sell at once.
Liquidity risk becomes particularly important when many market participants attempt to exit at the same time. Spreads can widen, available order-book depth can disappear, and large orders can experience significant slippage. A market that appears liquid during normal conditions may behave differently during sudden news or market stress. Evaluating liquidity therefore requires more than observing daily trading volume. Beginners should also consider spread width, order size, depth, market conditions, and possible delays.


Leverage, Position Sizing, and Diversification Limits
Leverage increases market exposure relative to the equity or collateral supporting a position. This magnifies both favorable and unfavorable price changes. For example, an idealized simulated position with five times exposure could lose approximately fifty percent of its allocated equity following a ten-percent adverse market move, before fees and financing costs. Actual leveraged products involve margin requirements and liquidation mechanisms that may close positions before the theoretical loss reaches that level.

Position sizing helps control how much a single market movement can affect the broader portfolio. Suppose a $1,000 simulated account holds an unleveraged $200 position. If that position declines ten percent, the direct mark-to-market loss is $20, or two percent of the overall starting account. If the entire $1,000 had been exposed to the same movement, the loss would be $100. Smaller exposure can limit the immediate impact of a defined price change, although gaps and execution costs remain possible.

Key points
- Leverage multiplies gains and losses.
- Position size = max planned loss ÷ distance to the stop.
- Diversification helps but cannot prevent correlated losses.
Diversification distributes exposure among holdings rather than concentrating everything in one asset. It may reduce risks associated with individual companies or instruments, but it does not eliminate market-wide losses. During stressful conditions, assets that usually behave differently may decline together as correlations change. Leverage can magnify these shared losses. Effective risk analysis must therefore examine overall exposure, position concentration, liquidity, and the possibility that several supposedly independent holdings could experience simultaneous drawdowns.


Tracking Drawdown in a Demo Account and Keeping a Journal
A demo account provides a useful setting for learning how drawdown develops without exposing real capital. Begin by recording the simulated portfolio's equity, including unrealized gains and losses. Track each new equity peak and calculate the decline from that peak after subsequent changes. For example, if simulated equity reaches $2,000 and later falls to $1,600, the current drawdown is twenty percent. Continue monitoring whether the account reaches a new peak or remains below its previous high.
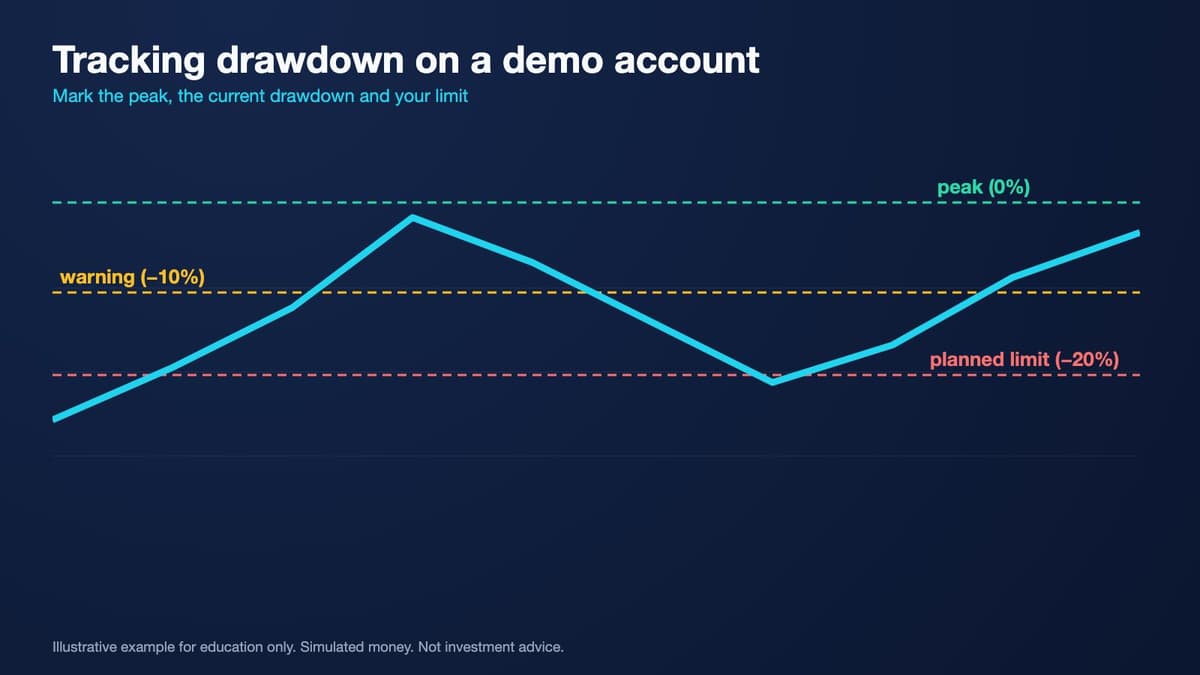
A risk journal should record the date, simulated account equity, previous peak, current drawdown, maximum observed drawdown, and duration below the peak. It should also describe possible causes, including adverse market movements, concentration, leverage, fees, or execution assumptions. When cash is deposited into or withdrawn from an account, separate these external cash flows from investment performance so they do not create misleading peak or drawdown measurements.

Key points
- Track peak, current value, drawdown and time under water.
- Write down the cause of every decline.
- Review five questions before each simulated trade.
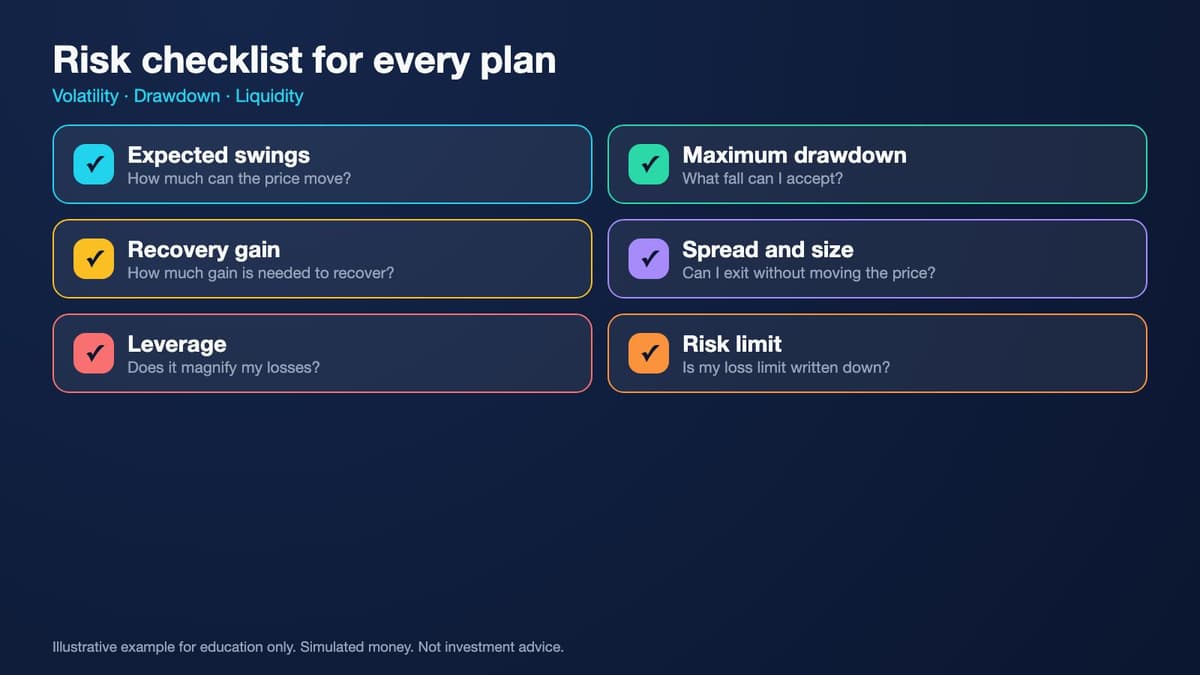
Before testing a position, apply a practical checklist. Estimate volatility, identify a plausible adverse price movement, review spread and liquidity conditions, calculate position exposure, and consider effects on the complete portfolio. Record the assumptions in advance rather than reconstructing them after seeing results. Demo accounts may provide unrealistic execution or insufficient emotional pressure, so favorable simulated performance should never be treated as evidence of guaranteed success in real markets.
Practice, Recap, and the Twenty-Five-Percent Drawdown Checkpoint
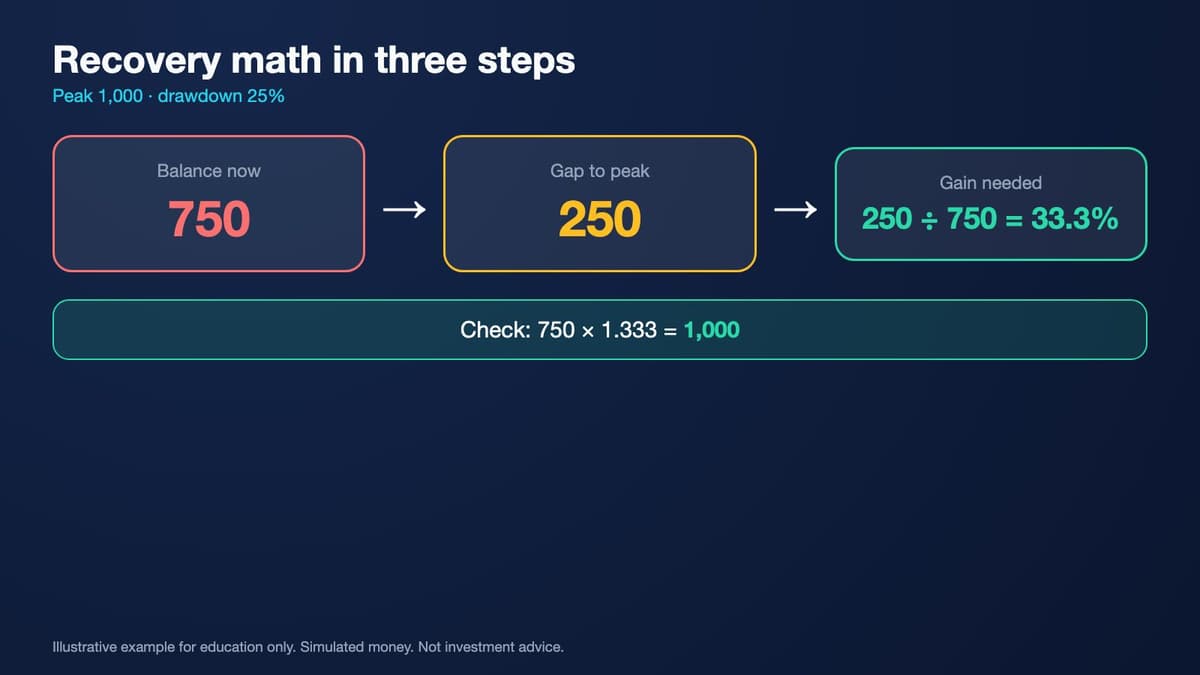
Your central checkpoint involves a simulated account that reaches $1,000 before declining to $750. First, calculate the loss: $1,000 minus $750 equals $250. Second, divide the loss by the original peak to obtain a twenty-five-percent drawdown. Third, calculate the percentage gain needed to recover by dividing the missing $250 by the remaining $750. The answer is exactly one-third, or thirty-three and one-third percent. This calculation should become familiar before studying more complex risk-management methods.

Practice Lab: Explain a Simulated 25% Drawdown and Its Recovery
Use simulated money only. Complete all five decisions. For each one, identify the relevant risk, calculate any required values, explain the time horizon, and describe the practical implication. Show your calculations before reviewing the answers. For drawdown calculations, use the previous peak as the reference. For recovery calculations, use the remaining balance as the reference. Treat all prices and outcomes as hypothetical, ignore taxes unless stated, and never assume that recovery is guaranteed.
- Decision 1: A simulated investment account begins at $1,000, reaches a peak of $1,200, and subsequently declines to $900. No deposits or withdrawals occur. — What is the drawdown from the peak, and what percentage gain is needed to recover to $1,200?
- Decision 2: A learner compares two simulated assets over the same month. Asset A fluctuates mildly around its average return, while Asset B repeatedly experiences large positive and negative daily returns. Both finish the month with the same total return. — Which asset shows higher measured volatility, and does that automatically mean it produces a lower final return?
- Decision 3: A simulated trader wants to sell a large position in a thinly traded asset. The displayed bid-ask spread is wide, and only a small quantity is available at the best bid. — What liquidity problems could occur if the trader attempts to sell the entire position immediately?
- Decision 4: A $1,000 simulated account allocates $200 to an unleveraged asset. The asset declines by 10%, while the remaining $800 stays unchanged. Ignore commissions, financing, and other costs. — How much does the position lose, and what is the resulting percentage decline in the overall account?
- Decision 5: A hypothetical simulated portfolio contains several different assets. During a sudden market shock, multiple holdings decline together. The portfolio experiences a 25% drawdown and remains below its former peak for six months. — What does this demonstrate about diversification and time under water, and what recovery gain is required?
Answer key
Next, consider the risks surrounding that drawdown. Could the portfolio sell its holdings quickly? Were bid-ask spreads narrow enough for the intended order size? Did leverage amplify the decline? Did several correlated positions lose value together? How long might the portfolio remain below its peak? These questions emphasize that a percentage loss is only one part of risk. Liquidity conditions, financing, execution, concentration, and recovery time can materially influence the consequences.
The key distinctions are straightforward. Volatility describes the variability of returns or prices. Drawdown describes losses relative to a previous peak. Liquidity concerns the ability to execute transactions at acceptable prices and costs. Position sizing and diversification can reduce certain exposures, but neither guarantees protection from losses. Complete the practice decisions and checkpoint exercises using simulated money. The purpose is to understand uncertainty and develop disciplined analytical habits, not to predict or guarantee profitable outcomes.

Worked example at a glance
Key terms
- Volatility: how strongly prices or returns fluctuate over time.
- Standard deviation: a measure of how widely returns spread around their average.
- Drawdown: the percentage decline from a previous peak to a later lower value.
- Maximum drawdown: the largest peak-to-trough decline in a period.
- Time under water: how long a balance stays below its previous peak.
- Liquidity: how quickly you can buy or sell meaningful size without moving the price much.
- Bid-ask spread: the gap between the best buying and selling prices.
- Slippage: the gap between the expected price and the price actually received.
- Leverage: borrowed exposure that multiplies gains and losses.
- Position size: the amount allocated to a single trade.
- Diversification: spreading exposure across different assets to reduce dependence on one.
Multi Asset Trading Lab is an educational course and does not provide personalized investment, trading, financial, legal, or tax advice. All portfolios, market prices, returns, drawdowns, leverage illustrations, liquidity scenarios, and account balances in this lesson are hypothetical and use simulated money only. No real-money trading or investing is required or encouraged. Historical volatility, maximum drawdown, and recovery duration cannot establish future worst-case outcomes or guarantee recovery. A portfolio can experience partial or total loss, and its value may remain below a previous peak indefinitely. Financial assets may become difficult or impossible to sell quickly at an acceptable price, particularly during periods of market stress, limited liquidity, high volatility, or crowded selling. Bid-ask spreads, order-book depth, trading volume, and displayed prices may change without warning. Stop-loss orders, position sizing, and diversification can support risk management but cannot guarantee protection against price gaps, slippage, correlated losses, or sudden market events. Leverage magnifies gains and losses, may lead to forced liquidation, and can potentially create losses beyond initial collateral depending on the financial product and account arrangements. Simulated execution conditions and emotional responses may differ significantly from live markets. All recovery calculations are mathematical illustrations, not promises that financial losses can or will be recovered. Learners should focus on understanding risk, maintaining accurate records, and developing responsible decision-making habits before considering any actual financial exposure.
Lesson Checkpoint
Review what you learned and get feedback on your work.