



In this twelve-minute beginner lesson, learners discover how investment returns are calculated, why fees and inflation reduce financial progress, and how to compare nominal and real outcomes fairly. Through simple worked examples, a 20-year fee comparison, the Rule of 72, and simulated-money exercises, learners practice evaluating returns after costs, inflation, and risk without treating historical performance as a guarantee.
Introduction: A Higher Balance Is Not the Whole Story
Imagine opening a simulated investment account and discovering that its balance has increased by ten percent. At first, that sounds encouraging. However, the number alone does not explain how much financial progress has occurred. The account may have incurred trading fees, fund expenses, or taxes. Meanwhile, the prices of groceries, housing, transportation, and other goods may have increased. A larger account balance does not necessarily mean that purchasing power has increased by the same percentage.
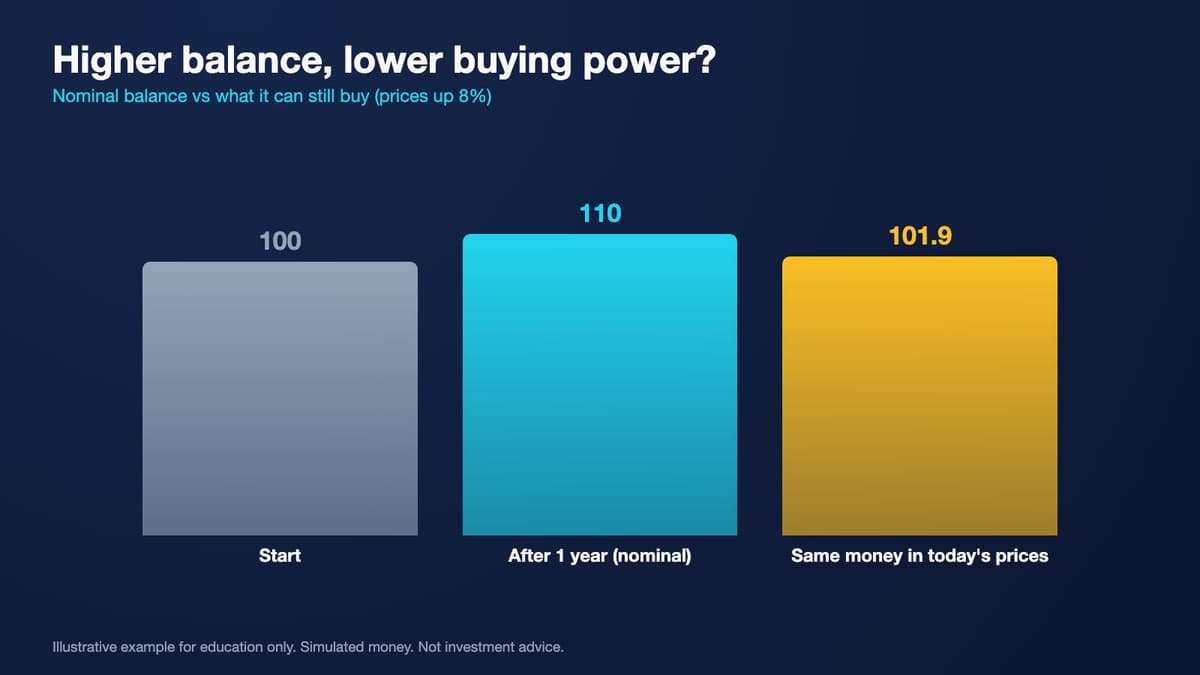
This lesson introduces three connected ideas: return, costs, and inflation. Return measures financial performance. Costs determine how much of that performance is retained. Inflation helps explain how the value of money changes relative to goods and services. Understanding all three allows learners to interpret results more carefully. We will use straightforward numerical examples rather than market predictions, and every exercise will involve simulated capital rather than actual investment decisions.

Key points
- Return = (ending value − starting value) ÷ starting value.
- A higher balance does not always mean you are better off.
- Fees and inflation both reduce real progress.
By the end of this lesson, you should be able to calculate a simple percentage return, distinguish gross from net performance, explain how compounding works, and estimate inflation-adjusted results. You will also learn why recurring fees matter over long periods, how the Rule of 72 provides a rough estimate of doubling time, and why unusually attractive returns require careful consideration of risk. Our goal is financial literacy, not guaranteed profitability.

Understanding Returns: Percentages, Simple Growth, and Compounding
Return describes the change in the value of an investment over a specified period, including relevant income such as dividends or interest. For a simple investment without deposits or withdrawals during the measurement period, the holding-period return can be calculated by dividing the total gain or loss by the starting value. Suppose a simulated position begins at $100 and ends at $110, with no other income or costs. The gain is $10, representing a ten-percent return.

Returns can also be negative. If the same $100 position declines to $90, the loss is $10, or negative ten percent. Expressing performance as a percentage helps compare results from different starting balances. However, comparisons require consistent time periods and measurement methods. A ten-percent gain over one month is not equivalent to a ten-percent gain over five years. Adding or withdrawing capital also complicates performance calculations and may require specialized methods.

Key points
- Always state the time period of a return.
- A loss gives a negative return: 100 falling to 90 is −10%.
- Simple growth uses the original amount; compounding also earns on gains.
Simple growth and compound growth describe different mathematical processes. Under a simplified ten-percent annual growth assumption, $100 produces $10 each year if growth is calculated only on the original principal, giving $120 after two years. With annual compounding and reinvestment, the balance becomes $110 after year one and $121 after year two. Actual markets do not deliver fixed returns, so compounding examples illustrate mathematical relationships rather than predictable future outcomes.
Gross Return, Net Return, Fees, and Transaction Costs
Gross return generally refers to performance before specified costs, while net return reflects performance after the costs included in the calculation. Imagine a simulated investment of $100 that produces an $8 gain. Its gross return is eight percent. If the investor also pays $2 in fees that have not already been deducted, the retained gain becomes $6, producing a six-percent net return before any taxes. Always examine how a reported performance figure defines gross and net.

Investment products may charge several types of expenses. A fund's expense ratio represents annual operating expenses relative to its assets. Trading can involve commissions, bid-ask spreads, funding charges, and other transaction costs. The bid-ask spread is the difference between the price buyers are offering and the price sellers are requesting. Frequent transactions may make these costs particularly important. Some published fund returns already include ongoing expense ratios, so subtracting them again would be incorrect.

Key points
- Gross return is before costs; net return is after costs.
- Expense ratios, commissions and spreads all reduce results.
- Taxes depend on circumstances.
Taxes can further influence the amount retained after investment activity. Tax treatment varies according to jurisdiction, financial instrument, account type, holding period, and individual circumstances. A beginner should understand that taxes may matter without assuming that a single rate applies universally. For simulated exercises, record gross returns, applicable fees, and hypothetical taxes separately. This creates a clear picture of the calculation and avoids confusing an advertised return with the amount potentially available for spending.

Inflation, Purchasing Power, and Real Return
Inflation refers to an increase in the general price level over time. As prices rise, a fixed amount of money usually buys fewer goods and services. Suppose a typical grocery basket costs $100 today. Under an assumed five-percent increase in its price, that same basket would cost $105 next year. If your savings balance remained unchanged, its purchasing power relative to that basket would decline. Actual inflation rates vary across countries, periods, and spending categories.

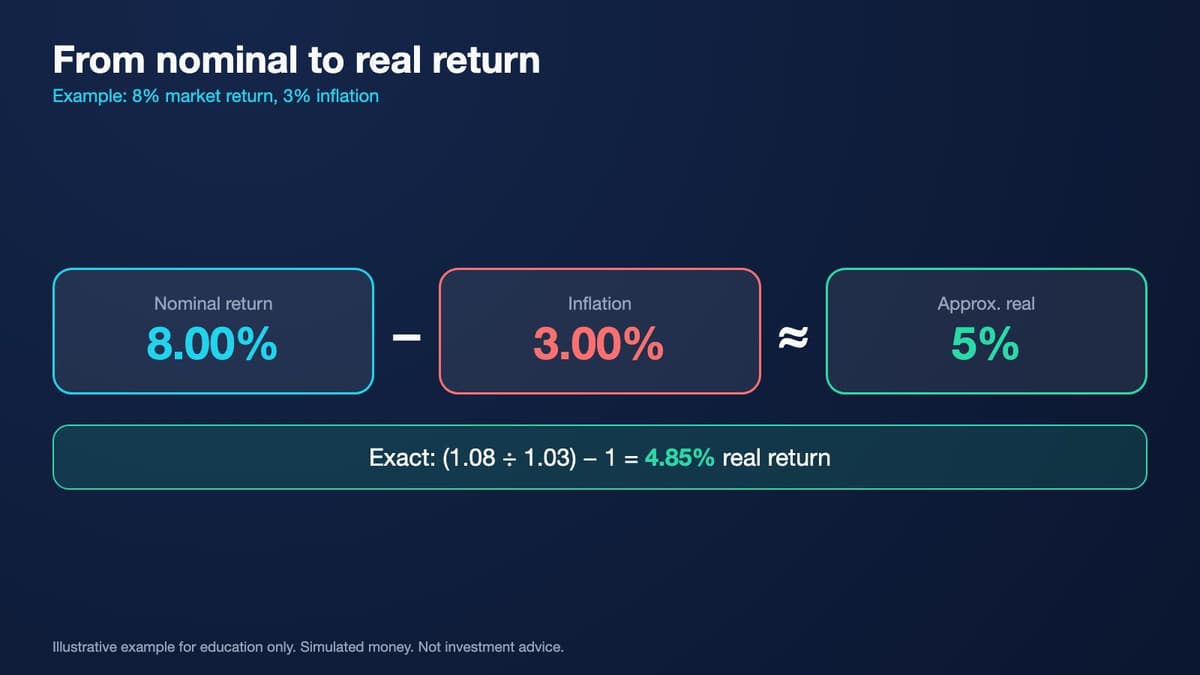
Nominal return measures financial growth without adjusting for inflation. Real return accounts for changes in purchasing power. Imagine a simulated investment earning an eight-percent nominal return after fees while inflation is three percent. A quick approximation subtracts inflation from the nominal return, producing approximately five percent. The more accurate formula divides 1.08 by 1.03 and subtracts one, giving approximately 4.85 percent. This result assumes consistent periods and excludes additional taxes.


Key points
- Nominal return ignores inflation; real return adjusts for it.
- Approximate real return ≈ nominal − inflation.
- Exact: (1 + nominal) ÷ (1 + inflation) − 1.
A positive nominal return does not guarantee a positive real return. For example, a two-percent nominal increase combined with four-percent inflation produces an exact real return of approximately negative 1.92 percent. The account balance increased, but purchasing power declined. Real returns therefore help learners connect financial performance with actual future spending capacity. However, real returns are also estimates when the inflation measure does not perfectly match an individual's personal spending patterns.

Long-Term Fee Drag and the Rule of 72
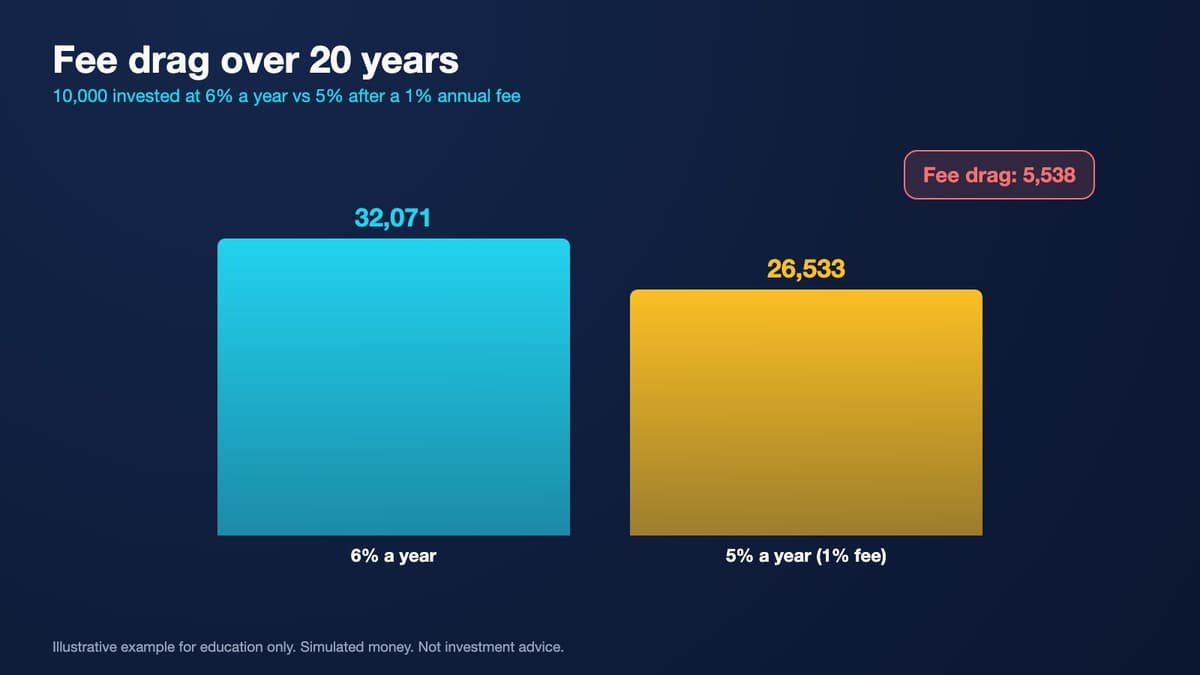
Recurring fees can have a substantial effect over long periods because they reduce the capital available for future compounding. Consider two hypothetical funds, each beginning with $10,000 and earning a constant seven-percent annual gross return for twenty years. Assume one effectively reduces annual growth by 0.2 percentage points in fees, leaving 6.8 percent, while the other reduces it by 1.5 percentage points, leaving 5.5 percent. These are simplified illustrative assumptions.

After twenty years, the lower-fee example grows to approximately $37,300, while the higher-fee example reaches about $29,200. The difference is approximately $8,100, despite identical initial balances and hypothetical gross performance. This comparison demonstrates how recurring cost differences compound over time. Real funds may deduct expenses continuously, returns vary from year to year, and taxes or cash contributions can change outcomes. Lower fees alone do not guarantee a better financial product.

Key points
- A small yearly fee compounds into a large gap over decades.
- Rule of 72: years to double ≈ 72 ÷ annual rate.
- These are illustrations, not predictions.
The Rule of 72 offers a convenient mental estimate for compound growth. Divide 72 by an assumed annual percentage growth rate to estimate the number of years required for an amount to double. At eight percent, the estimate is nine years. At six percent, it is twelve years. The shortcut works best as a rough approximation near ordinary positive growth rates and assumes steady compounding. It does not account automatically for variable returns, additional costs, taxes, or inflation.
Comparing Two Financial Options Fairly
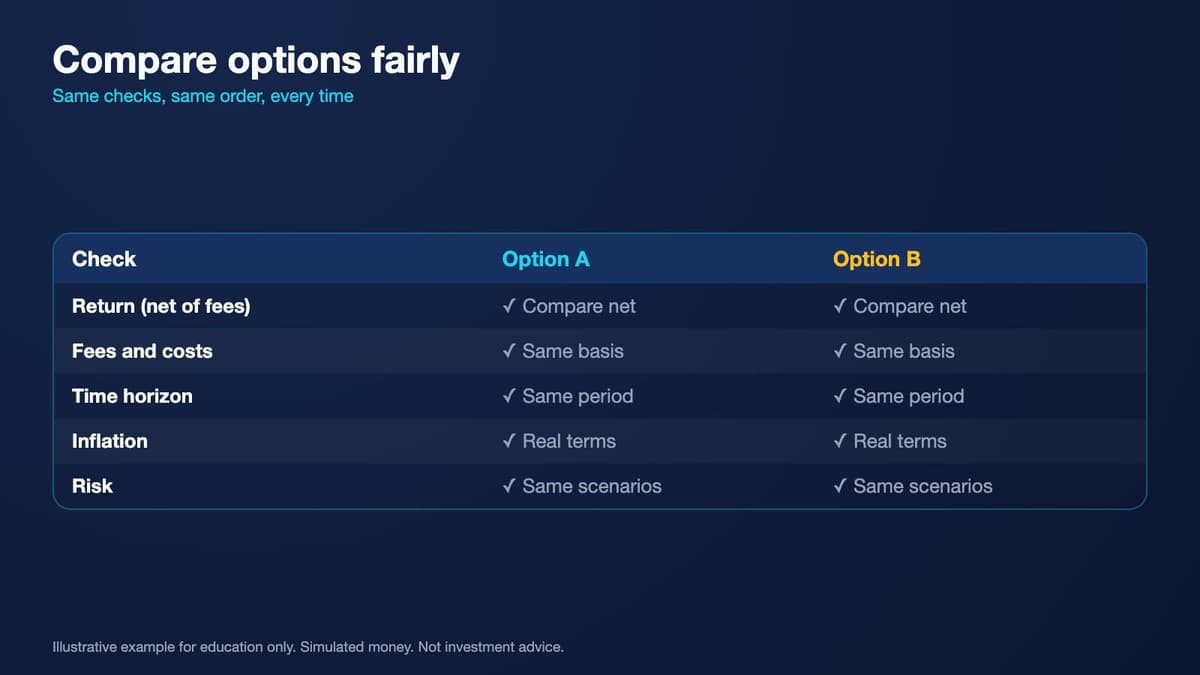
A fair comparison requires more than selecting the option with the highest advertised return. Begin with the same initial simulated balance, comparable holding periods, and consistent assumptions about contributions, withdrawals, and reinvestment. Next, identify which fees are already reflected in the reported performance. Consider trading commissions, spreads, expense ratios, and any additional charges. Finally, evaluate inflation and the possible effect of taxes. A comparison becomes misleading when one option includes costs and another ignores them.

Risk is equally important. A hypothetical strategy promising a higher expected return may involve greater volatility, concentration, illiquidity, or leverage exposure. Taking more risk can increase the range of possible outcomes, including severe losses, but does not guarantee a higher realized return. An option with a lower projected balance might still better match a shorter financial horizon or a need for liquidity. Financial decisions should reflect constraints, not only attractive arithmetic.

Key points
- Compare options over the same period, with the same costs and inflation view.
- Question very high promised returns.
- Write your assumptions down.
Imagine two simulated funds with different fees and different expected outcomes. Before comparing them, verify that their assets, risk profiles, and performance assumptions are reasonably comparable. If they are not, the numerical comparison cannot establish which is better. Be particularly cautious of claims promising exceptionally high, consistent returns with little or no risk. Responsible analysis examines uncertainty, downside scenarios, and the quality of evidence supporting each assumption.
Demo-Account Practice and the Return Evaluation Checklist
A demo account provides a controlled environment for practicing calculations without risking real capital. Start by recording the simulated account value at the beginning and end of an exercise. Distinguish investment gains from money added to the account, then calculate the appropriate percentage return. Record commissions, spreads, and other simulated costs. If the platform reports a return automatically, determine whether that figure already includes fees. Do not assume that a displayed percentage represents after-cost performance.

Next, estimate inflation-adjusted performance using an assumed inflation rate for the same time period. Record both the approximate and exact real return, especially when comparing scenarios. For consistency, keep a journal that includes starting capital, period length, gross performance, fee treatment, inflation assumption, and any excluded taxes. Note that simulated orders may execute differently from real orders, and practice results cannot establish future profitability.

Key points
- Practise with simulated money, including fees.
- Use a journal and a checklist.
- Calculate, then explain your reasoning.
Before comparing two outcomes, apply a five-part checklist. Identify the measurement period, verify the return calculation, account for fees without double-counting, adjust for inflation, and consider risk. Ask whether the assumptions are consistent and whether the results are historical observations, forecasts, or purely hypothetical examples. This framework can help beginners avoid common interpretation errors. The objective is to develop accurate financial reasoning rather than maximize simulated returns at any cost.

Five-Decision Exercise, Recap, and Responsible Next Steps
Practice applying the lesson with five situations. First, calculate the percentage return when a simulated $100 investment grows to $110. Second, calculate the net return when a $100 investment earns $10 before paying $2 in additional fees. Third, estimate the real return when nominal growth is six percent and inflation is four percent. Each exercise reinforces the distinction between account growth, retained gains, and purchasing power. Record your assumptions before checking the answers.

Practice Lab: Five Return and Cost Decisions
Use simulated money only. For each decision, calculate or interpret the relevant return, identify whether costs and inflation matter, and explain your conclusion. Assume no deposits, withdrawals, or additional income unless explicitly stated. Use the same measurement period for percentages being compared. Record your reasoning before reviewing the answer. All rates and outcomes are hypothetical and exclude taxes unless specified.
- Decision 1: A simulated investment begins at $100 and finishes one year later at $110. There are no dividends, fees, taxes, or additional deposits. — What is the holding-period return, and does the ending balance tell you anything about inflation-adjusted performance?
- Decision 2: A simulated trading account begins with $500 and earns $50 in gross gains during one month. Commissions and other transaction expenses total $10 and have not already been deducted. — What are the gross and net returns for the month?
- Decision 3: A simulated investment earns a 6% nominal annual return after fees, while the assumed inflation rate for the same year is 4%. Ignore taxes. — What is the approximate real return, and what is the more accurate inflation-adjusted figure?
- Decision 4: Two hypothetical investment funds each start with $10,000 and earn a fixed 7% annual gross return for twenty years. Fund A has a 0.2% annual expense assumption, while Fund B has a 1.5% assumption. Model the fees as reducing annual growth rates to 6.8% and 5.5%. — Which fund has the larger simulated ending balance, and approximately how large is the difference?
- Decision 5: An online advertisement claims that a financial strategy can earn 20% every year with almost no risk. It does not explain the trading method, fees, leverage, or evidence supporting its performance. — Should a beginner treat this as a reliable expected return?
Answer key
Fourth, compare two hypothetical funds that begin with identical balances and gross returns but charge different recurring annual fees. Explain why the lower-fee fund may accumulate more over twenty years under otherwise identical assumptions. Fifth, evaluate an advertisement promising twenty-percent annual returns with almost no risk. The appropriate response is not to accept the claim immediately, but to investigate its evidence, costs, uncertainty, leverage exposure, and potential losses.
The central lesson is simple: returns describe changes in value, fees reduce what remains, and inflation affects what money can buy. Compounding can amplify growth over time, but losses and expenses also matter. The Rule of 72 provides a shortcut, not a prediction. For your final checkpoint, construct two imaginary investment options, calculate net and real returns, and identify at least one risk for each. Use simulated money only; this course provides education, not investment or tax advice.

Worked example at a glance
Key terms
- Return: the change in value divided by the starting value.
- Gross return: return before costs.
- Net return: return after fees and costs.
- Expense ratio: a fund’s yearly running cost as a share of its assets.
- Bid-ask spread: the gap between the price buyers offer and sellers want.
- Inflation: the general rise in prices over time.
- Purchasing power: what a given amount of money can buy.
- Nominal return: return not adjusted for inflation.
- Real return: return after adjusting for inflation.
- Rule of 72: a rough estimate of doubling time: 72 ÷ annual rate.
Multi Asset Trading Lab is an educational course, not personalized investment, financial, legal, or tax advice. Every example, account balance, investment return, fee assumption, inflation rate, and calculation in this lesson is hypothetical and uses simulated money only. No real-money trading or investing is required or encouraged as part of the exercises. Historical returns, mathematical growth illustrations, demo-account results, and projected scenarios do not guarantee future performance. Actual financial outcomes depend on market conditions, volatility, liquidity, transaction costs, taxes, inflation, execution quality, and the possibility of partial or total capital loss. Compounding examples and the Rule of 72 are educational approximations, not forecasts. Higher potential returns generally involve additional uncertainty, and taking more risk does not guarantee higher realized gains. Leveraged products can magnify losses and may expose participants to liquidation or, depending on the product and account arrangement, losses beyond an initial deposit. Tax rules vary by jurisdiction and personal circumstances. Learners should use appropriate professional advice before making any actual financial decisions.
Lesson Checkpoint
Review what you learned and get feedback on your work.