



In this thirteen-minute beginner lesson, learners build and audit a trading journal using the entirely fictional Sample Micro Oil futures contract from Lesson 26. The objective is to document simulated spread, slippage, partial fills, commissions, margin changes, gap risk, and rule-following rather than predict market prices. The learner begins with a dated specification from April 1, 2026, an updated margin notice from April 15, and a simulated trade on April 20. A $10,000 paper account permits $100 of planned risk. Two micro contracts are initially planned at $70.02 with a $69.62 stop and $70.82 target, producing $83 planned risk and $157 planned net target profit. Actual partial entry fills at $70.04 and $70.06 produce a $70.05 average, creating $6 entry slippage and increasing planned stop risk to $89. An actual exit at $70.80 creates $4 additional execution shortfall, reducing realized simulated net profit to $147. Learners then stress updated margin requirements, examine a hypothetical stop gap that creates a $153 net loss, and summarize five simulated trades with $66 combined net profit, $18 slippage costs and $15 commissions. The lesson finishes with a reproducible one-page trade journal, a rule-following review, and an explanation of why five results cannot establish a reliable strategy. Every product, contract, quotation and trading outcome is fictional; all money is simulated, and no investment advice or price prediction is provided.
Why a Trading Journal Records Decisions Before Outcomes
A trading journal is a chronological record of what a learner intended to do, what actually happened, and whether the process followed a written policy. It is not simply a table of profits and losses. A useful journal preserves the information available before an order, including contract specifications, entry and exit rules, risk limits, displayed quotations, and the reasons for choosing or rejecting a simulated setup. After execution, it adds actual fills, costs, revised risk and review notes. Keeping those stages separate helps reveal execution mistakes and protects against hindsight bias. A profitable outcome does not prove that a decision was well controlled, and a losing outcome does not automatically establish that the process was incorrect.

Continue with the entirely fictional Sample Micro Oil futures contract introduced in Lesson 26. The specification dated April 1, 2026 defines 100 barrels per contract, a $0.01 minimum price tick, a $1 tick value, and commission of $0.75 per contract per side. Its original margin amounts were $600 initial and $540 maintenance per contract. A later fictional notice dated April 15 changes those amounts to $700 initial and $630 maintenance. The simulated trading date is Monday, April 20, 2026. The last trading day is Tuesday, May 19, leaving 29 calendar days. Record both document dates, the source and the effective margin notice before analyzing the transaction.

Key points
- A journal records the plan, the quote and every fill before the outcome is known; a win can hide poor execution and a loss can follow a good plan.
- Record the spec date (2026-04-01), the margin notice date (2026-04-15), equity $10,000 and 29 days to the May 19 last trading day.
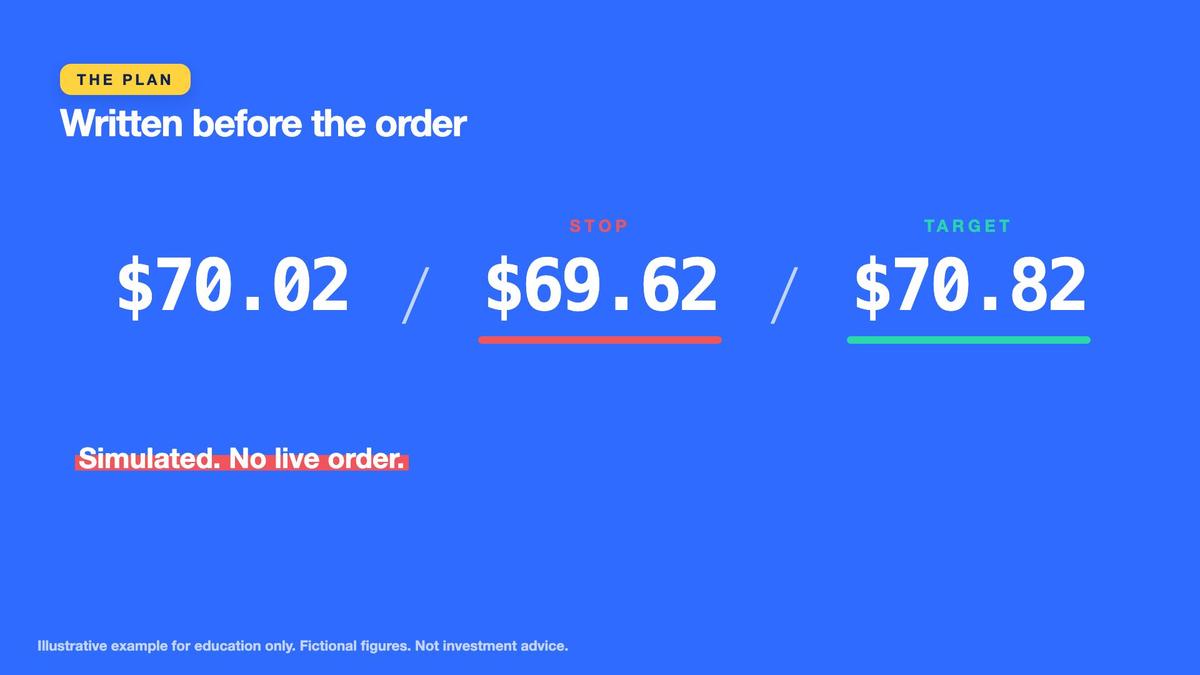
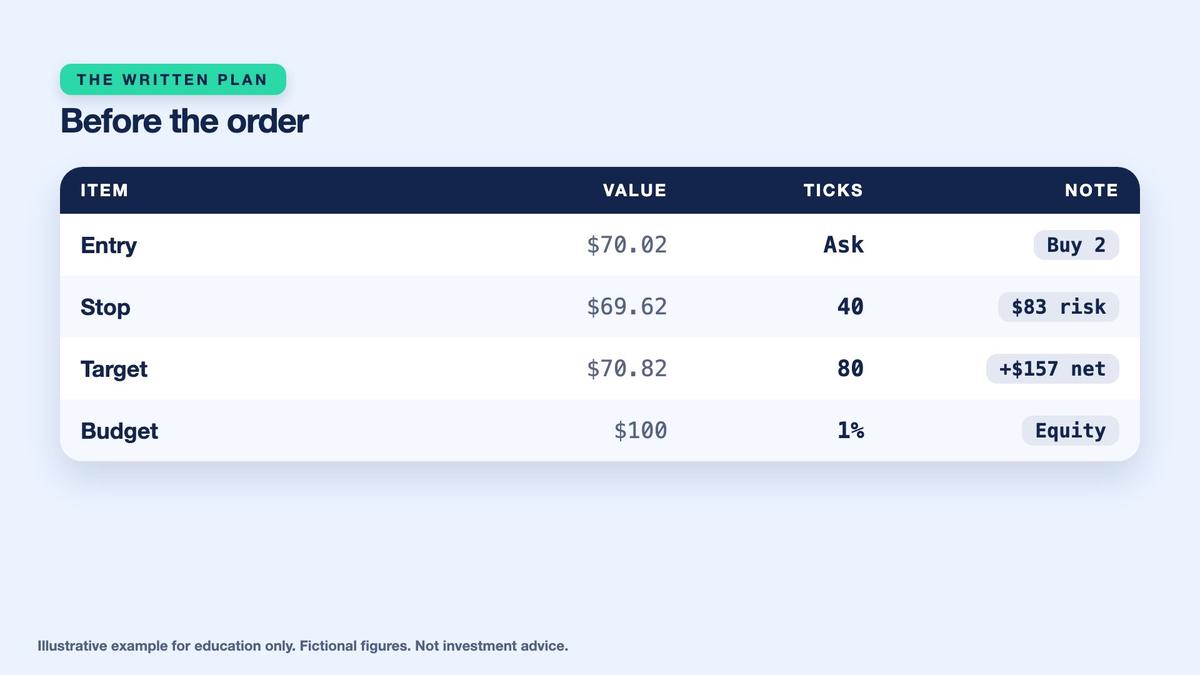
- The written plan: buy 2 at the $70.02 ask, stop $69.62 (40 ticks), target $70.82 (80 ticks), planned risk $83 (0.83%), planned net +$157.
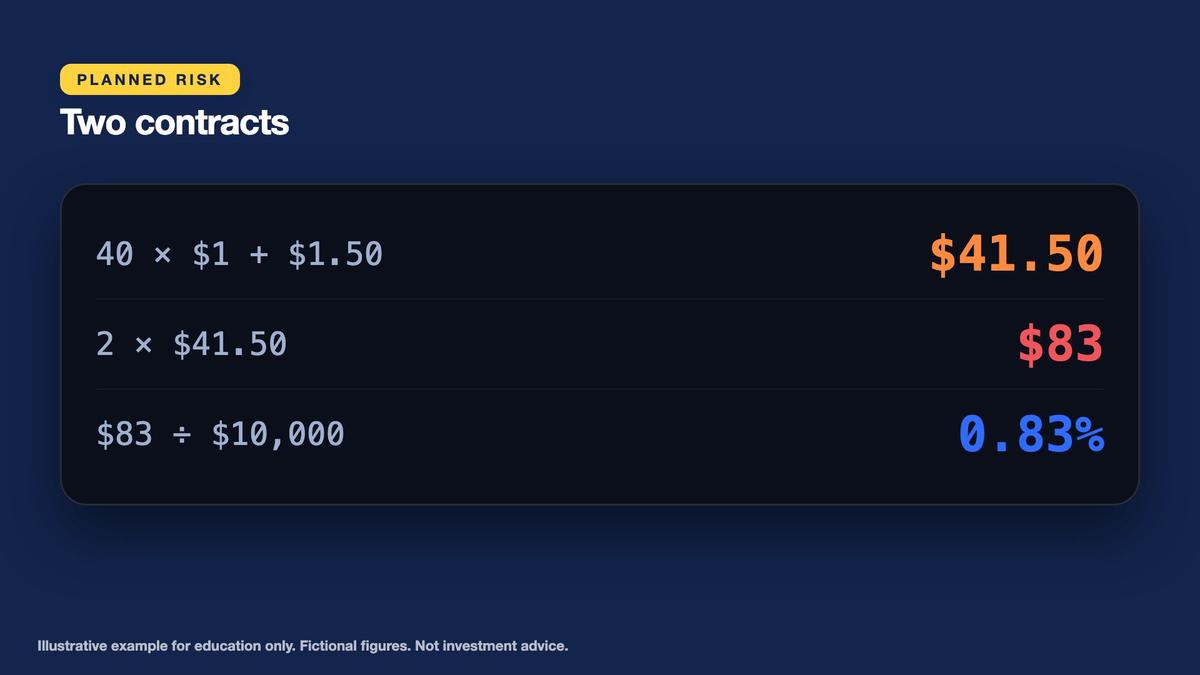
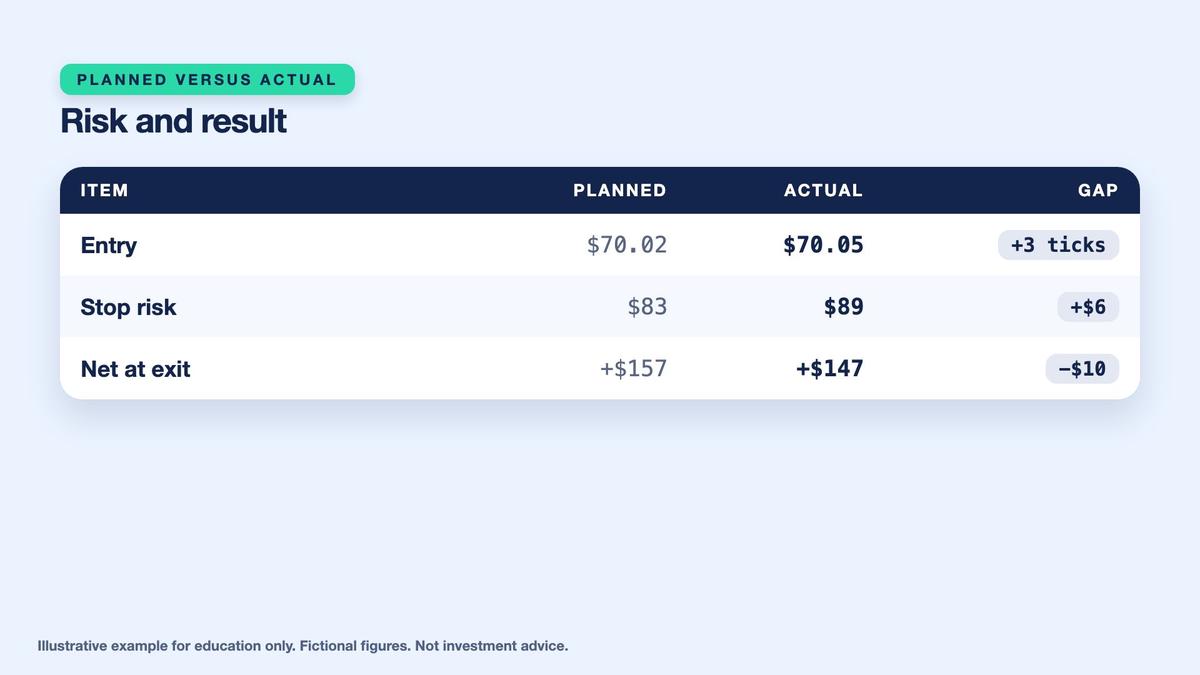
The simulated account has $10,000 starting equity and a written risk-per-trade budget of 1%, or $100. The plan is to buy two contracts at a displayed ask of $70.02, stop at $69.62 and target $70.82. The 40-tick stop across two contracts represents $80 gross price risk; the completed round-trip commission adds $3. Thus initial planned risk is $83, equal to 0.83% of equity. The target is 80 ticks above entry and provides $160 planned gross profit, or $157 after commission. This pretrade record becomes the baseline against which all later fills and execution shortfalls are measured.

Capture the Order-Time Quote, Spread and Partial Fills
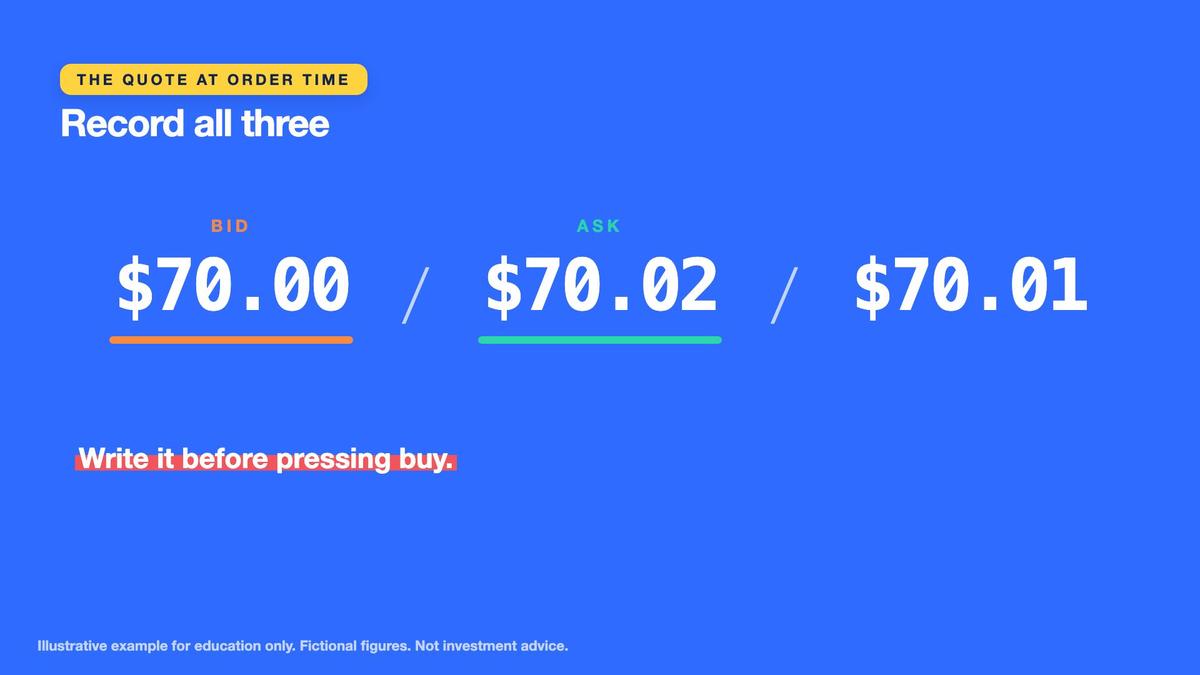
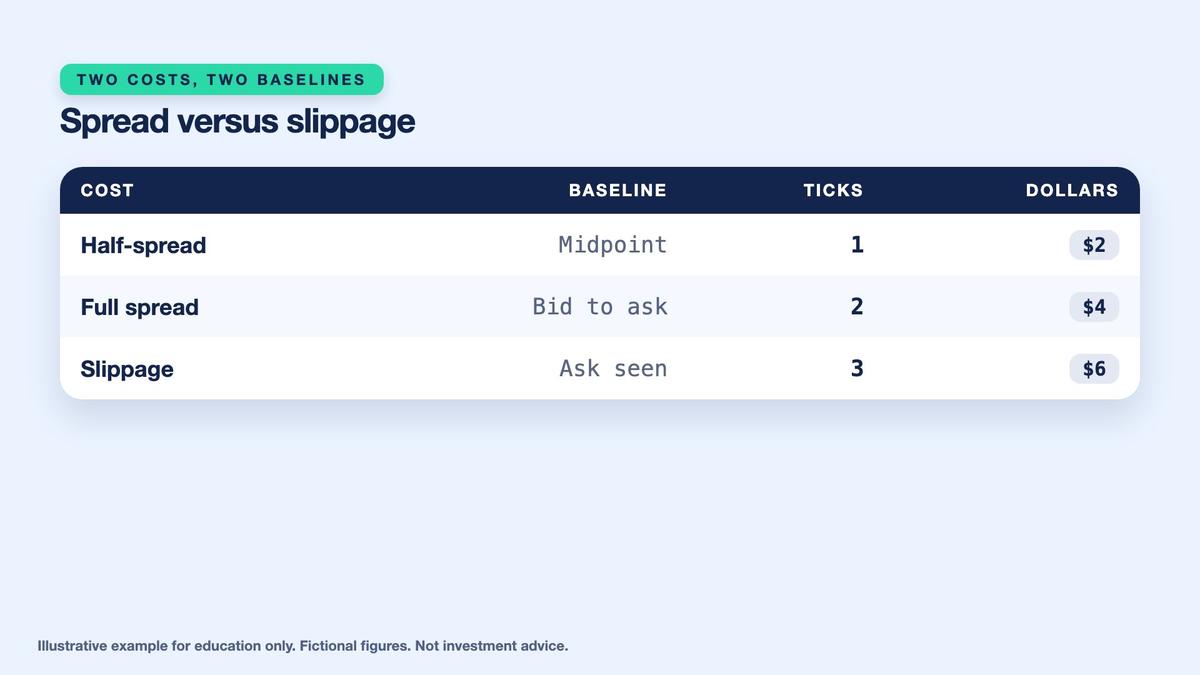
Immediately before placing the fictional market buy, record the displayed bid of $70.00 and ask of $70.02. Their midpoint is $70.01, and the quoted spread is $0.02 per barrel, or two price ticks. The product represents 100 barrels per contract, so the spread difference is $2 for one contract and $4 across two. The displayed ask sits one tick above the midpoint. Across two contracts, that one-tick difference represents $2 of entry execution friction measured against the midpoint. This midpoint comparison is not the same as slippage and should not be labeled or added to subsequent costs without identifying the reference price used.
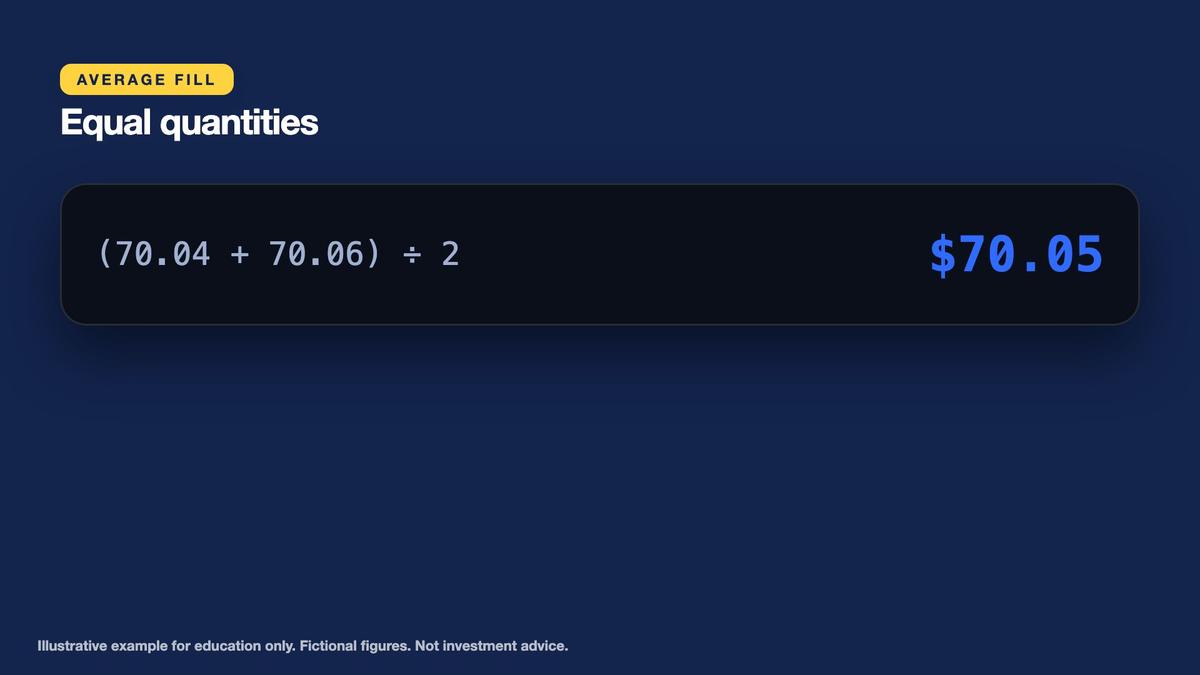
The simulated market buy fills in two separate parts: one contract at $70.04 and another at $70.06. Because the quantities are equal, the weighted average fill is ($70.04 plus $70.06) divided by two, or $70.05. If quantities differed, the calculation would multiply each fill price by its quantity before dividing by total executed contracts. A journal that records only the original order price of $70.02 would miss what the position actually cost. Record both partial execution prices, contract quantities, average fill and the original quotation. The full execution evidence should remain intact rather than replacing the plan with the final average.
Key points
- Record bid $70.00, ask $70.02 and mid $70.01 when the order is sent; the spread is 2 ticks, $2 per contract, $4 for two.
- The entry half-spread (ask minus mid) is 1 tick = $2; slippage is measured against the ask you saw, so the two use different baselines.
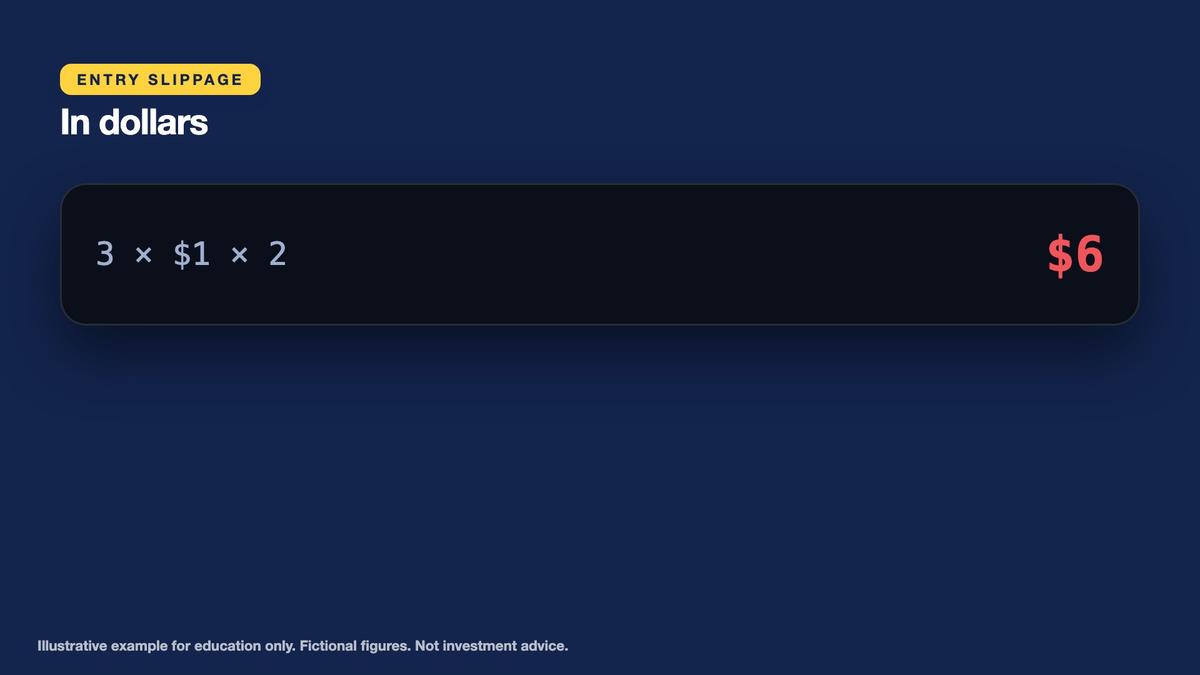
- A market buy fills 1 at $70.04 and 1 at $70.06; the average is $70.05, which is 3 ticks above the ask: slippage 3 x $1 x 2 = $6.
Entry slippage is measured against the ask observed when the market buy was sent. The weighted average execution of $70.05 is $0.03 above the $70.02 observed ask, or three ticks worse. With two contracts each worth $1 per tick, the slippage costs $6. That is separate from the $2 entry half-spread measured against the $70.01 midpoint. Both describe different aspects of execution, but their reference points differ. The complete bid-ask spread is not a separately billed fee and must not be deducted again from profit or loss already computed using actual fills. In the journal, store both the benchmark quotation and the corresponding execution comparison.
Recalculate Stop Risk After the Actual Entry
The original planned entry was $70.02, and the intended stop remained $69.62. That was a 40-tick distance and produced $83 commission-inclusive planned loss for two contracts. However, the actual entry is $70.05. Keeping the stop unchanged increases the distance to $70.05 minus $69.62, or $0.43 per barrel. This is 43 ticks rather than 40. The journal must update risk using the executed entry price rather than continue displaying the original risk as though the fill had not changed. The original plan should still remain visible as a separate field for comparison.
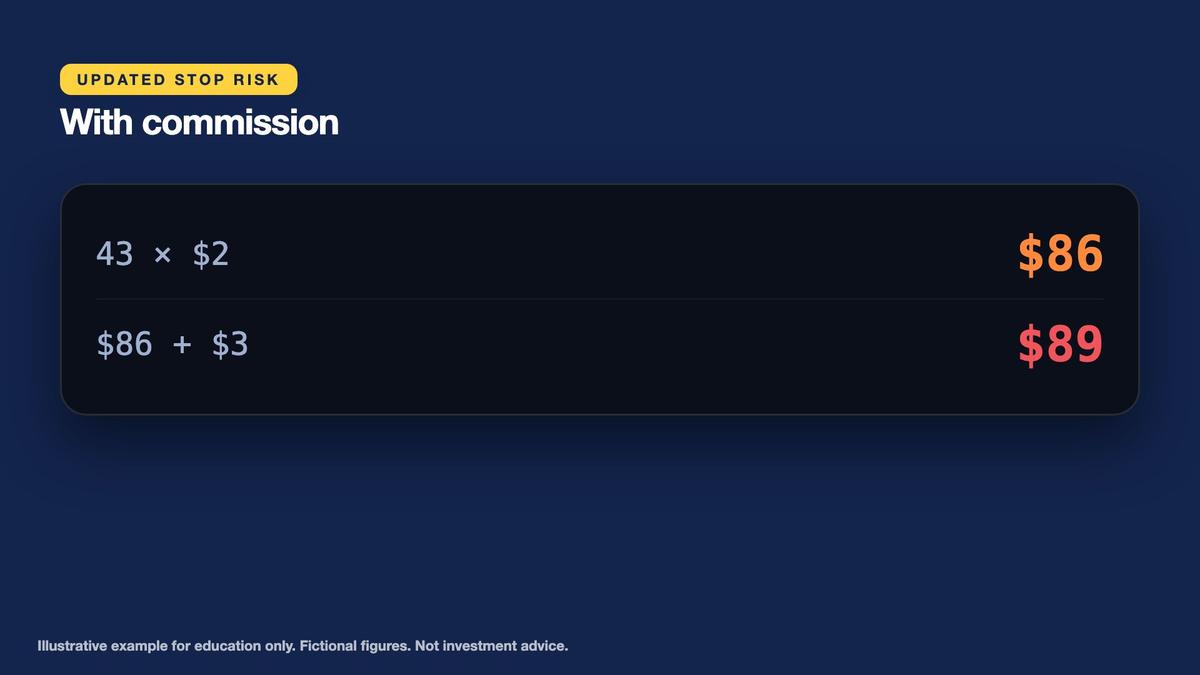
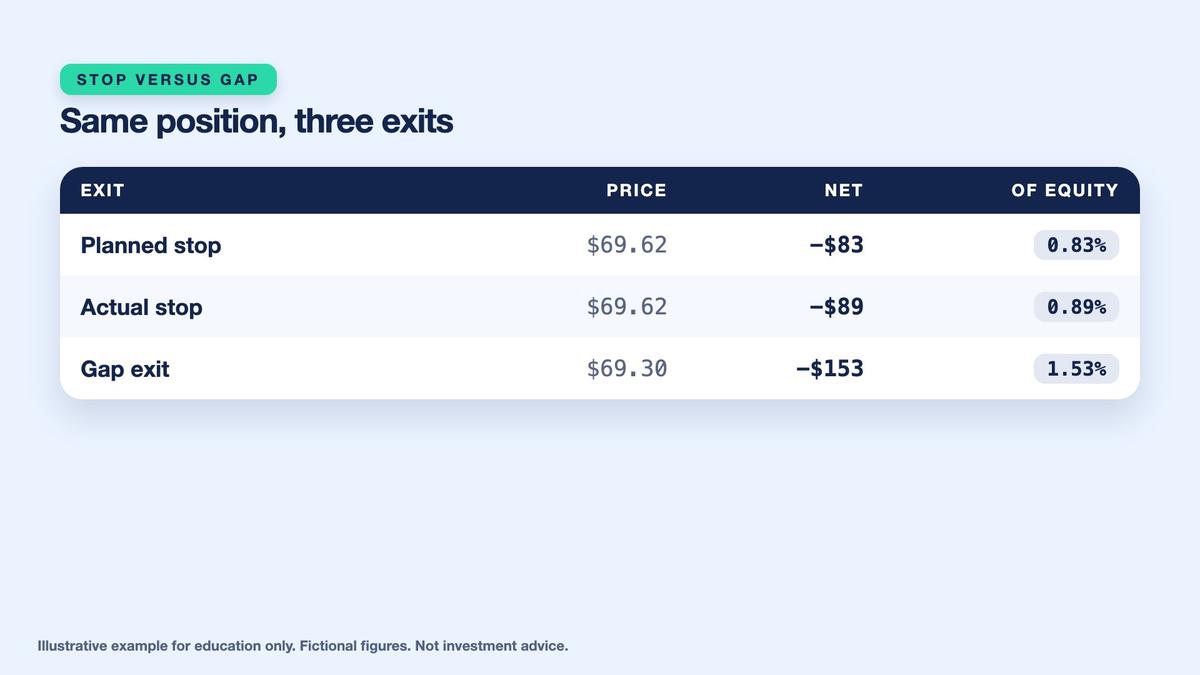
At two contracts, the combined price sensitivity is $2 per tick. Forty-three ticks therefore represent $86 of gross price loss if the stop later fills exactly at $69.62. Add the $3 round-trip commission to obtain $89 of updated commission-inclusive risk. Relative to $10,000 starting equity, this equals 0.89%, remaining below the written $100 budget. The increase from the original $83 planned risk is precisely $6, matching the three-tick entry slippage across two contracts. The journal should label the $89 as updated planned risk under exact-stop assumptions, not an unconditional maximum possible realized loss.
Key points
- From the actual $70.05 fill to the $69.62 stop is 43 ticks: 43 x $2 = $86 plus $3 commission = $89 (0.89%).
- That is $6 above the planned $83 but still under the $100 budget.
- Never overwrite the plan with the actual fill; keep both so execution quality stays visible.
This distinction is important because the size was originally selected using a valid policy, yet execution changed the economics after the order was submitted. A market order can fill at multiple prices, and a protective stop may execute beyond its trigger during volatility or gaps. The journal therefore records both compliance at planning time and compliance after execution. If the updated risk exceeded the written budget, the learner would need to flag the simulated policy breach rather than quietly edit the initial entry assumption. A consistent record separates trade design, actual execution, and subsequent market risks. It provides evidence about the process without guaranteeing that the trade can always be controlled within a fixed amount.
Reconcile Actual Net P&L and Execution Shortfall
The fictional target remains $70.82, and the simulated exit begins when the displayed bid shows that level. However, the market sell executes at $70.80, two ticks worse than the observed exit bid. The resulting shortfall is two ticks multiplied by the two-contract combined tick value of $2, or $4. Record the displayed bid and the actual fill separately, just as with the entry. The executed entry averaged $70.05, so the actual favorable difference is $70.80 minus $70.05, or $0.75 per barrel. Multiplying by 100 barrels per contract and two contracts gives $150 gross profit.
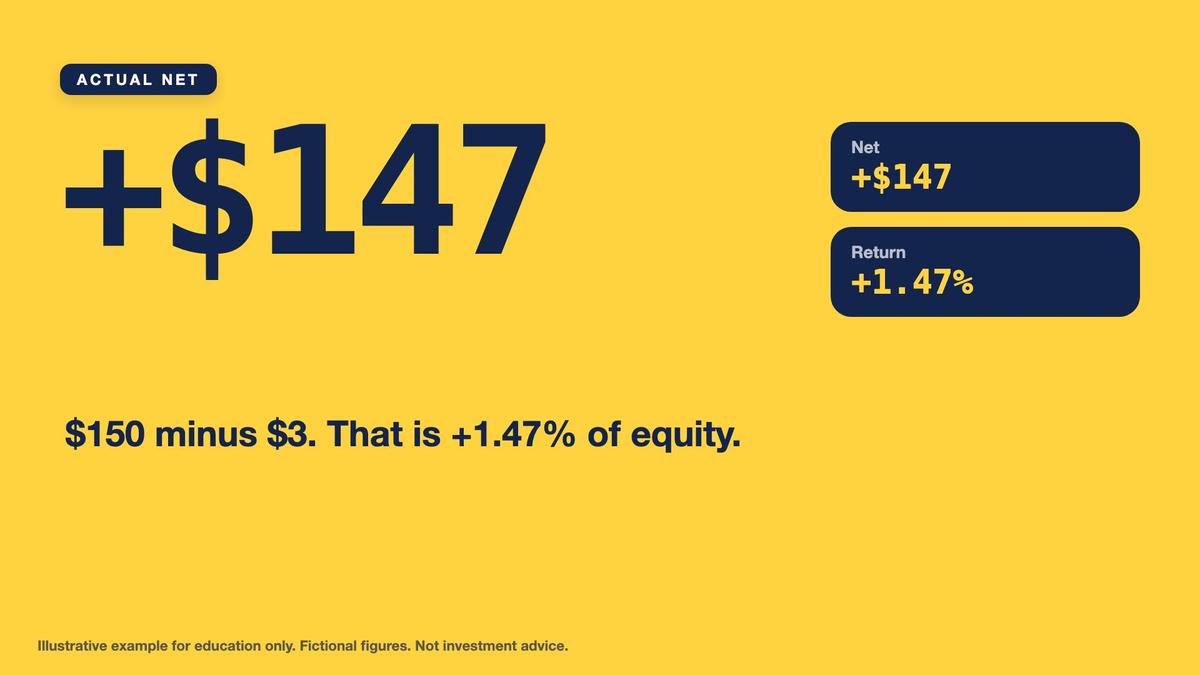
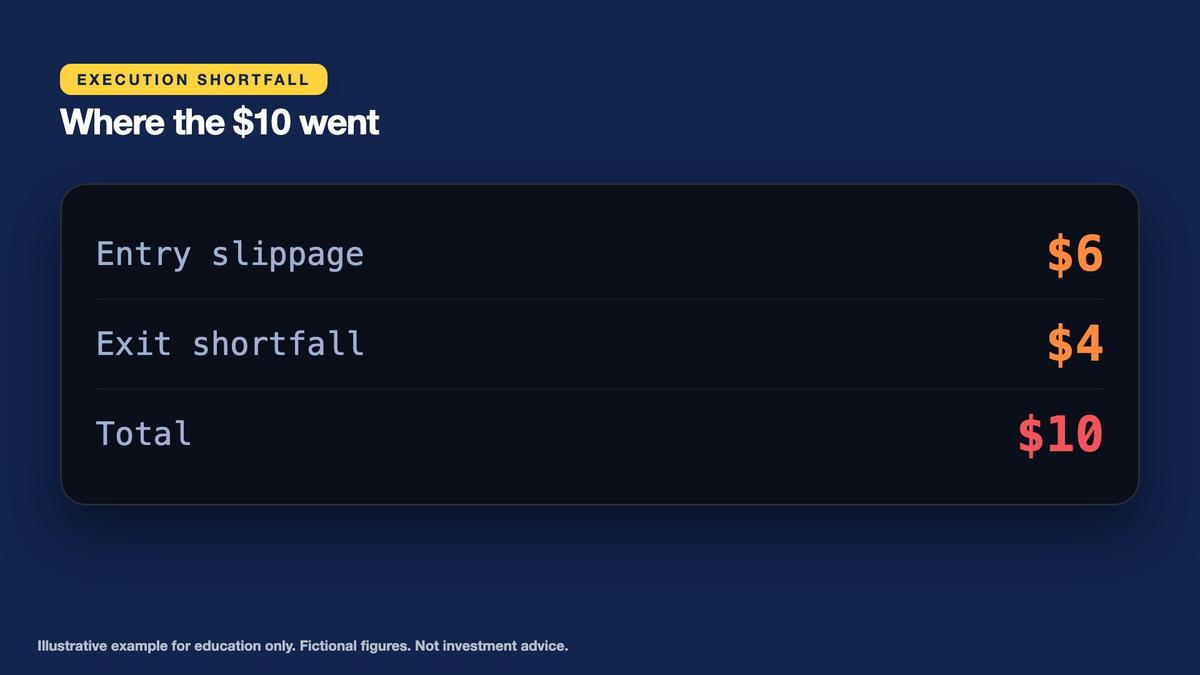
The fictional commission remains $0.75 per contract per side. Buying two contracts costs $1.50, and closing two costs another $1.50, giving $3 round-trip commission. Actual net profit is $150 minus $3, or $147. Relative to $10,000 starting account equity, that is positive 1.47%. The original plan expected $160 gross and $157 net at the displayed entry ask and target bid. The difference between planned net and actual net is $157 minus $147, or $10. The reduction is completely explained by the $6 adverse entry slippage and $4 adverse exit execution shortfall, with identical commission assumptions in both calculations.
Key points
- The market sell fills at $70.80 when the bid showed $70.82: 2 ticks worse, $4.
- Actual gross = (70.80 - 70.05) x 200 = +$150; minus $3 commission = +$147 net (+1.47%).
- Shortfall = planned $157 - actual $147 = $10 = $6 entry + $4 exit. Do not subtract the spread again.
Execution shortfall is an attribution exercise, not an additional charge to subtract after actual net profit has already been calculated. The $147 net result already reflects actual entry and exit execution prices, plus commission. Deducting the $10 shortfall again would double-count the effect. Similarly, subtracting the quoted bid-ask spread separately would double-count execution-side pricing embedded in gross P&L. The journal should show planned gross, planned commission, planned net, observed quotations, actual fills, actual gross, actual commission, actual net, and the difference between the two net results. This permits an audit of execution quality without mixing price movement, spread, slippage and explicitly billed fees.
Document Margin Requirements and a Margin-Increase Stress
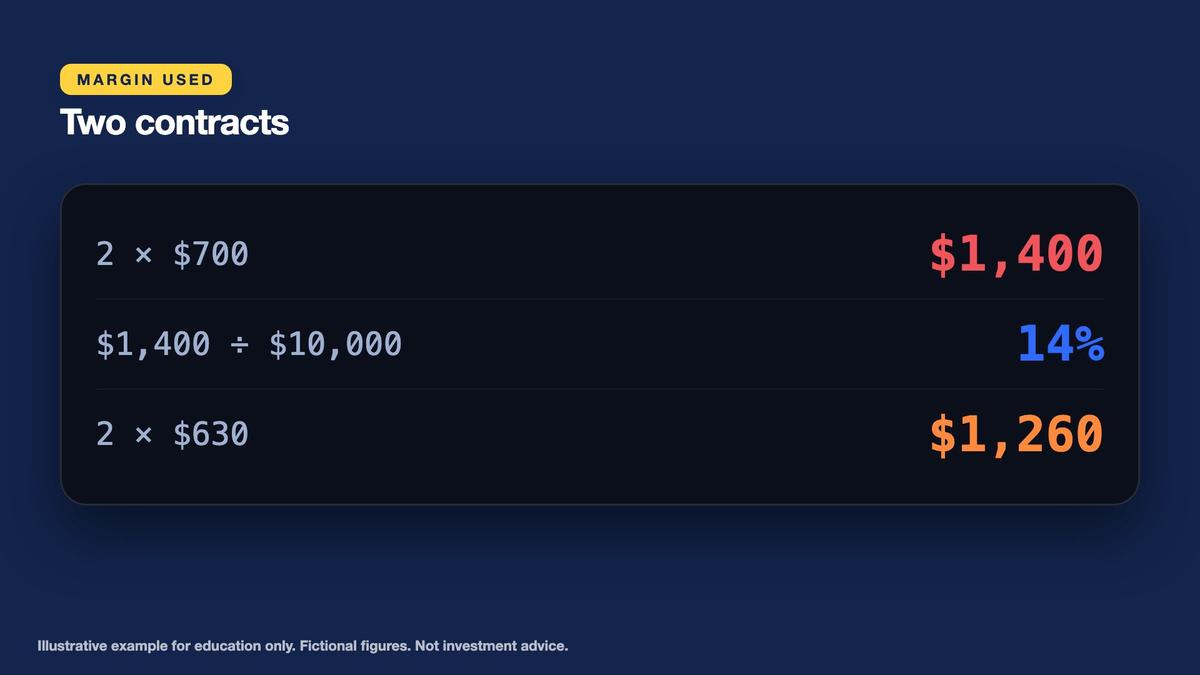
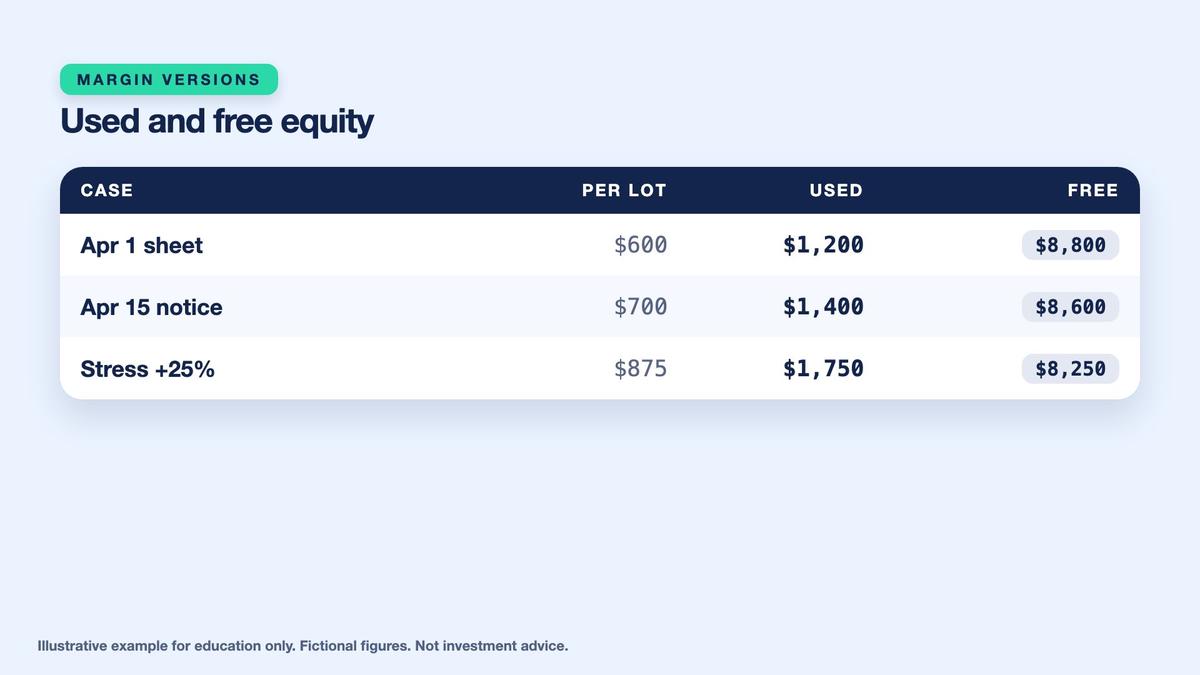
The original April 1 fictional specification showed initial margin of $600 and maintenance margin of $540 per contract. The April 15 notice raised those requirements to $700 and $630. Because the simulated trade occurs April 20, the updated numbers apply. Two contracts therefore require $1,400 initial margin, or 14% of the original $10,000 account equity. The updated maintenance requirement is two multiplied by $630, or $1,260. These amounts should appear in separate journal fields. Initial margin concerns the collateral needed to establish the position, while maintenance margin describes a lower continuing requirement under the assumed rules.
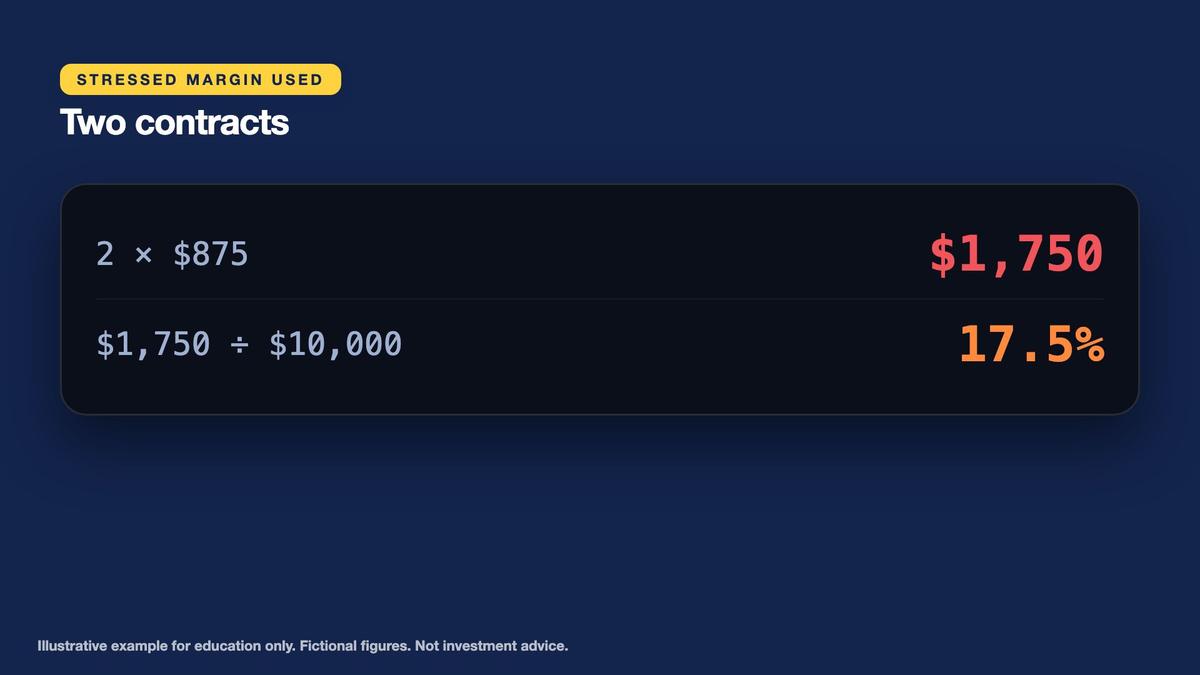
The simple free-equity calculation is $10,000 minus $1,400, leaving $8,600 before commissions, market P&L and other commitments. Now introduce a hypothetical further increase of 25% in the initial margin requirement. Per-contract initial margin rises from $700 to $875, so the same two-contract position requires $1,750. This equals 17.5% of the starting $10,000 account, and simplified free equity becomes $8,250. The increase reduces the calculated available amount by $350. The fictional stress does not specify another maintenance margin change, so do not invent one. Record the stress as an assumption rather than a new official margin notice.
Key points
- After the notice, margin for two contracts is 2 x $700 = $1,400 (14%) and maintenance 2 x $630 = $1,260; free equity $8,600.
- Stress: initial margin +25% is $875 per contract, 2 x 875 = $1,750 (17.5%), free equity $8,250.
- Margin changes do not change tick value; they change collateral and pressure.
Margin requirements influence available collateral and the possibility of margin calls or forced actions, but changing the initial margin does not alter the contract's fixed $2 combined tick sensitivity. This difference between collateral and notional exposure follows the earlier margin and leverage lessons. The journal should preserve initial and maintenance requirements, their document dates, the number of contracts, margin used, the simplified remaining equity and any stress assumptions. Real futures clearing and brokerage arrangements can involve additional margin calculations, settlement cash flows, restrictions and changes. The demonstration is therefore a teaching model, not a complete statement of actual withdrawable funds or a guaranteed liquidation threshold.
Stress-Test a Stop Gap Beyond the Written Risk Budget
An intended stop is a plan for responding to adverse price movement, not an assurance that a market order will execute at the specified price. Consider a separate fictional adverse scenario in which the price gaps through the $69.62 stop and the position eventually closes at $69.30. Use the actual $70.05 average entry, not the original intended $70.02 entry. The difference is negative $0.75 per barrel. Across 200 barrels, gross P&L is negative $150. This represents a substantially larger adverse movement than the 43-tick distance between the actual entry and original stop.
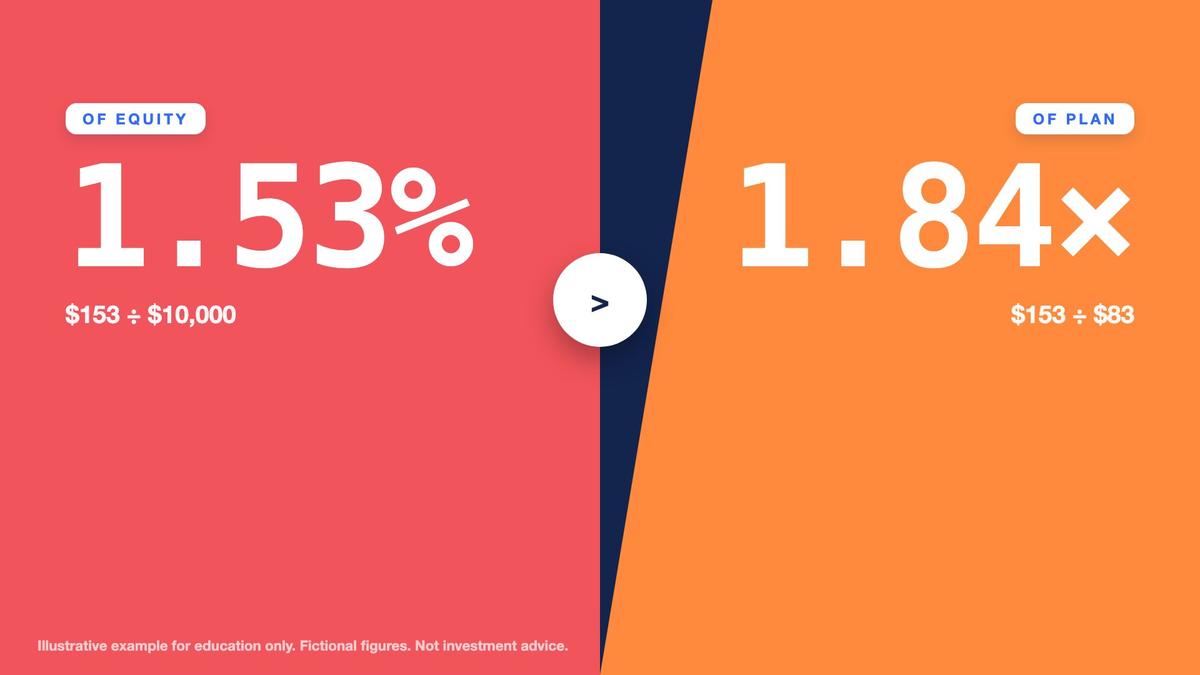
The hypothetical stop exit is a normal two-contract closing transaction, so the same $3 completed-round-trip commission applies. Net loss becomes $150 plus $3 in costs, or $153. Relative to the $10,000 account, the loss is 1.53%. Compared with the original $83 commission-inclusive planned risk, the realized loss is $153 divided by $83, approximately 1.84 times the initial amount. Compared with the written $100 budget, the $153 loss is 1.53 times as large and exceeds that budget by $53. The figures illustrate why planned sizing can reduce intended exposure without guaranteeing that realized losses remain within the original amount.
Key points
- If price gaps through the stop and the position closes at $69.30: (69.30 - 70.05) x 200 = -$150, net -$153 (-1.53%).
- That is 1.84 times the planned $83 and 1.53 times the $100 budget.
- A stop is an intended exit, not a guaranteed loss limit; record the gap assumption.
The gap scenario is not a prediction, a typical-loss estimate or a claim about actual oil-market frequency. It demonstrates a failure mode that a journal should explicitly document. Record the stop trigger, the assumed execution price, the price gap, the total gross and net loss, and the multiple of planned risk. Mark the budget as breached under this hypothetical outcome, even though the original position sizing complied with the written rule. Additional operational problems, trading interruptions, widened spreads and account-level collateral rules could complicate real execution further. The appropriate educational lesson is to preserve uncertainty in risk estimates rather than present a stop price as a guaranteed financial boundary.
Review Five Simulated Trades Without Claiming an Edge
Extend the journal with five entirely fictional two-contract trades, each already expressed as net P&L after commission. Their results are positive $147, negative $85, positive $62, negative $89 and positive $31. Adding them produces a net total of $66. Dividing by five gives an average of $13.20 per trade, equal to 0.132% of the original $10,000 account equity. Three trades are profitable and two are losing, producing a 60% win rate. The winning results total $240, so average win is $80. The two losing results total $174 in absolute value, making average loss $87. These summary statistics describe only the invented five-trade sample.
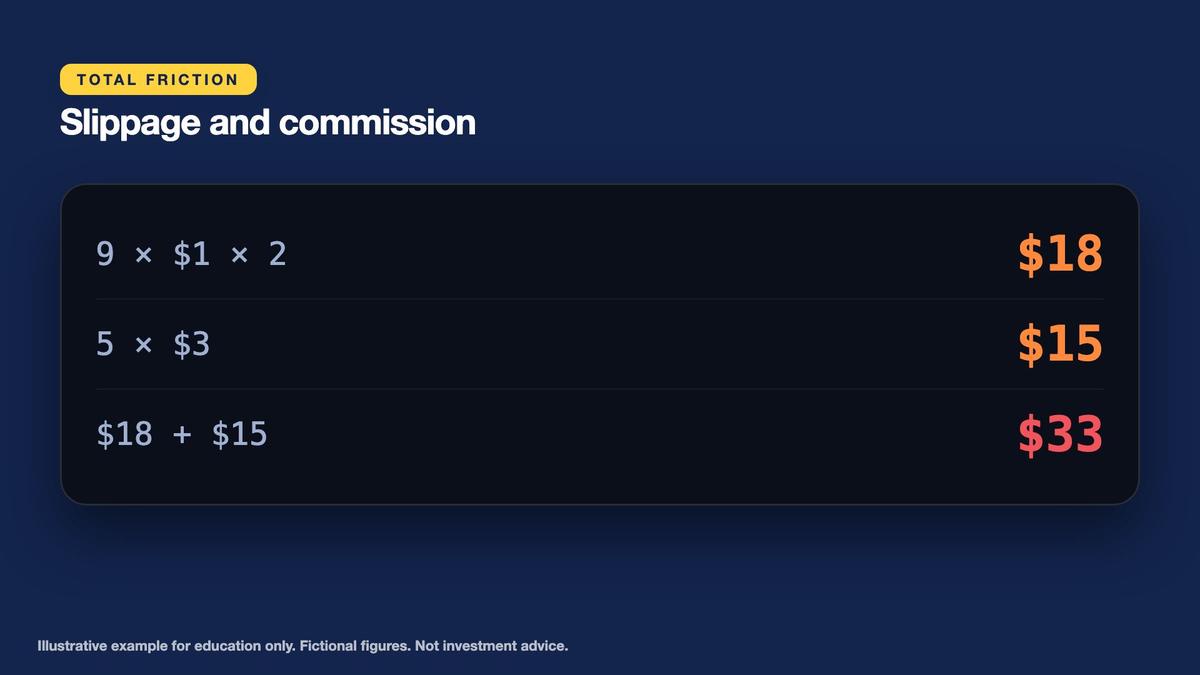
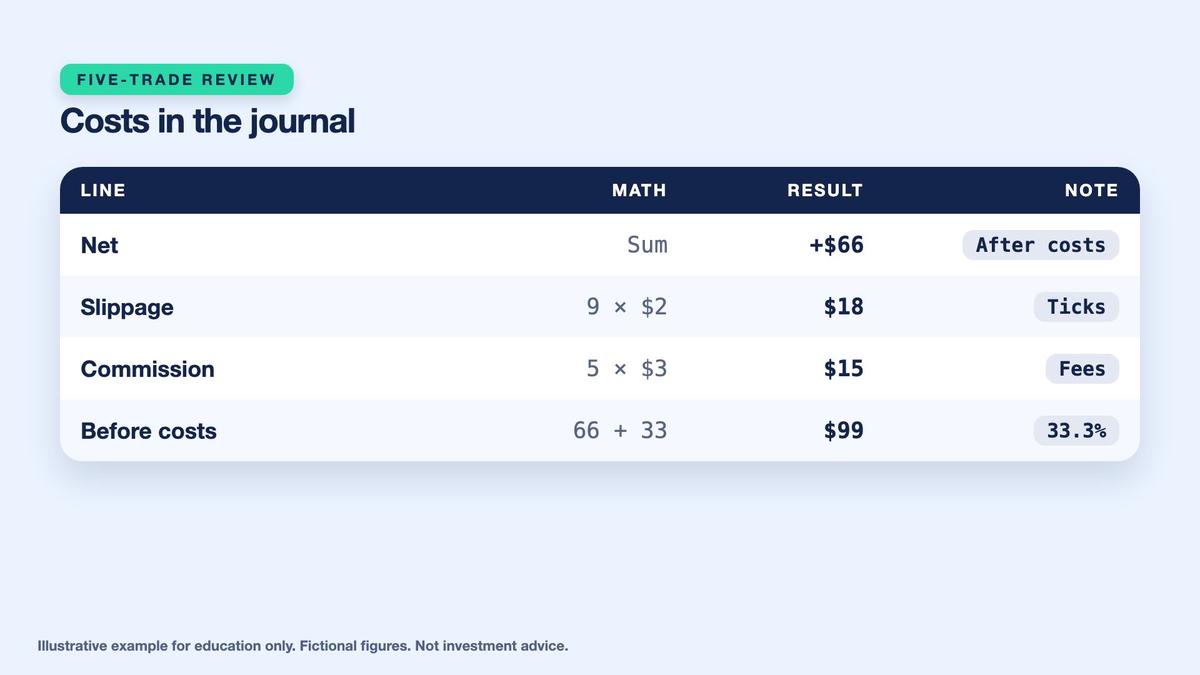
Now measure execution costs using a separate journal field. The five recorded slippage amounts are 3, 1, 2, 3 and 0 ticks, for nine ticks total and 1.8 ticks on average per trade. In this simplified summary, each tick represents an aggregate two-contract execution shortfall worth $2. Therefore slippage totals $18. Each trade pays $3 round-trip commission, giving $15 across five trades. Combined measured costs are $33. Adding these costs back to the $66 net result yields a hypothetical $99 P&L before slippage and commission. Costs therefore consumed $33 divided by $99, or approximately 33.3%, of that frictionless comparison.
Key points
- Five trades, nets +$147, -$85, +$62, -$89, +$31: sum +$66, average +$13.20, 3 wins of 5 (60%), average win $80, average loss $87.
- Slippage ticks 3, 1, 2, 3, 0 = 9 ticks, $18; commission 5 x $3 = $15; total costs $33.
- Frictionless total $99, so costs took 33.3%. Five trades prove very little: review process, not prediction.
A five-trade sample is far too small to establish a reliable strategy, expected return, win probability or future performance. The frictionless figure is a mechanical comparison based on the recorded slippage and fee assumptions, not a tradable result guaranteed to occur without those costs. The learner should concentrate on whether prices and contract quantities were recorded correctly, whether the latest margin notice was applied, whether original plans were preserved, and whether losing or rejected setups were logged. A useful process review can reveal missing data, repeated execution difficulties and breaches of written rules. It cannot transform five fictional trades into statistical evidence of a profitable trading method.
Complete the One-Page Journal and Establish a Review Routine
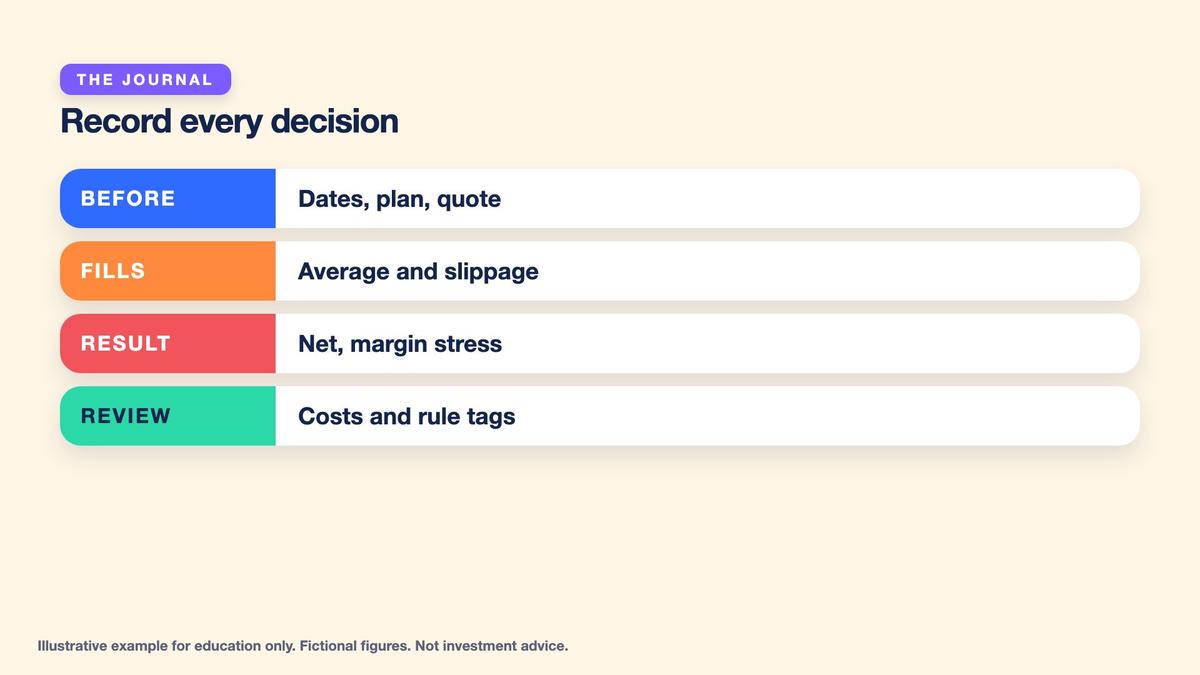
The one-page journal begins with identification and pretrade fields: simulated date, fictional product, specification version, applicable margin notice, contract size, tick value, expiry deadline, account equity, written risk rule, contract count, observed bid and ask, intended entry, stop, target and planned profit or loss. The order-time quote must be retained so slippage can be calculated against what was visible when the order was submitted. The execution section lists each partial-fill quantity and price, the weighted average entry, exit-side quotation, actual exit fill, gross P&L, explicit commissions, slippage and net P&L. Planned and actual figures belong in different columns.
Practice Lab: Audit a Fictional Micro Oil Trading Journal
Use the fictional Sample Micro Oil futures product and simulated money only. Record the April 1, 2026 specification, April 15 margin notice, April 20 trade date, and May 19 last trading day. Write the original plan before the simulated order: two contracts, $70.02 entry, $69.62 stop, $70.82 target, $83 planned risk, $157 planned target net and a $100 budget. Save the entry quote of $70.00 bid and $70.02 ask, then calculate the actual average entry from one fill at $70.04 and another at $70.06. Record slippage against the observed ask separately from spread measured against the midpoint. Recalculate risk with the actual entry, reconcile the $70.80 exit and $147 net result, and attribute the $10 execution shortfall. Document updated initial and maintenance margin, a further 25% hypothetical initial-margin increase and a separate $69.30 gap-stop stress. Finish by reviewing the five net results, slippage and commission totals, and whether the process followed its written rules. Use a paper worksheet or isolated mock platform; no live order or real account is necessary.
- Decision 1: The fictional specification is dated April 1, 2026, a margin notice is dated April 15, the paper trade occurs Monday April 20, and the last trading day is Tuesday May 19. Account equity is $10,000. — What information must the journal preserve before the order, which margin notice applies, and how many calendar days remain before the last trading day?
- Decision 2: The planned long buys two contracts at displayed ask $70.02, with bid $70.00, midpoint $70.01, stop $69.62, target $70.82 and $3 round-trip commission. The actual buy fills one contract at $70.04 and one at $70.06. — Calculate the weighted average fill, spread, entry half-spread, entry slippage, original planned risk and updated exact-stop risk.
- Decision 3: The intended target exit bid is $70.82, but a simulated market sell fills both contracts at $70.80. Actual entry was $70.05, and completed round-trip commission is $3. — Calculate actual gross and net P&L, exit shortfall, total execution shortfall and percentage of starting equity.
- Decision 4: The current margin notice requires $700 initial and $630 maintenance per contract. A hypothetical additional 25% increase affects initial margin only. Separately, a price gap causes the two-contract long entered at $70.05 to exit at $69.30. — Calculate current and stressed margins, remaining simplified equity, gap loss and how far that loss exceeds the written budget.
- Decision 5: Five fictional two-contract trades produce net P&L of +$147, -$85, +$62, -$89 and +$31. Their slippage totals 3, 1, 2, 3 and 0 position ticks, and each completed round trip pays $3 commission. — Calculate net total, average P&L, win rate, average win, average loss, slippage costs, total costs and frictionless comparison, then state what cannot be inferred.
Answer key
Add a risk section that compares the $83 originally planned stop risk with the $89 updated exact-stop risk after the $70.05 entry. Record current $1,400 initial margin, $1,260 maintenance margin and simplified $8,600 available equity before costs. Include the hypothetical 25% additional margin increase, resulting in $1,750 initial margin and $8,250 remaining equity. Document the separate $153 gap-loss scenario and its 1.84 multiple of initial planned risk. Keep hypothetical stress results visibly distinct from actual simulated trade outcomes, and mark whether each scenario respects the written budget. Expiry notes should state the 29-day countdown and any later review date.
Key points
- One page: dates and versions, plan, quote, fills, slippage, actual risk, net, shortfall, margin used and stress, rule-following tag.
- Common mistakes: journal after the fact, no quote recorded, ignored partial fills, old margin, judging by one trade, hiding bad trades.
- Practice logging a trade on a demo platform with simulated money only.
Finish with a brief rule-following tag and a regular review process. Record whether the original specification was current, the planned risk met the policy, the fill was documented completely, the margin assumptions were checked, and execution costs were reconciled without double-counting. Include rejected setups and losing trades, rather than selecting only successful examples. At review time, calculate a small set of descriptive measures, identify missing information and avoid claiming statistical certainty. This lesson connects the XAUUSD sizing lab, Micro Oil demonstration, spread and slippage principles, and margin-and-leverage concepts. The next Risk Review Clinic preparation will audit contract specifications, minimum-size constraints and slippage assumptions using the same disciplined documentation approach.
Worked example at a glance
Key terms
- Journal: a written record of each decision, its plan and its result.
- Spread: the difference between ask and bid, measured in ticks.
- Midpoint: the average of the bid and the ask.
- Slippage: a fill worse than the price seen when the order was sent.
- Partial fill: an order executed in several parts at different prices.
- Average fill: the weighted average price of all parts of an order.
- Execution shortfall: planned result minus actual result caused by execution.
- Initial margin: the funds required to open a position.
- Maintenance margin: the lower funds level required to keep a position open.
- Free equity: equity left after initial margin, before costs and price changes.
- Gap: a price jump that skips over a stop level.
- Commission: the fee charged per contract per side.
Multi Asset Trading Lab provides educational information only and does not constitute personalized investment, trading, financial, legal, tax, accounting, commodities, derivatives, brokerage, exchange, clearing or risk-management advice. Sample Micro Oil futures is an entirely fictional teaching product. The specification dated April 1, 2026, margin notice dated April 15, 2026, simulated trade dated April 20, 2026, and last trading day of May 19, 2026 are invented classroom inputs. No real exchange, real contract code, actual fund, broker, market price, trade, exchange notice or real financial product is identified or recommended. All simulated account values, bid and ask quotations, partial fills, trading costs, commissions, stop levels, targets, gap assumptions, margin changes and journal results are fictional. No real-money trading, account opening, futures order, commodity delivery or financial commitment is required or encouraged. The fictional contract represents 100 barrels, has a $0.01 price tick worth $1.00 per contract, and charges $0.75 commission per contract per side. Two contracts therefore represent 200 barrels and have $2.00 of combined gross profit-and-loss sensitivity per tick. These definitions are specific to the invented product and must not be applied to actual oil instruments without checking current official contract specifications. The original fictional specification requires initial margin of $600 and maintenance margin of $540 per contract. The later fictional notice dated April 15 raises the requirements to $700 initial and $630 maintenance. The April 20 simulated trade uses the later requirements. Real contract specifications, collateral rules, maintenance thresholds, broker risk policies and effective dates may change and must be independently verified from applicable official sources. The hypothetical account begins with $10,000 equity and a written risk-per-trade policy of 1%, corresponding to a $100 initial planned-loss budget. The original fictional trade plan buys two contracts at the observed $70.02 ask, uses an intended stop exit at $69.62, and identifies an illustrative target exit at $70.82. The stop distance is $0.40 per barrel, or 40 ticks. With $2 combined price sensitivity per tick, gross intended stop-price loss is $80. The fictional completed round-trip commission is $3, so the initial commission-inclusive planned risk equals $83, or 0.83% of starting equity. The target lies 80 ticks above the entry ask. Its assumed complete fill would produce $160 gross profit and $157 net profit after commission. The planned gross reward-to-price-risk ratio is 2:1. These figures are not trading signals, price forecasts, recommended contract quantities or guaranteed results. They are arithmetic based on stipulated fictional prices and assumed complete executions. The order-time fictional quote is $70.00 bid and $70.02 ask, giving midpoint $70.01 and spread $0.02, or two ticks. The complete bid-ask difference across two contracts is $4. The entry ask is one tick above the midpoint, which corresponds to $2 of midpoint-referenced entry friction. This midpoint-based comparison is distinct from adverse slippage measured against the ask observed when the market buy is submitted. The fictional market buy fills one contract at $70.04 and the other at $70.06, giving a quantity-weighted average entry of $70.05. The actual average is three ticks above the $70.02 observed ask, equivalent to $6 of adverse entry slippage across the two-contract position. This execution shortfall is not a separately billed exchange fee. Gross profit and loss based on actual execution prices already reflect the economic effects of those fills. The originally planned $69.62 stop remains unchanged, making actual-fill-to-stop distance $70.05 minus $69.62, or $0.43 per barrel and 43 ticks. Across two contracts that represents $86 gross stop-price loss. Adding the $3 stipulated round-trip commission produces $89 updated commission-inclusive risk, or 0.89% of starting equity. It is $6 greater than the original $83 planned risk but remains $11 below the written $100 budget under exact-stop assumptions. The original pretrade risk and the updated risk must both be recorded; rewriting the earlier plan to match the realized fill would destroy the audit trail. The fictional exit begins when the displayed bid is $70.82, but the simulated market sell executes at $70.80, two ticks worse. Across two contracts the difference is $4. Actual gross trade profit is ($70.80 - $70.05) multiplied by 200 barrels, or $150. Deducting the $3 round-trip commission produces $147 net profit, or 1.47% of the $10,000 starting equity. The original plan expected $157 net profit, so the actual result is $10 lower. The difference is attributed to $6 adverse entry slippage and $4 adverse exit shortfall. This attribution must not be charged again after the fill-based actual net result has already been calculated. Similarly, the quoted spread must not be deducted separately from gross or net profit calculated using actual executed ask and bid prices, because doing so would double-count execution friction. The entire exercise assumes the fictional quoted prices, displayed references and execution fills are available as described. Real market orders may experience partial fills, changing quotations, spreads, variable liquidity, delays, different execution policies, outright rejection, market impact, trading halts or slippage much larger than the classroom figures. A displayed quote does not guarantee that an order will execute at that price or that the full requested quantity will fill. The journal must distinguish planned entry and exit, observed market quotes, actual partial fills, weighted average execution, explicit commissions, price movement and the difference between intended and realized outcomes. The fictional April 15 notice sets initial margin at $700 and maintenance margin at $630 per contract. For two contracts, current initial margin is $1,400, or 14% of the original $10,000 account, while maintenance margin totals $1,260. Subtracting the current initial requirement from starting equity produces $8,600 of simplified funds before commissions, market profit and loss or other account obligations. The separate hypothetical margin stress assumes an additional 25% increase in initial margin only, raising the per-contract requirement from $700 to $875. For two contracts, required initial margin becomes $1,750, or 17.5% of starting equity, and simplified funds after the requirement decline to $8,250. The resulting $350 reduction illustrates collateral pressure. No additional maintenance margin revision is specified in that stress, so none should be inferred. These simplified free-equity figures do not constitute a promise about actual withdrawable funds or brokerage margin availability. Actual futures accounts may be subject to variation margin, account-level clearing rules, settlement cash flows, margin calls, liquidation requirements, different collateral treatment and other obligations. Margin is collateral supporting financial exposure, not a fee, guaranteed maximum loss or protective stop. The separate gap-risk illustration assumes the two-contract long entered at the actual weighted price of $70.05 closes at $69.30 rather than the intended $69.62 stop. The adverse price difference is $0.75 per barrel, producing $150 gross loss across 200 barrels. After the same $3 round-trip commission, net loss is $153, equal to 1.53% of starting account equity. Relative to the original $83 commission-inclusive planned risk, this is approximately 1.8434 times as large, conventionally displayed as 1.84 times. Relative to the $100 risk budget, it is 1.53 times the allowed amount and exceeds that budget by $53. The example demonstrates that a stop instruction is not a guaranteed execution price or maximum financial loss. Actual losses can exceed these illustrations if spreads widen, prices gap further, markets become illiquid, trading is interrupted, collateral requirements change or broker execution differs. The hypothetical gap is not a prediction, frequency estimate or representation of a historical oil-market event. The separate five-trade fictional journal contains two contracts per trade and net P&L after commission of +$147, -$85, +$62, -$89 and +$31. These sum to +$66, or +$13.20 average per trade. Relative to the original $10,000 account equity, that average represents 0.132%. Three of five trades are positive, giving a sample win rate of 60%. The winning trades total $240, producing average win of $80, while the losing trades have combined magnitude of $174, giving an average loss magnitude of $87. These are descriptive properties of a five-observation fictional sample, not estimates of future win probability or expected strategy returns. The recorded slippage sequence is 3, 1, 2, 3 and 0 ticks, totaling nine ticks, or 1.8 ticks on average per trade. For the aggregate summary, each recorded tick is treated as a combined two-contract execution shortfall worth $2. Total assumed slippage cost is therefore $18. Each of five completed two-contract trades pays $3 round-trip commission, giving $15 commissions in total. Combined specified costs are $33. Adding them back to the $66 total net P&L creates a mechanical frictionless comparison of $99. The $33 combined costs amount to one third, or approximately 33.3%, of that $99 before-cost figure. This mechanical comparison assumes that the stated slippage and commissions are the only costs being removed and that all other simulated outcomes are held constant. It is not an executable profit guarantee, and actual results without such costs cannot be inferred directly. The five-trade journal uses a separate aggregate slippage field; it should not be confused with the full entry-plus-exit execution shortfall of the individually examined first trade unless the scope of the recorded metric is defined. Every journal should clearly state whether slippage reflects entry only, exit only, both sides, or a combined position-level shortfall to ensure meaningful comparisons. The five-trade sample is too small to demonstrate statistical significance, durable profitability, a reliable trading edge, predictive skill, future returns or a dependable win rate. Selectively recording winners, hiding losing trades, changing plans after execution, ignoring rejected setups or applying outdated specifications can further undermine the usefulness of a journal. The stated last trading day is May 19, 2026, which is 29 calendar days after the simulated April 20 trading date. Actual products may have different trading-day calendars, settlement deadlines, notice periods or earlier broker position cutoffs. Expiry and cash or physical settlement requirements must be understood from current official specifications. This course does not assert that completing a journal eliminates market, counterparty, margin, slippage, expiry or delivery risk. The purpose of the exercise is to develop a repeatable procedure for preserving original plans, recording actual fills, reconciling commissions and execution differences, stress-testing assumptions and reviewing whether decisions followed written policies. The earlier XAUUSD contract and sizing lab, Micro Oil demo lab, spread and slippage lessons, and margin and leverage materials support these concepts but do not guarantee safe or profitable execution. The next Risk Review Clinic preparation is an educational exercise about auditing contract specifications, minimum position sizes and slippage assumptions. Nothing in this lesson recommends buying, selling, holding, borrowing against, rolling or trading any actual commodity, futures contract, CFD, option, security or other financial instrument. Every example remains fictional, simulated and strictly educational, without investment advice or price predictions.
Lesson Checkpoint
Review what you learned and get feedback on your work.