



In this seventeen-minute beginner hands-on lab, learners use a dated fictional exchange specification to calculate tick values, position sizes, margin requirements, execution costs, and expiry risks for Sample Micro Oil futures. The fictional specification dated April 1, 2026 defines a 100-barrel cash-settled contract with a $0.01 price tick, $1.00 tick value, $600 initial margin, $540 maintenance margin, and $0.75 commission per contract per side. A fictional margin notice dated April 15 raises initial margin to $700 and maintenance margin to $630, demonstrating why specification dates and subsequent notices must be recorded. On the simulated April 20 trading date, learners use a $10,000 account and 1% risk budget to size a two-contract position at a $70.02 entry, verify $14,004 notional, $1,400 updated initial margin, and $83 planned stop risk including commission. They calculate a $160 gross target gain, a $157 net target profit after commission, an $83 net stop loss, and an $89 net slipped-stop loss. The lab then compares a hypothetical $131 roll-price-differential-plus-commission calculation with a separate cash-settlement scenario producing a $45.50 net loss. Learners finish by documenting the contract's May 19 last trading day, calculating days remaining, distinguishing cash settlement from physical delivery, and completing a one-page simulated trading journal. All exchange specifications, notices, contracts, quotations, account values, and transactions are invented for education; no real exchange, actual product, investment advice, or price prediction is involved.
Read the Fictional Dated Exchange Specification
Begin the laboratory by opening the fictional Sample Micro Oil futures specification, version dated April 1, 2026. Record the document title, version date, fictional source and simulated trading date in the first row of the journal. The trade will be evaluated on Monday, April 20, 2026. The product is an invented example rather than a real exchange instrument, and all prices and contract rules are classroom assumptions. Its purpose is to teach a process that would begin with a current specification: identify the underlying quantity, minimum price increment, tick value, settlement method, commission, last trading day and margin rules before interpreting an order ticket. A dated specification is a snapshot, not a promise that every listed requirement will remain unchanged.

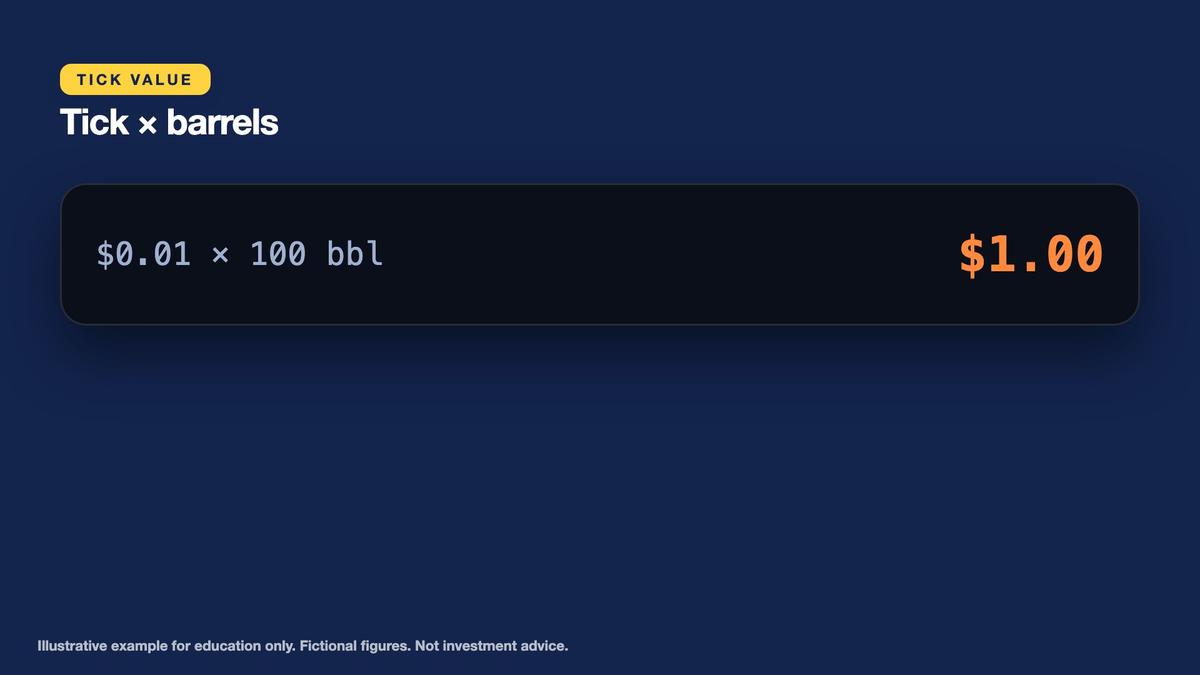
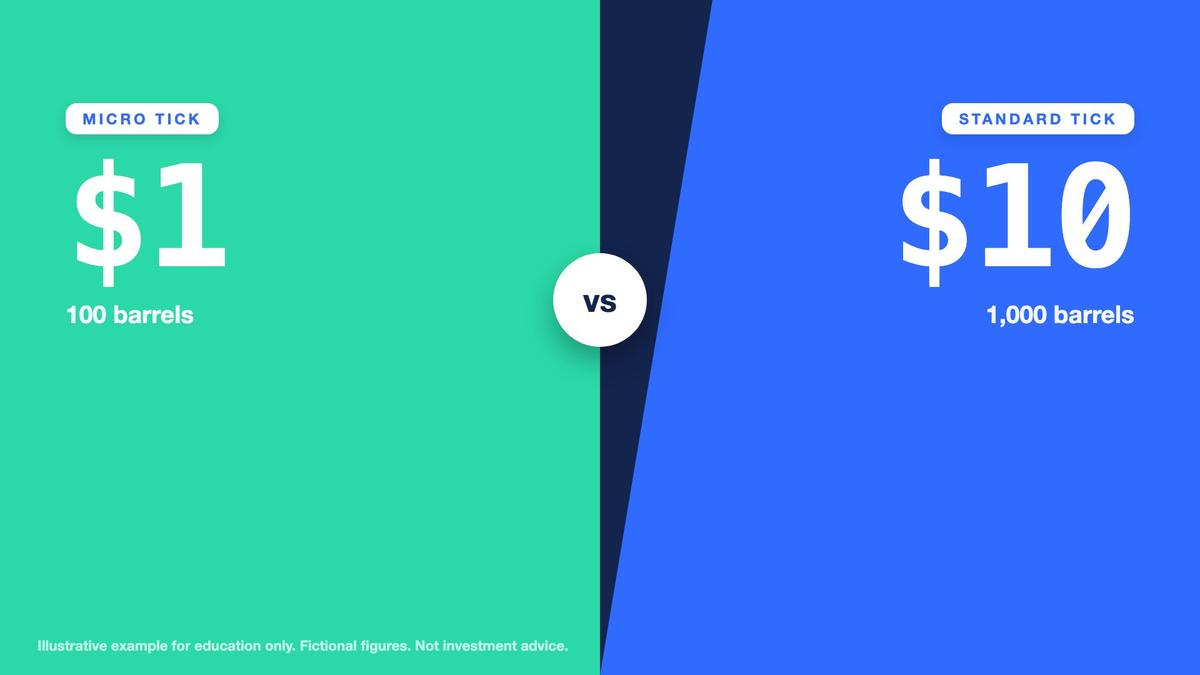
The fictional micro contract represents 100 barrels of oil. A fictional standard contract represents 1,000 barrels, so the micro contract is one tenth as large. Both quote dollars per barrel. The minimum price tick is $0.01 per barrel. Multiplying $0.01 by 100 barrels gives a tick value of $1.00 for one micro contract, while the fictional standard 1,000-barrel contract has a $10.00 tick value. The distinction matters because a learner who accidentally applies the standard multiplier to a micro position will overstate each contract's price sensitivity by a factor of ten. The contract is cash settled against a fictional final reference price rather than requiring delivery of barrels.

Key points
- Record the spec version date (2026-04-01) and the notice date (2026-04-15) with their source: both are part of risk control.
- Fictional Sample Micro Oil: 100 barrels per contract, tick $0.01, cash settled, last trading day Tuesday 19 May 2026.
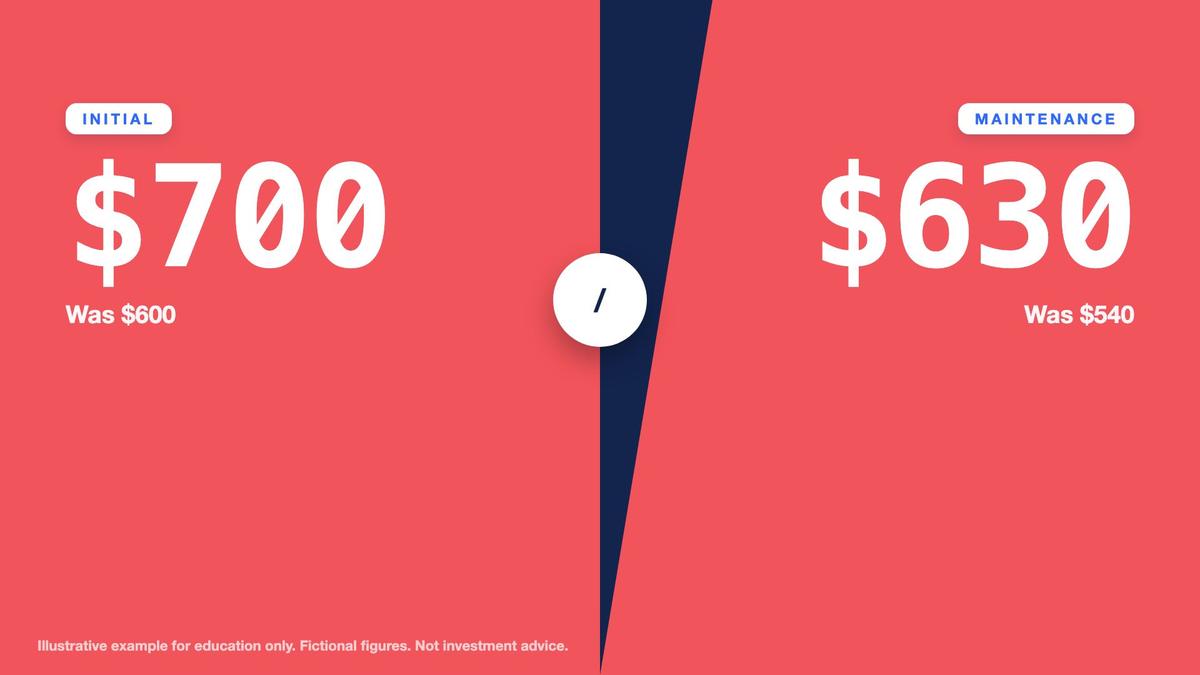
- The April 15 notice raises margin to $700 initial and $630 maintenance per contract. On April 20 the old $600 is obsolete.
The original specification shows $600 initial margin and $540 maintenance margin per contract. It also specifies $0.75 commission per contract per side and Tuesday, May 19, 2026 as the last trading day. However, the learner must read a fictional margin notice dated April 15, 2026, before using the original margin figures. That notice raises initial margin to $700 and maintenance margin to $630 per contract. Because the simulated trade occurs on April 20, the updated amounts apply. Record both versions and the fact that the later notice supersedes the original margin values. No other specification fields are changed in this exercise.

Calculate Tick Value, Spread and Position Sensitivity
Record the fictional April 20 quote of $70.00 bid and $70.02 ask. Their midpoint is $70.01, and the displayed spread is $0.02 per barrel. Since the contract moves in $0.01 ticks, the spread is two ticks wide. A single 100-barrel contract has a $1.00 tick value, so two ticks represent $2.00 of quoted bid-ask difference for one contract. For the planned two-contract position, the same two-tick spread corresponds to $4.00. The spread is execution friction reflected in bid and ask quotations rather than the separately billed commission.
Simulate buying two contracts at the $70.02 ask. The position represents 200 barrels, and its combined tick value is $2.00 per tick. A move of 35 ticks increases the relevant price quotation by $0.35, from $70.02 to $70.37. Assuming an exit fill at $70.37, gross profit equals 35 multiplied by $2.00, or $70.00. This preliminary exercise illustrates the calculation without selecting a final target. The relationship can also be calculated as a $0.35-per-barrel change multiplied by 100 barrels per contract multiplied by two contracts. Both methods produce the same $70 result when the executed prices are identical.
Key points
- Tick value = $0.01 x 100 barrels = $1.00 per contract (the 1,000-barrel standard would be $10.00).
- Bid $70.00 and ask $70.02: the spread is 2 ticks, $2.00 per contract, $4.00 for two contracts.
- Two contracts: $2.00 per tick, so a 35-tick move (70.02 to 70.37) is 35 x 2 = $70.
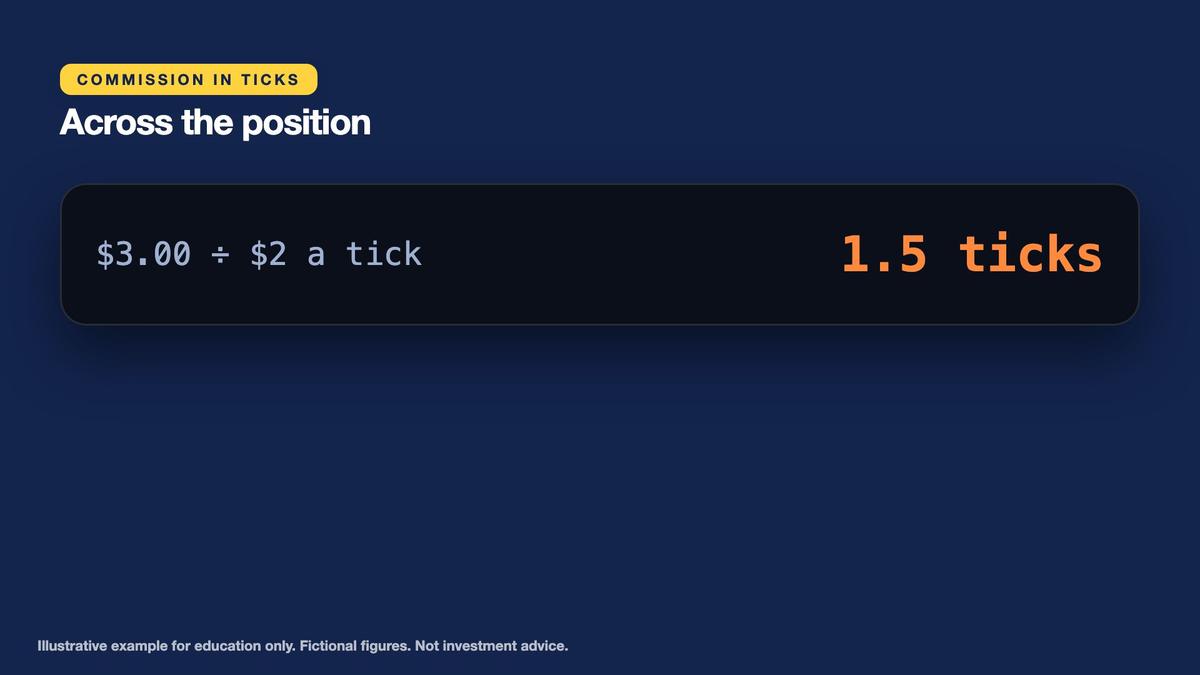
Commission is $0.75 per contract on each side. Buying two contracts costs $1.50 in entry commission, while closing both through a standard sale costs another $1.50. Round-trip commission is therefore $3.00. Relative to the $2.00 combined tick value, $3.00 equals 1.5 ticks across the position. This is a fee-equivalent comparison, not an alteration of the contract's actual tick size. Later scenario calculations will use the executed ask for entry and executed bid for exit, so the bid-ask spread is already represented in gross profit or loss. The separate $3 commission must be deducted once, not confused with or added to an already included spread component.
Size Whole Contracts From the Written Risk Budget
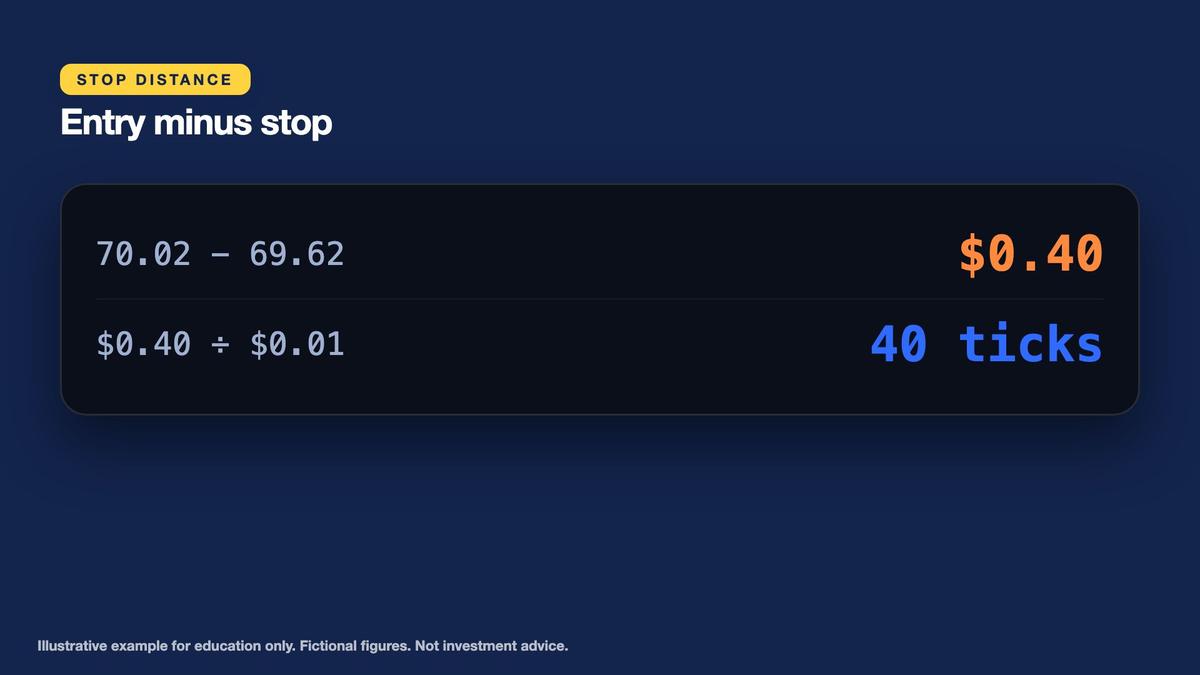
The simulated account begins with $10,000 equity and a written risk-per-trade limit of 1%, allowing an initial planned loss of $100. The long entry is $70.02, and the intended stop exit is $69.62. Subtracting gives a $0.40 adverse distance, equal to 40 ticks. Because each micro contract changes $1.00 per tick, the planned stop-price loss is $40.00 per contract before transaction fees. The full round-trip commission is $1.50 per contract, so the commission-inclusive planned loss becomes $41.50 per contract. This is the per-contract figure used for position sizing. The model assumes exact stop execution and no other costs.
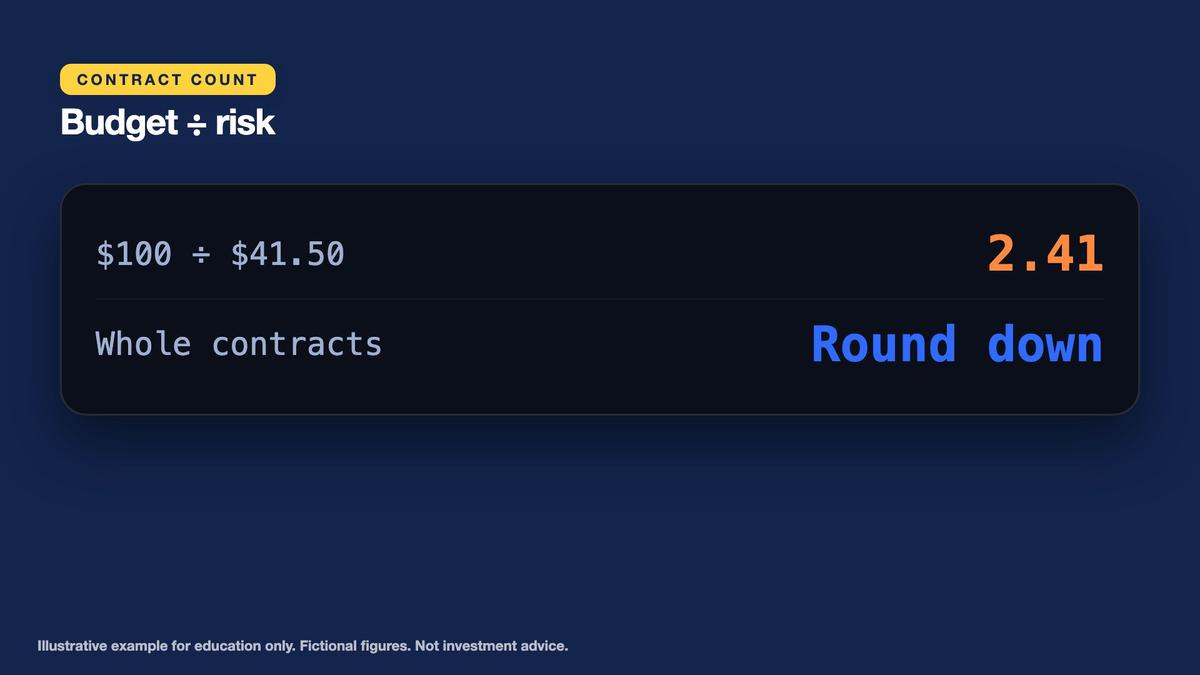
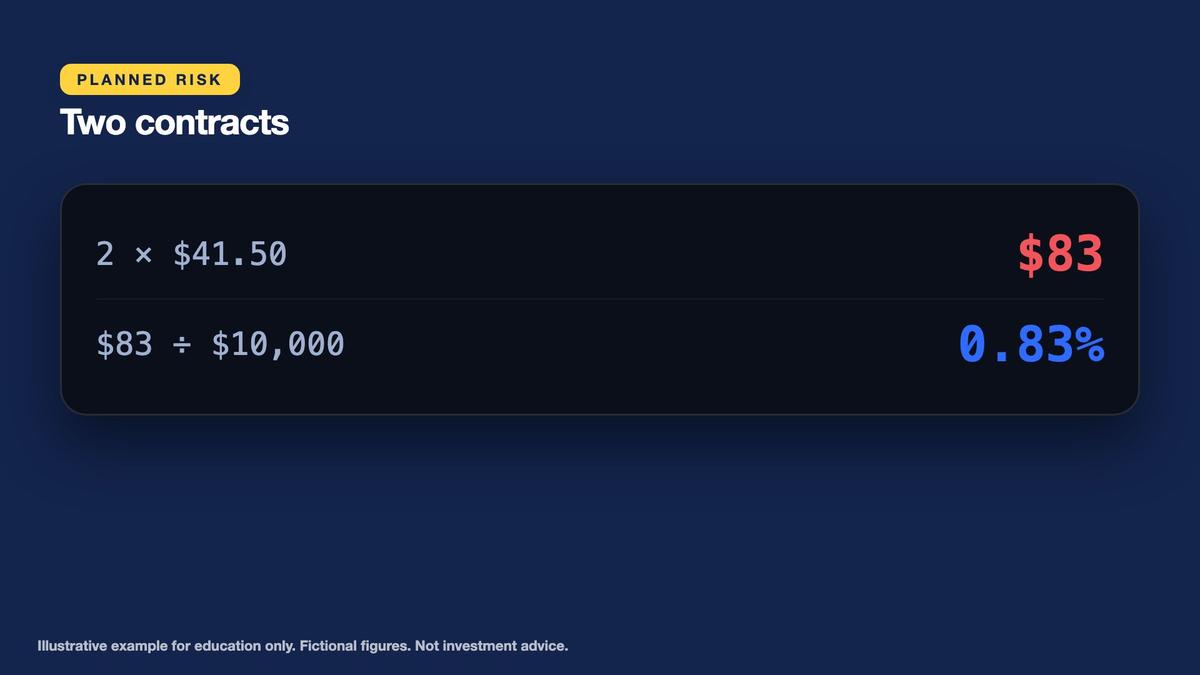
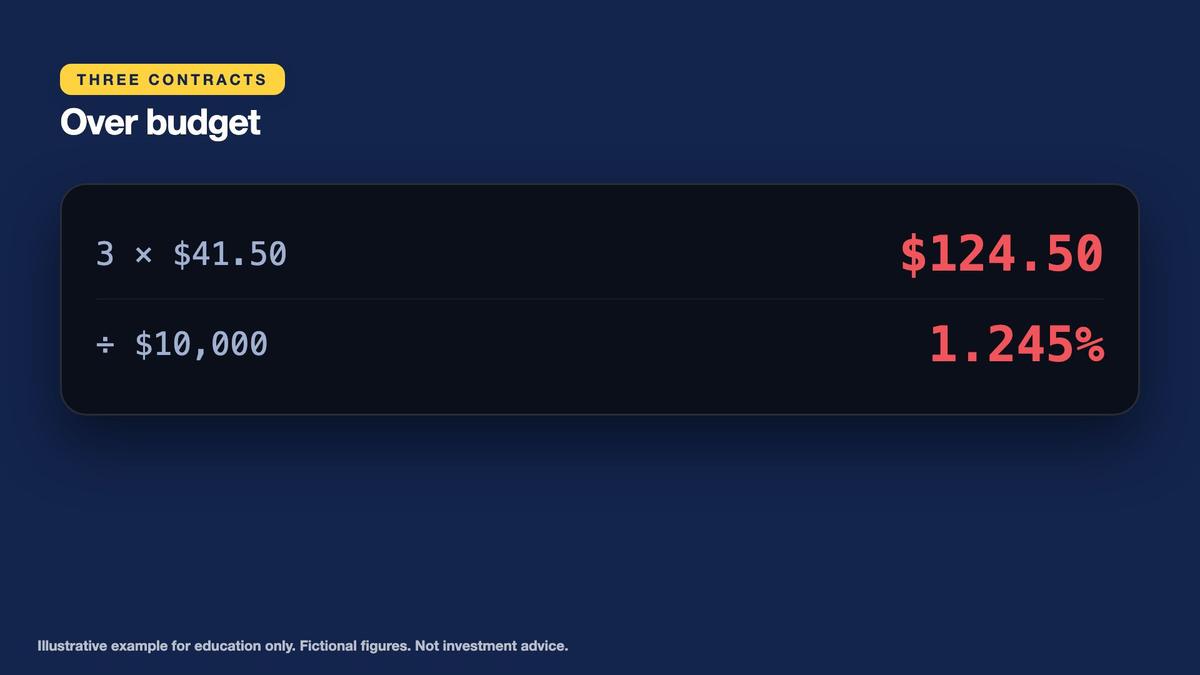
Divide the $100 risk budget by $41.50. The theoretical result is approximately 2.40963855 contracts. Futures contracts in this example are traded in whole units, so the quantity must be rounded down to two contracts. Two contracts carry $80 of stop-price risk and $3.00 round-trip commission, totaling $83.00, or 0.83% of the $10,000 account. Three contracts would carry $120 of stop-price loss plus $4.50 commission, totaling $124.50, or 1.245% of equity. That exceeds the $100 policy. Being able to submit an additional contract does not make it compliant with the written risk budget.
Key points
- Budget: 1% x $10,000 = $100. Stop distance: 70.02 - 69.62 = $0.40 = 40 ticks.
- Risk per contract: 40 x $1 + $1.50 commission = $41.50. Count: 100 / 41.50 = 2.41, rounded down to 2.
- Planned risk 2 x 41.50 = $83 (0.83%). Three contracts: $124.50 (1.245%), over budget.
The target is a separate exit bid of $70.82, which is $0.80 above the $70.02 entry, or 80 ticks. The stop lies 40 ticks below entry, so the gross planned reward-to-price-risk ratio is 80 divided by 40, or 2:1. That is a relationship between hypothetical distances, not a probability-adjusted expected return or promised result. Execution uncertainty can alter realized losses. A stop might fill beyond the intended quotation, and commissions can change the net reward-to-loss ratio. The learner should record the exact risk formula, theoretical contract count, rounded-down quantity, planned stop and target in the journal before calculating the scenarios.
Calculate Notional, Initial Margin and Maintenance Margin
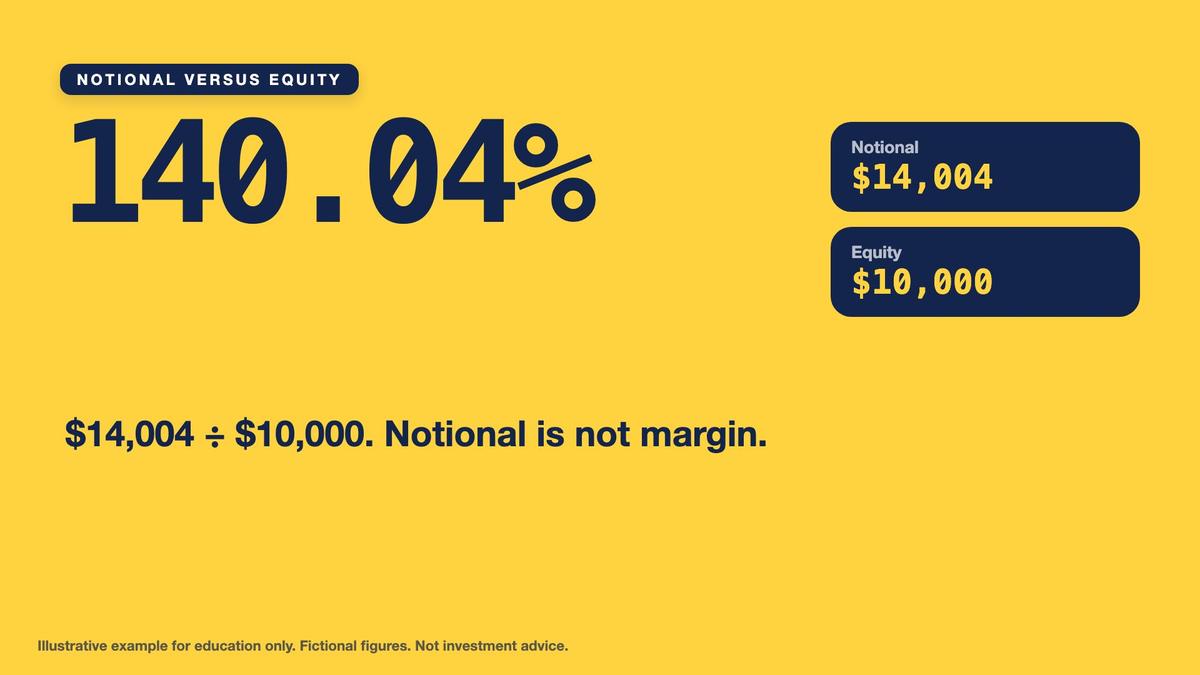
The chosen two contracts represent 200 barrels. At the fictional $70.02 entry ask, notional exposure is 200 multiplied by $70.02, or $14,004. This is 140.04% of the $10,000 account equity. Notional measures the underlying price exposure; it is not the amount of cash paid to purchase 200 physical barrels through this futures transaction. The position's price sensitivity still follows all 200 barrels. A $0.01 tick changes the two-contract position by $2, while a $1.00-per-barrel movement changes its gross P&L by $200. Margin availability and notional exposure are therefore separate measurements.
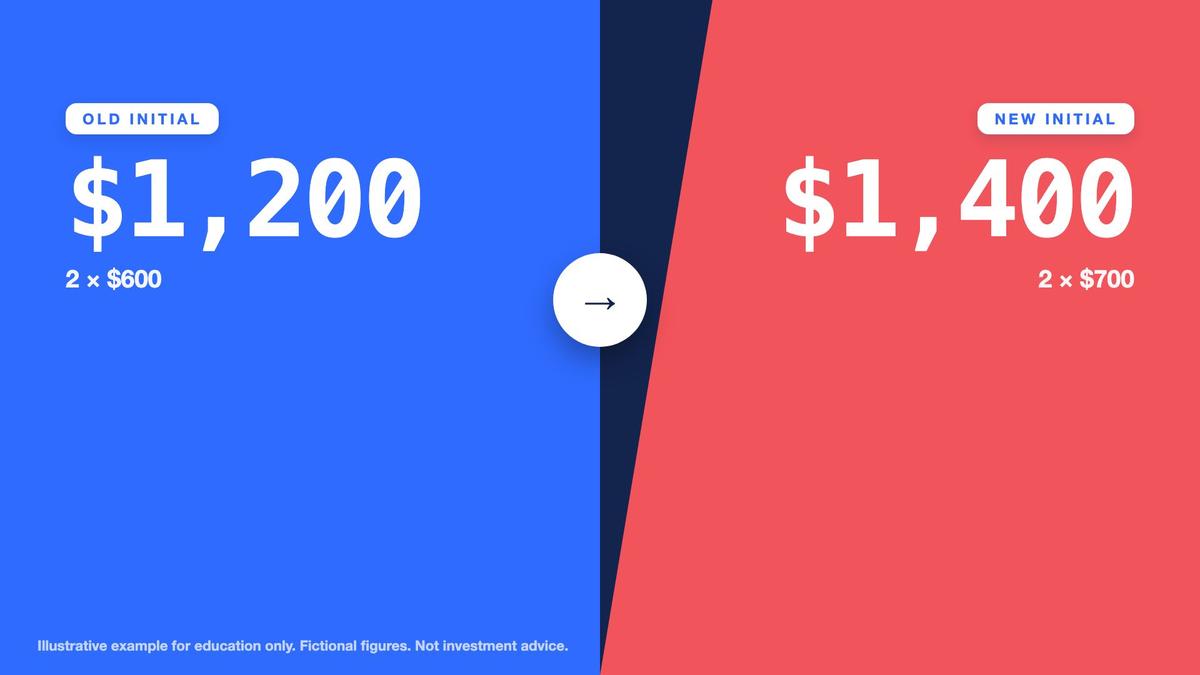
Using the original April 1 initial margin of $600 per contract, two contracts would require $1,200, or 12% of the account. But the April 15 fictional margin notice raises initial margin to $700 per contract. The correct April 20 opening requirement is two multiplied by $700, or $1,400, equal to 14% of starting equity. Subtracting that collateral requirement from $10,000 gives $8,600 of simplified funds remaining before commissions, price changes and other obligations. This subtraction is an educational margin availability calculation; margin is collateral rather than an expense that has permanently left the account.
Key points
- Notional = 200 x $70.02 = $14,004, or 140.04% of equity; notional is not margin.
- Initial margin for two contracts: $1,200 (12%) on the old sheet, $1,400 (14%) after the notice; free funds $8,600.
- Maintenance: 2 x $630 = $1,260. It is a margin level, not a stop-loss.
The original maintenance margin was $540 per contract, but the updated notice sets it at $630. Across two contracts, the current maintenance requirement is $1,260. Initial margin concerns the collateral required to establish the position, while maintenance margin identifies a continuing threshold subject to applicable account rules. Falling below a maintenance requirement can trigger a demand for additional collateral or other broker or clearing action, depending on the governing terms. It is not equivalent to an order-level stop-loss and should not be treated as a guaranteed maximum loss. The learner's journal must show both original and revised amounts, identify the effective version and retain the $1,260 maintenance figure separately from the $1,400 initial requirement.
Reconcile Target, Exact Stop and Slipped Stop
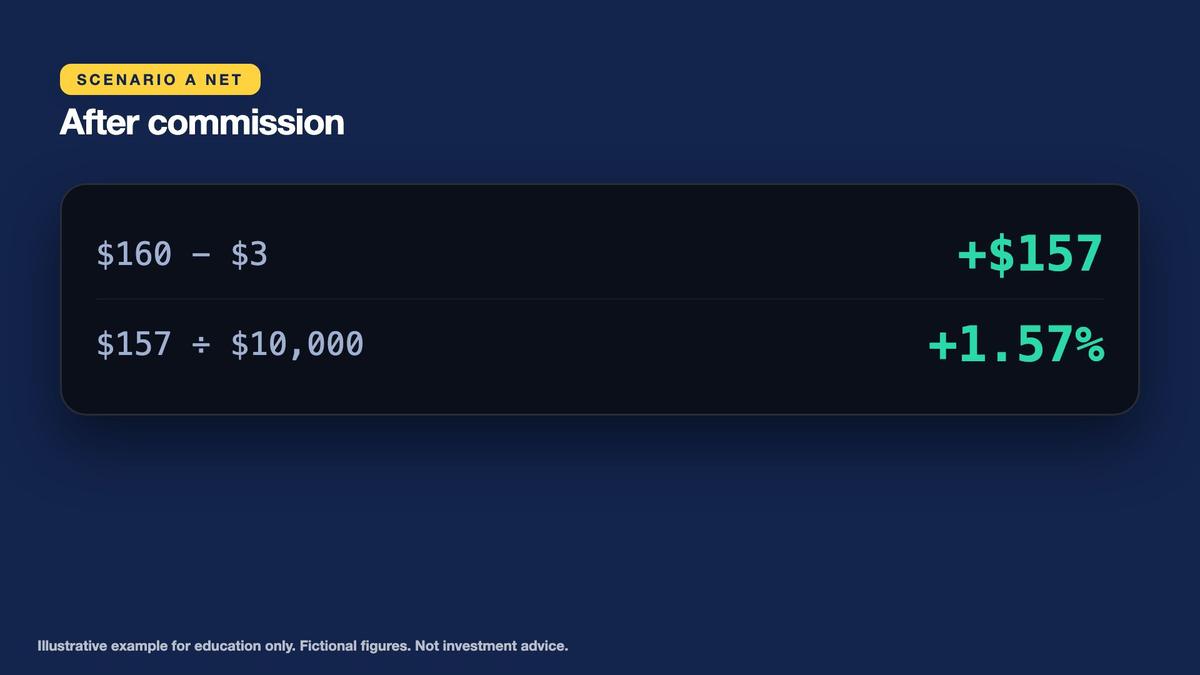
Scenario A assumes that both simulated contracts enter at $70.02 and later close at a target bid of $70.82. The favorable change is $0.80 per barrel, or 80 ticks. Across 200 barrels, gross profit equals $0.80 multiplied by 200, or $160.00. The position incurs $1.50 entry commission and $1.50 exit commission, totaling $3.00. Net profit is therefore $160.00 minus $3.00, or $157.00. Relative to $10,000 starting equity, the result is positive 1.57%. No financing, taxes or other fees are included in the invented example. The stipulated target is an assumed complete fill, not a predicted market outcome.
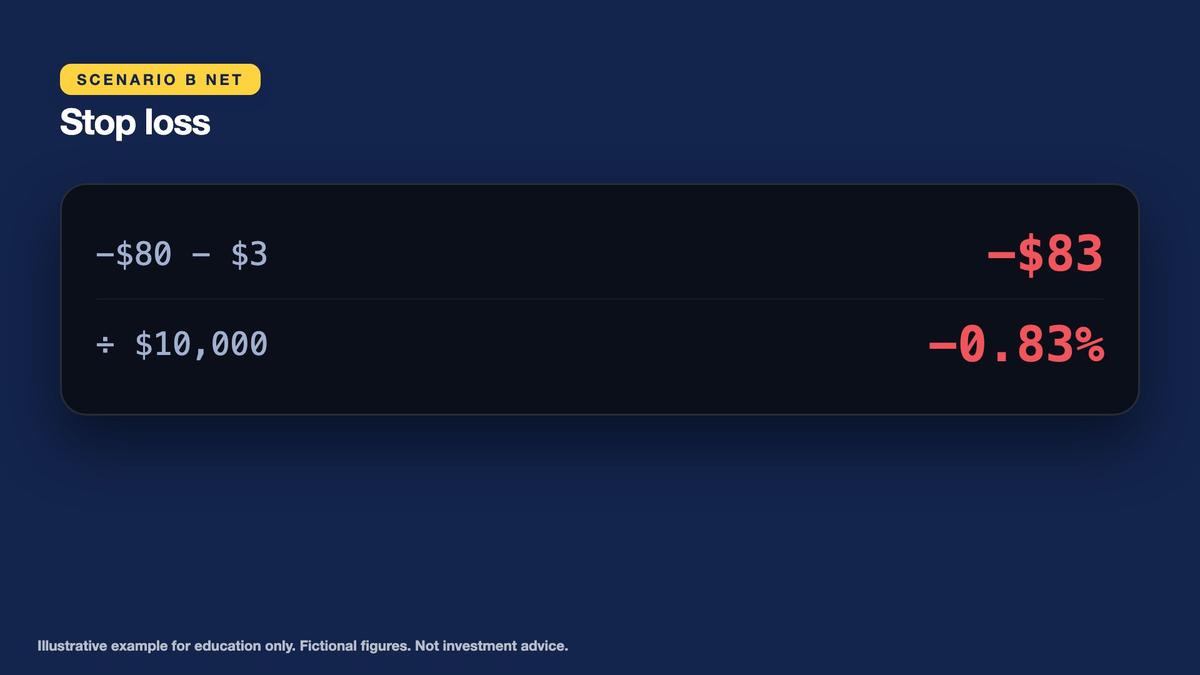
Scenario B assumes the stop executes exactly at the planned $69.62 bid. The adverse movement from $70.02 is $0.40, equal to 40 ticks. At $2.00 per combined tick, the two-contract position loses $80.00 gross. Deducting $3.00 commission produces a net loss of $83.00, or 0.83% of starting equity. This matches the planned risk calculated during position sizing because the assumed stop execution and commission terms have not changed. The gross reward-to-price-risk comparison is $160 against $80, or 2:1. After explicit commission, the hypothetical net reward divided by exact-stop net loss is $157 divided by $83, or approximately 1.89.
Key points
- Round-trip commission: 2 contracts x 2 sides x $0.75 = $3.00, or 1.5 ticks. Do not subtract the spread twice.
- A: exit $70.82 (80 ticks): $160 - $3 = +$157 (+1.57%). B: stop $69.62: -$80 - $3 = -$83 (-0.83%).
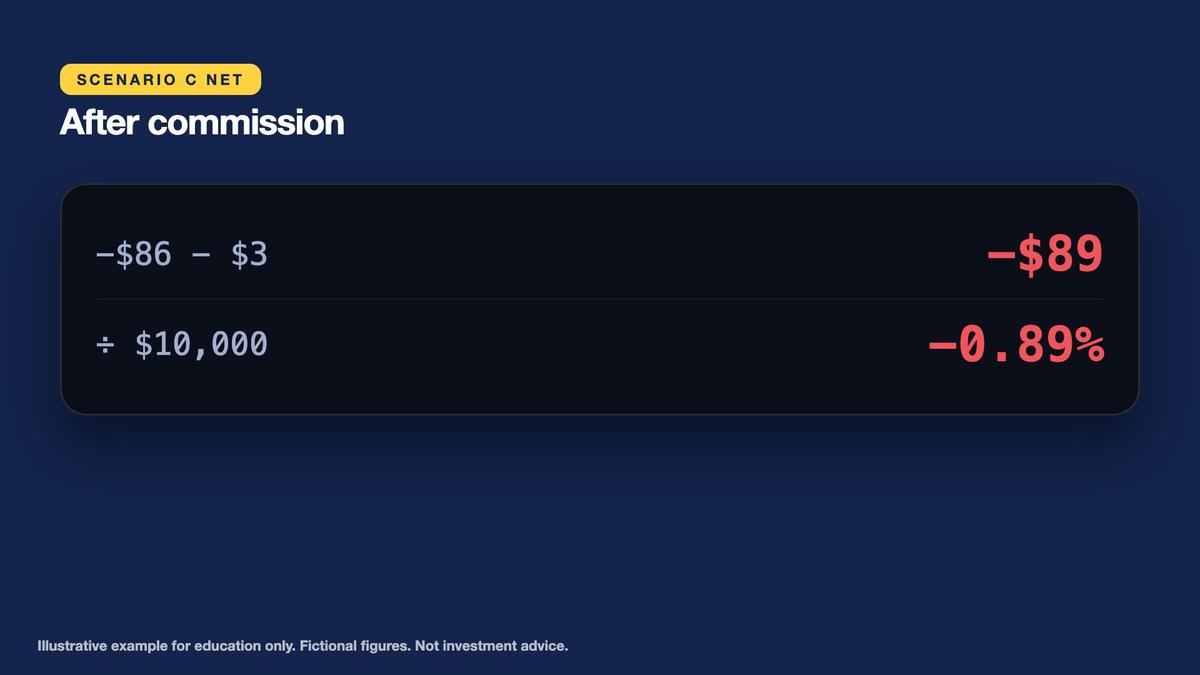
- C: slips 3 ticks to $69.59: -$86 - $3 = -$89 (-0.89%).
Scenario C assumes that the stop order suffers three ticks of adverse slippage, executing at $69.59 rather than $69.62. The actual difference from entry becomes $0.43 per barrel, or 43 ticks. With a $2.00 combined tick value, gross loss is $86.00. Subtracting $3.00 round-trip commission gives a net loss of $89.00, or 0.89% of the account. Compared with scenario B, the additional slippage costs three ticks multiplied by $2.00, or $6.00. This example remains within the $100 policy under its stated assumptions, but greater slippage, gaps or different charges could exceed the planned budget. No stop execution price is guaranteed.
Count Down to Expiry and Understand Settlement
Return to the dated contract specification. The fictional Sample Micro Oil product has a last trading day of Tuesday, May 19, 2026. The sample trade date is Monday, April 20, 2026. The difference between those dates is 29 calendar days. On Tuesday, May 12, seven calendar days remain until the last trading day. Record both checkpoints in the worksheet. Calendar days differ from trading sessions, so do not reinterpret the 29-day period as 29 available trading days. The classroom exercise specifies the last trading day directly, but a real product can also have exchange holidays, earlier cutoffs or settlement timing that must be verified.

The fictional micro contract uses cash settlement against a final reference price. This means the final financial adjustment depends on that reference rather than on the customer receiving or delivering physical barrels. Cash settlement does not mean there is no expiry risk. The position can still gain or lose from price changes until settlement, and collateral requirements remain relevant. Physical delivery contracts present different responsibilities, including procedures for delivering or receiving the underlying commodity. A learner must never assume that the settlement rules for one product automatically apply to another contract carrying a similar oil benchmark name.
Key points
- April 20 to May 19 is 29 calendar days; on May 12 only 7 days remain.
- Cash settlement still produces a final price and a profit or loss.
- For physically delivered contracts, avoid delivery by exiting or rolling before the deadlines; never assume another product settles in cash.
A trader who does not intend to maintain exposure through expiry must decide whether and when to exit or roll according to the product's current rules. The decision should be documented in advance rather than postponed until the final session. Near-expiry liquidity may change, spreads can widen and brokers can impose their own position cutoffs. A roll replaces one contract month with a later one, while a final settlement ends the expiring contract according to its specification. These routes are different alternatives, and their P&L must be analyzed independently. The seven-day reminder on May 12 is a classroom checkpoint, not a universally safe deadline for every real futures product.
Compare the Fictional Roll With Cash Settlement
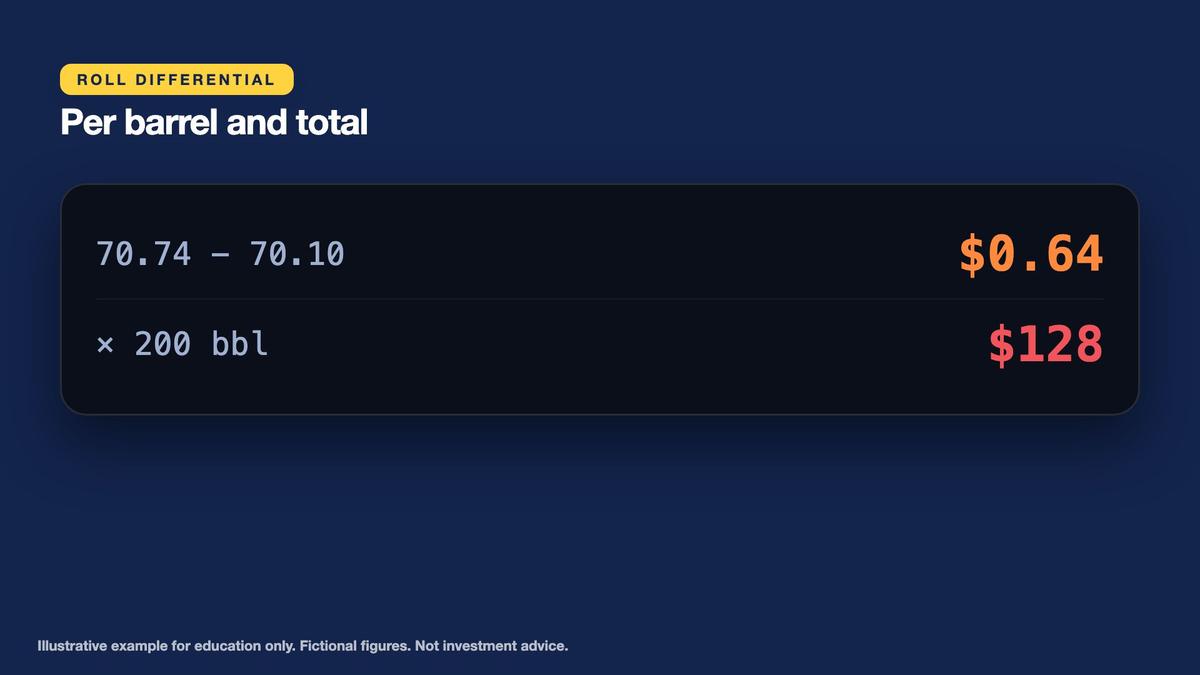
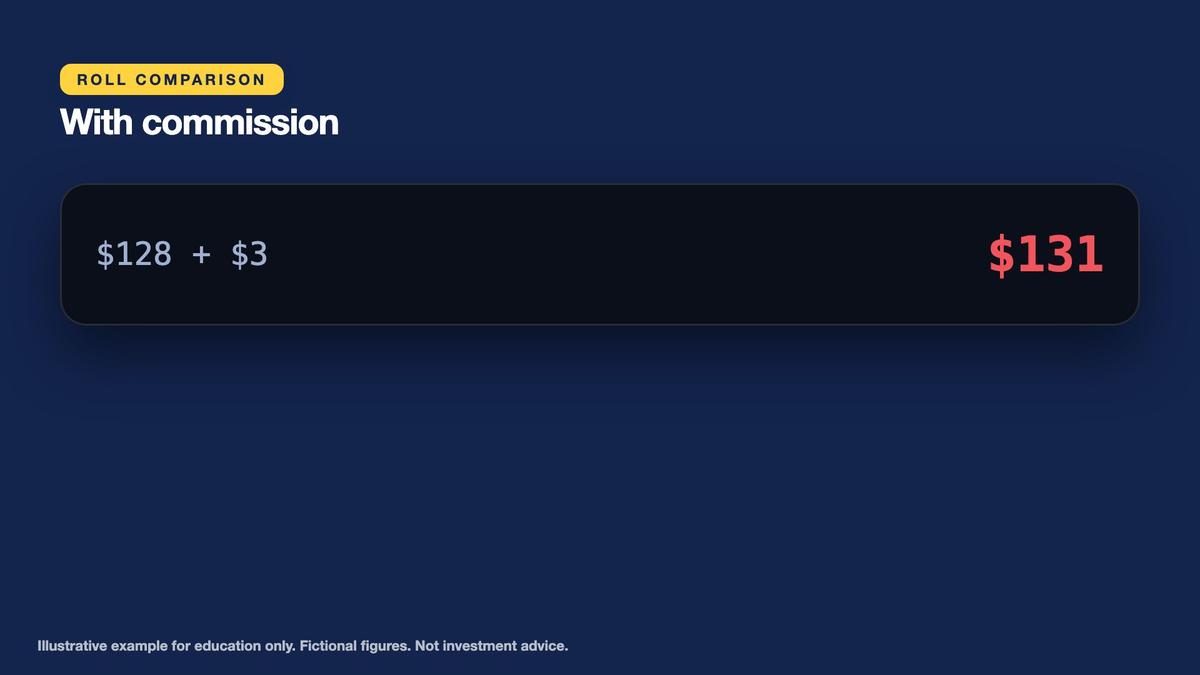
In the separate roll example, the learner holds two long contracts in an expiring fictional June contract month and replaces them with two contracts in the following month. The expiring contract is sold at the $70.10 bid, and the next-month contract is bought at the $70.74 ask. The price difference is $0.64 per barrel. Across 100 barrels per contract and two contracts, the executed differential equals $0.64 multiplied by 200, or $128.00. Each of the four contract-leg executions incurs $0.75 commission: two contracts sold and two contracts purchased. Total roll commission is $3.00, producing a specified price-differential-plus-commission comparison of $131.00.
Interpret the $131 comparison carefully. The $128 difference comes from exchanging exposure in one maturity for exposure in another maturity at different quotations. Futures are contracts whose values change with their own market prices, so replacing one contract month with a higher-priced later month does not automatically create an immediate $128 realized loss. The $3 commission is a separately charged transaction expense. The subsequent performance of the replacement contract depends on how its price changes and converges toward its settlement reference. The preceding lesson explained this distinction between roll price differences, transaction friction and futures return. Do not combine the $131 roll comparison with the expiry scenario as though both occurred in the same completed trade.
Key points
- Roll: sell June at the $70.10 bid, buy the next month at the $70.74 ask: $0.64 x 200 = $128, plus $3.00 commission = $131.
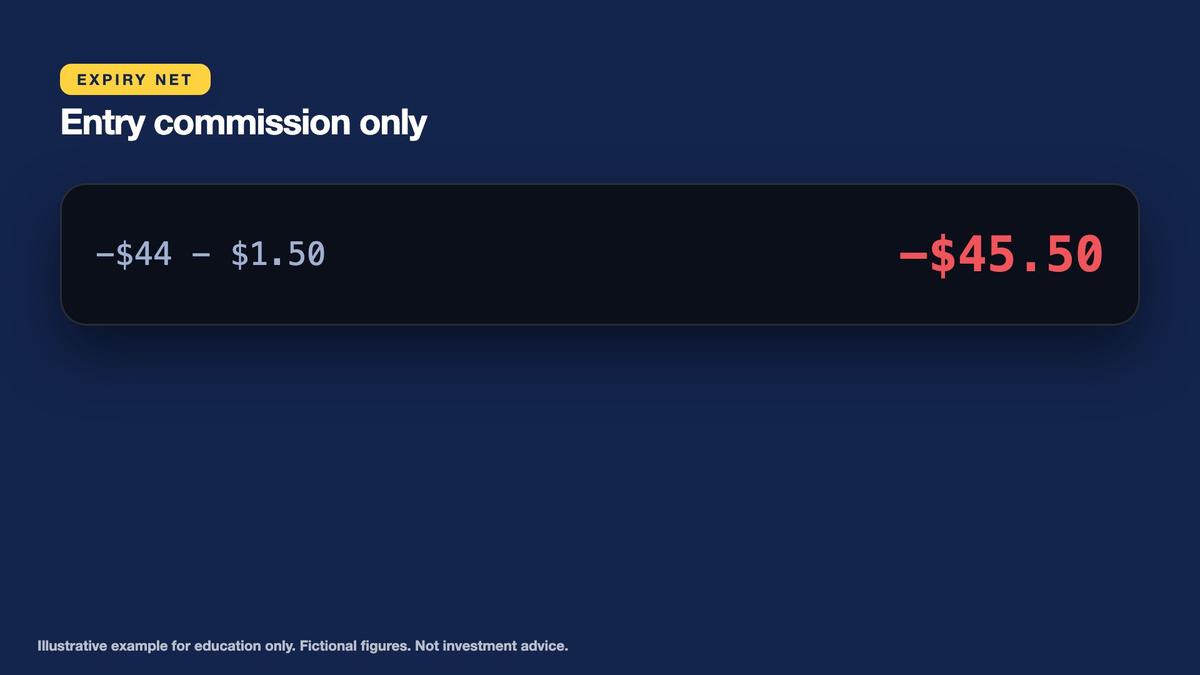
- Settlement alternative: 69.80 against 70.02 is -$0.22 x 200 = -$44, minus $1.50 entry commission = -$45.50 (-0.455%).
- These are separate scenarios; never add them together. The roll gap is not an instant realized loss.
Instead of rolling, consider holding the original two-contract long until the fictional last trading day, with cash settlement at $69.80 per barrel. Relative to the $70.02 entry, the price difference is negative $0.22 per barrel. Multiplying by 200 barrels gives a $44.00 gross loss. Under the explicitly stated assumption that the position pays the $1.50 entry commission but no additional exit commission at cash settlement, net P&L is negative $45.50. Dividing by $10,000 starting equity gives negative 0.455%. This separate scenario shows that cash settlement still produces price-based profit or loss, even though no physical barrels are transferred.
Complete the One-Page Micro Oil Demo Journal
The final laboratory sheet begins with document control. Record the fictional April 1 specification, April 15 margin notice, April 20 simulated trading date and May 19 last trading day. Identify the product as cash settled, 100 barrels per contract, with a $0.01 price tick and $1 tick value. Confirm that the fictional standard contract would have a $10 tick value but is not the product used here. Record the $70.00 bid, $70.02 ask, two-tick spread, $10,000 account equity, $100 risk budget, $70.02 entry, $69.62 stop and $70.82 target. Keep the document versions together so the margin calculation can be audited.
Hands-On Lab: Verify a Dated Micro Oil Specification and Reconcile the Demo Trade
Use only the entirely fictional Sample Micro Oil futures contract and a paper or isolated simulated platform. Begin by recording the fictional April 1, 2026 specification, April 15 margin notice, April 20 simulated trading date and May 19 last trading day. Record 100 barrels per micro contract, $0.01 price tick, $1 tick value, cash settlement, original initial and maintenance margins of $600 and $540, updated margins of $700 and $630, and $0.75 commission per contract per side. Capture the fictional $70.00 bid and $70.02 ask, calculate the two-tick spread, and open a simulated two-contract long at the ask. Apply the $10,000 account and 1% risk policy, calculate a valid whole-contract position from the 40-tick stop and commission, then verify notional and updated margin. Separately calculate the target at $70.82, exact stop at $69.62 and three-tick slipped stop at $69.59. Count calendar days to expiry, compare the hypothetical $131 roll-price-differential-plus-commission scenario against the alternative $69.80 cash settlement, and document all results in a dated one-page journal. Never connect to a real exchange or place an actual trade.
- Decision 1: A fictional April 1, 2026 specification defines Sample Micro Oil futures as 100 barrels per contract with a $0.01 price tick, $600 initial margin, $540 maintenance margin and $0.75 commission per contract per side. An April 15 notice changes initial margin to $700 and maintenance to $630. — Calculate micro tick value, standard 1,000-barrel tick value, and identify which margin figures apply to the April 20 simulated trade.
- Decision 2: The fictional account has $10,000 equity and permits 1% planned loss per trade. Entry is $70.02, intended stop exit is $69.62, and completed round-trip commission is $1.50 per contract. — Calculate dollar risk budget, theoretical whole-contract count, valid position, planned loss, notional and updated margin requirement.
- Decision 3: Two fictional micro oil contracts enter at $70.02 with a $3.00 total round-trip commission. Alternative exit bids are $70.82 for target, $69.62 for exact stop, and $69.59 after three ticks of adverse slippage. — Calculate gross and net P&L for all three exits, plus their percentages of the $10,000 account.
- Decision 4: From the simulated Monday, April 20, 2026 trade date, the fictional last trading day is Tuesday, May 19, 2026. A separate roll sells two expiring June contracts at $70.10 and buys two next-month contracts at $70.74, charging $0.75 per contract on each roll leg. — Calculate days to the last trading day, remaining days on May 12, executed roll differential, commission and total stated roll comparison, and explain the accounting distinction.
- Decision 5: Instead of rolling, the original two-contract long is hypothetically held through cash settlement at a fictional final reference price of $69.80. Entry was $70.02, and only the $1.50 entry commission applies under the stated settlement convention. — Calculate settlement gross and net P&L, percentage of account equity, and explain how cash settlement changes the expiry responsibilities.
Answer key
Verify the $41.50 planned risk per contract, theoretical 2.41-contract quantity and valid rounded-down two-contract position. The two-contract position represents $14,004 notional, 140.04% of equity, with updated initial margin of $1,400, maintenance margin of $1,260 and $8,600 simplified remaining funds before costs. Enter the target scenario of $160 gross and $157 net profit, exact-stop scenario of $80 gross and $83 net loss, and slipped-stop scenario of $86 gross and $89 net loss. Each uses the same $3 completed-round-trip commission. Confirm that a three-contract position would exceed the original 1% risk budget and that quoted spread effects are not charged twice.
Key points
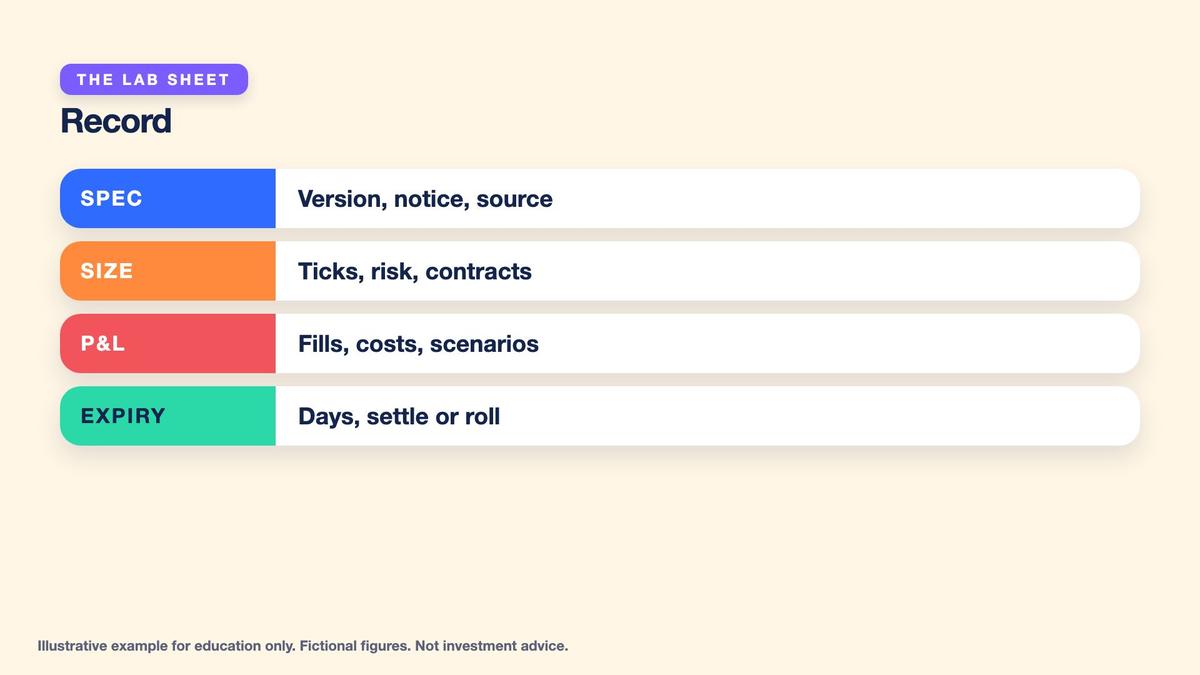
- Lab sheet: spec version and notice, units and tick, risk, size, margin, fills, costs, expiry countdown, roll or settle.
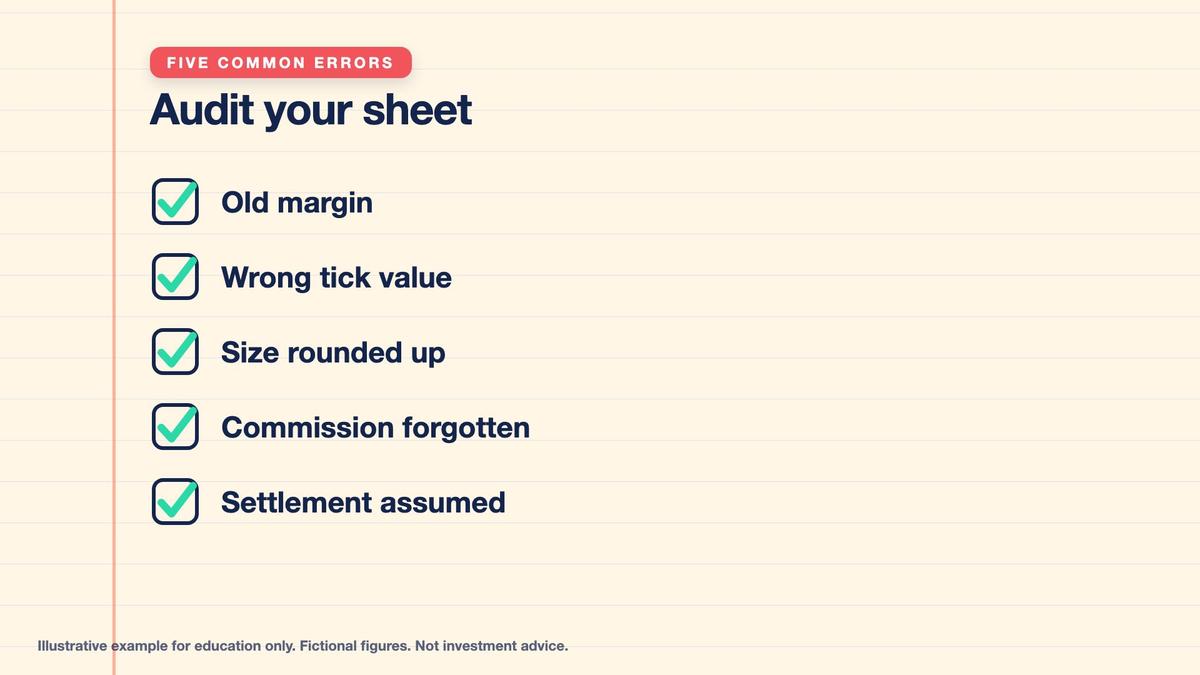
- Audit five errors: old margin, wrong tick value, size rounded up, forgotten commission, assumed settlement.
- Rehearse the steps on a demo platform with simulated money only.
Finish with the 29-day expiry countdown, seven-day May 12 checkpoint, the separate $131 roll comparison, and the separate cash-settlement loss of $45.50. Clearly distinguish the roll's maturity-price gap from immediate realized P&L and document the settlement commission assumption. Practice the workflow on paper or an isolated demo interface using invented orders only. The earlier oil market basics, futures curve and roll, XAUUSD sizing, spread and slippage, and margin and leverage lessons provide the supporting concepts. The next lesson, Trading Journal and Execution Risk, will organize simulated spread, slippage and margin risks into a consistent record. No actual order or financial transaction is required.
Worked example at a glance
Key terms
- Specification: the dated document that defines a contract: size, tick, settlement and deadlines.
- Tick: the minimum price increment of a contract.
- Tick value: the dollars one tick is worth per contract.
- Spread: the difference between ask and bid, here measured in ticks.
- Whole contracts: contracts only trade in indivisible units, so size is rounded down.
- Notional: price times quantity, the dollar size of the position.
- Initial margin: the funds required to open a position.
- Maintenance margin: the lower funds level required to keep the position open.
- Slippage: a fill worse than the intended price.
- Last trading day: the final day a contract can be traded.
- Cash settlement: final profit or loss paid in cash against a reference price, with no barrels delivered.
- Roll: closing the expiring contract and opening the next month.
Multi Asset Trading Lab provides educational information only and does not constitute personalized investment, trading, financial, legal, tax, accounting, commodities, derivatives, brokerage, exchange, clearing or risk-management advice. Sample Micro Oil futures is an entirely fictional classroom product. Its specification, dated April 1, 2026, its margin notice dated April 15, 2026, its simulated April 20, 2026 trade, its May 19, 2026 last trading day, and all quotations, fees, collateral requirements, settlement references, contract months and financial outcomes are invented teaching assumptions. The example is not an actual exchange specification or representation of a real micro oil futures instrument. No real exchange, real exchange contract code, broker, clearinghouse, fund, trading account, current oil price or real trading venue is identified or recommended. All activities use simulated money and mock or paper records only; no actual financial transaction, brokerage account, physical oil delivery, futures contract purchase or real-money order is required or encouraged. The fictional micro contract has a multiplier of 100 barrels, while the fictional larger standard contract represents 1,000 barrels. The micro contract is therefore one tenth the size of the invented standard contract. Both use dollars per barrel and a minimum quotation increment of $0.01 per barrel. One micro contract changes in gross value by $1.00 for each tick, whereas the fictional standard contract changes by $10.00 per tick. The two-contract micro position has combined sensitivity of $2.00 per tick, or $200 per $1.00-per-barrel movement. These multipliers and tick values are not universal and must never be assumed applicable to a real product without independently verifying its current official specifications. The fictional contract is cash settled against a specified sample reference, with no physical oil delivery under this classroom example. Other actual oil futures contracts may use physical delivery, cash settlement, different delivery obligations, contract months or expiry procedures. Learners must verify each real product's actual underlying quality, contract size, tick size, tick value, last trading day, first notice or delivery deadlines where applicable, settlement method, margin, commission, trading hours, position limits and related risks from its current official documents. The original April 1 fictional specification defines initial margin of $600 and maintenance margin of $540 per micro contract. The April 15 fictional notice raises initial margin to $700 and maintenance margin to $630. The simulated trade takes place April 20, so the updated figures apply. A learner using the older figures would calculate an obsolete opening collateral requirement. Real margin requirements can change without following the timing or magnitude of this fictional example, sometimes at short notice or during market stress. The trade-date calculation must distinguish the initial collateral requirement from maintenance thresholds, and neither should be treated as a maximum loss or as a substitute for a risk-per-trade policy. The invented April 20 quote is $70.00 bid and $70.02 ask. Their midpoint is $70.01, and the quoted spread is $0.02 per barrel, or two $0.01 ticks. This corresponds to $2.00 spread difference for one micro contract and $4.00 across two contracts. Gross trading profit and loss calculated from actual simulated entry asks and exit bids already incorporates the applicable execution-side prices. The same spread must not be deducted again from fill-based gross P&L as though it were a separate exchange invoice. Explicit commission is $0.75 per contract per side. For two contracts, entry commission is $1.50 and a normal two-contract closing sale incurs another $1.50, giving $3.00 round-trip commission. Relative to the combined $2.00 tick value, this fee is equivalent to 1.5 position ticks. This fee-equivalent expression does not mean that the contract permits fractional physical price ticks. The principal simulated account begins with $10,000 equity and a written 1% planned risk budget, equivalent to $100. A fictional long position buys at $70.02 with a planned stop exit at $69.62, an adverse movement of $0.40 per barrel or 40 ticks. At $1.00 per contract tick, the stop represents $40.00 gross price risk per contract. Adding $1.50 completed-round-trip commission produces $41.50 initial planned risk per contract. Dividing the $100 budget by $41.50 gives approximately 2.40963855 theoretical contracts. The example allows whole contracts only, so the valid maximum position is two contracts when rounded down. Two contracts have $80 gross stop-price risk and $3 commission, totaling $83 initial planned risk or 0.83% of starting equity. Three contracts would create $124.50 planned risk, or 1.245% of equity, exceeding the written budget. Margin eligibility does not demonstrate that a position complies with a separately defined planned-loss rule. The two-contract position represents 200 barrels. Its invented entry-price notional is 200 multiplied by $70.02, or $14,004, equivalent to 140.04% of the $10,000 starting equity. This notional is underlying price exposure rather than the cash price paid to acquire physical oil. Under the obsolete original specification, two contracts would require $1,200 initial margin, or 12% of equity. Under the April 15 notice applicable on April 20, updated initial margin equals $1,400, or 14% of equity, and maintenance margin totals $1,260. The simplified account has $8,600 remaining after accounting for required initial collateral, before commission, price changes and other obligations. This is a pedagogical funds-availability calculation and does not represent a promise that the entire amount is freely withdrawable, that collateral can never be changed, or that losses cannot exceed the deposited margin. Real futures positions are typically subject to variation margin or settlement processes, account-level risk calculations, clearinghouse rules, broker policies, sudden margin changes, liquidation requirements and possible losses greater than expected or initially deposited. The target scenario assumes two complete simulated fills: purchase at $70.02 and closing sale at $70.82. The favorable difference is $0.80 per barrel, or 80 ticks. Across 200 barrels, gross P&L equals positive $160.00, and deducting the $3.00 fictional round-trip commission produces positive $157.00 net P&L, or 1.57% of starting account equity. The planned gross reward-to-price-risk ratio compares the 80-tick target with the 40-tick stop and equals 2:1. The exact-stop scenario assumes the sale fills at $69.62 after entry at $70.02, producing a $0.40-per-barrel adverse movement, $80 gross loss and $83 net loss after commission, or 0.83% of equity. The slipped-stop scenario assumes the sale instead executes at $69.59, three ticks below the intended stop. The realized adverse movement becomes $0.43 per barrel, or 43 ticks, creating an $86 gross loss and $89 net loss after commission, or 0.89% of equity. The additional three ticks of slippage cost $6 across two contracts. These outcomes are assumptions about completed fills, not realistic predictions or guarantees of particular execution prices. Stop orders can fill at prices worse than requested, including during market gaps, volatility, liquidity shortages, trading halts, exchange disruptions or broker failures. Larger adverse moves or additional fees may produce actual losses exceeding the $100 initial planned risk budget. The fictional last trading day is Tuesday, May 19, 2026. From Monday, April 20, 2026, it is 29 calendar days away, and from Tuesday, May 12, 2026, it is seven calendar days away. These are calendar-day calculations, not counts of trading sessions. Actual futures trading calendars, exchange holidays, notice procedures, broker cutoffs and settlement schedules may be different. The fictional contract uses cash settlement rather than physical delivery. Cash settlement still requires a final reference price and determines a financial gain or loss. It does not guarantee a zero settlement amount, eliminate margin risk, or remove the importance of the last trading day. Physically delivered contracts may create additional rights, responsibilities or delivery obligations that this fictional cash-settled example does not have. Participants who do not intend to maintain expiry or delivery exposure need to understand the contract's actual closeout or rolling procedures and deadlines. The fictional roll scenario is a separate alternative from the final settlement outcome. It assumes two long expiring June contracts are closed by selling at $70.10 and replaced by buying two later-month contracts at $70.74. The price differential equals $0.64 per barrel, or $128 across 200 barrels. Four contract-leg executions, comprising two contracts on each of two legs, incur $0.75 each, totaling $3 commission. The stipulated roll-price-differential-plus-commission comparison is therefore $131. This figure must not be misrepresented as an automatic immediate realized $131 futures trading loss. The $128 price gap reflects replacing one maturity's exposure with another at different prices. Future P&L depends on the price movement and convergence of the replacement contract, while commissions are separately charged and actual execution friction depends on the available quotations. The fictional example does not specify additional roll-leg midpoint references, so it does not separately quantify spread slippage beyond the stated executable bid and ask. The earlier futures curve lesson's distinction between a calendar price gap, execution friction, fees and roll yield remains applicable. The separate cash-settlement scenario assumes both original contracts are held until final financial settlement at a fictional $69.80 reference. Relative to the $70.02 entry, the price difference is negative $0.22 per barrel, producing negative $44 gross P&L across 200 barrels. Under the specific assumption that the learner pays the $1.50 entry commission and is not charged an additional exit commission at cash settlement, net P&L is negative $45.50, equivalent to negative 0.455% of the $10,000 account. This settlement convention is invented solely for the exercise. Actual clearing, brokerage and settlement fees can differ, and real futures are often subject to daily settlement and variation-margin processes rather than realizing all price changes only at the final expiry. The target, exact stop, slipped stop, roll and cash-settlement examples are independent hypothetical scenarios; they must not be combined into a single realized transaction history or added together as cumulative outcomes. The completed laboratory journal should record the fictional specification source, version date, later notice and effective margin amounts, trade date, account currency, barrels per contract, minimum tick, tick value, bid, ask, spread, entry price, stop, target, risk budget, valid whole-contract count, planned loss, notional, initial margin, maintenance margin, commissions, actual or assumed fills, slippage, gross P&L, net P&L, last trading day, calendar days remaining, settlement method and alternative roll or settlement decisions. Common errors include relying on a superseded margin requirement, confusing a 100-barrel micro contract with a 1,000-barrel standard contract, using the wrong tick value, rounding a position upward despite exceeding the risk budget, omitting commission, double-counting spread friction, misunderstanding the effect of margin, treating a futures maturity-price gap as an immediate cash loss, and ignoring expiry obligations. Earlier lessons on oil market basics, futures curve and roll, XAUUSD sizing, spread and slippage, and margin and leverage provide related concepts but do not guarantee safe or profitable trading. No illustrative price, target, stop, contract quantity, profit, loss, margin requirement, settlement result, roll calculation or expiry date in this lesson predicts actual market conditions or future returns. The next lesson on Trading Journal and Execution Risk is an educational continuation focused on documenting simulated spread, slippage and margin risks. Nothing in this lesson recommends buying, selling, rolling, holding, borrowing against or trading any actual oil contract, future, option, CFD, security, commodity or other financial instrument. All figures and exercises are fictional, simulated and strictly educational.
Lesson Checkpoint
Review what you learned and get feedback on your work.