



In this fifteen-minute beginner lesson, learners investigate why a fictional oil futures product can produce returns different from the underlying spot oil price. Using one consistent simulated oil market with a $70.00 per-barrel spot reference and a fictional 1,000-barrel futures contract, learners construct contango and backwardation curves, calculate monthly futures premiums and calendar spreads, and explain the intuition behind storage, financing, and cost of carry. They examine expiry, convergence, last trading days, settlement methods, and physical delivery risk before working through a two-leg futures roll with bid-ask spreads and commission. The fictional roll sells an expiring contract at $70.48 and buys the next contract at $71.22, creating a $0.74-per-barrel roll price differential and $744 in specified price differential plus transaction charges. A separate simplified Sample Oil Fund illustration shows how repeated convergence from a $0.50 futures premium can produce a 2.14% loss over three months when spot remains unchanged, or a 0.857% gain when spot rises 3.00%. A hypothetical backwardated market demonstrates the opposite directional effect. Learners distinguish roll price differences, realized execution costs, roll yield, and total product return, then complete a one-page curve and expiry checklist. All prices, products, contracts, curves, and scenarios are fictional, use simulated money only, and are not investment advice or price predictions.
Understand Spot Prices, Futures Months and the Term Structure
Start with a fictional cash market reference of $70.00 per barrel of oil and a fictional futures contract representing 1,000 barrels. That contract multiplier means every $1.00-per-barrel movement changes gross contractual value by $1,000 before trading costs. Spot is the reference for oil in the current cash market, while a futures contract references a defined later settlement or delivery period. Those two prices do not have to match before expiry. The distinction matters whenever someone evaluates a product described as providing oil exposure. Owning a futures-based product is not necessarily the same economic experience as owning physical oil at its spot price.


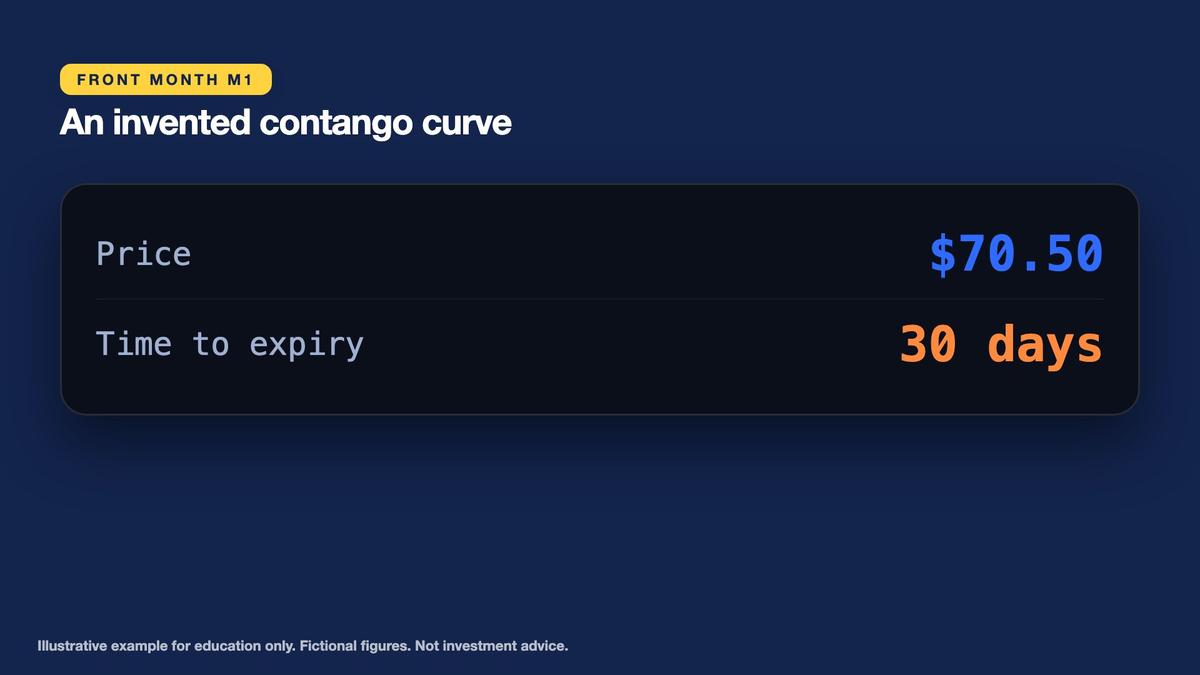
Our invented term structure contains four contract months. M1 expires in 30 days and trades at $70.50. M2 expires in 60 days and trades at $71.20. M3 expires in 90 days and trades at $71.80. M4 expires in 120 days and trades at $72.30. Plot contract maturity horizontally and price vertically. The prices climb as the months become more distant. This ascending pattern is called contango. It describes the relationship between contract prices observed at the same sample moment. It does not establish which direction oil prices will move afterward.

Key points
- Fictional spot $70.00 and a 1,000-barrel contract: every $1.00 move is $1,000 of contractual value.
- Contango curve: M1 $70.50 (30 days), M2 $71.20 (60), M3 $71.80 (90), M4 $72.30 (120).
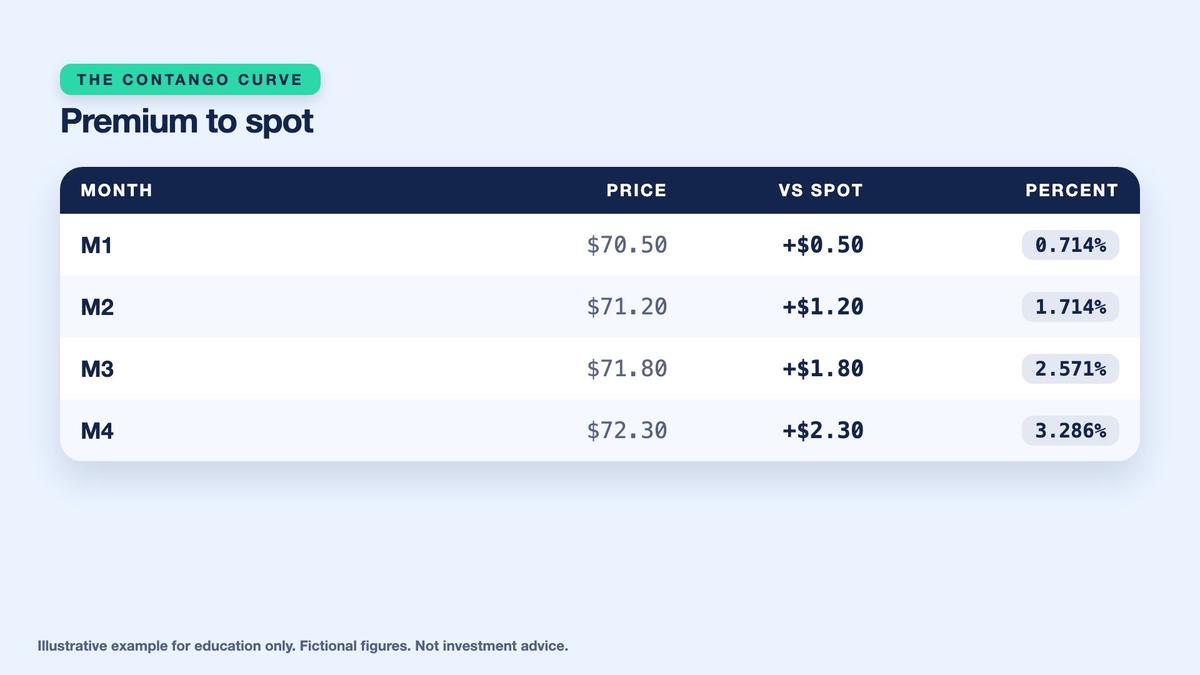
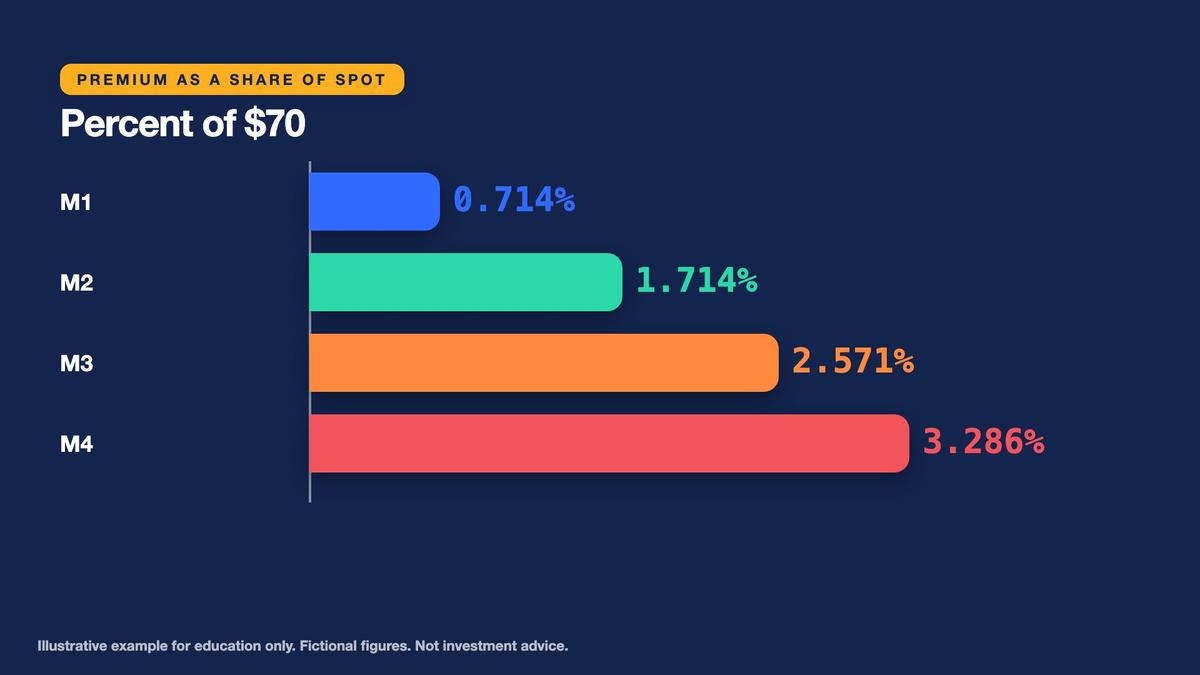
- Premiums over spot: $0.50, $1.20, $1.80, $2.30, or 0.714%, 1.714%, 2.571%, 3.286%.
Compare each fictional futures quotation against the $70.00 spot reference. M1 stands $0.50 above spot, or approximately 0.714%. M2 stands $1.20 above, or 1.714%. M3 stands $1.80 above, or 2.571%, and M4 stands $2.30 above, or 3.286%. Keep the same $70 denominator when comparing these premium percentages. A premium is a current difference between two quotations, not a guaranteed future gain or cost. The futures prices will evolve independently as supply, demand, storage, delivery constraints, market expectations, and time to maturity change.
Calculate Calendar Spreads and Explain Cost of Carry
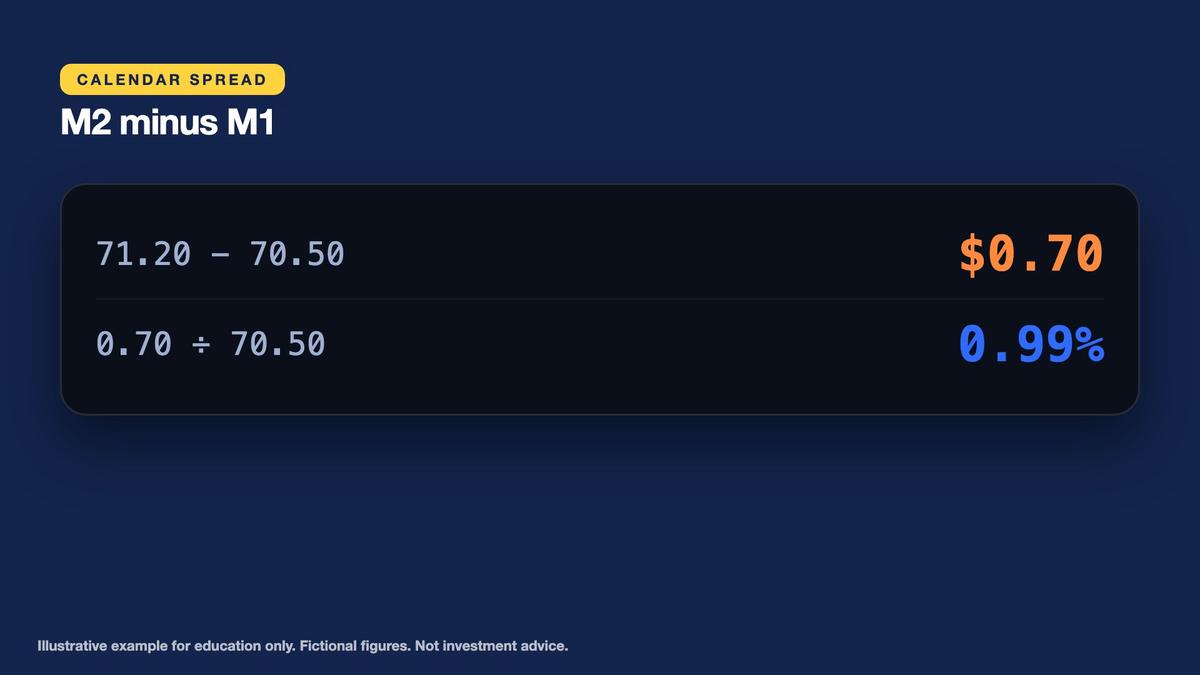
A calendar spread compares prices of two futures contract months tied to the same underlying commodity and compatible specifications. In our fictional contango curve, M2 minus M1 equals $71.20 minus $70.50, or $0.70 per barrel. Expressed against the $70.50 M1 price, the difference is approximately 0.99%. M3 minus M2 equals $0.60, and M4 minus M3 equals $0.50. The progressively smaller adjacent gaps tell us how the invented curve is shaped across the listed months. They are not transaction prices and do not establish the profit from buying or selling a spread.
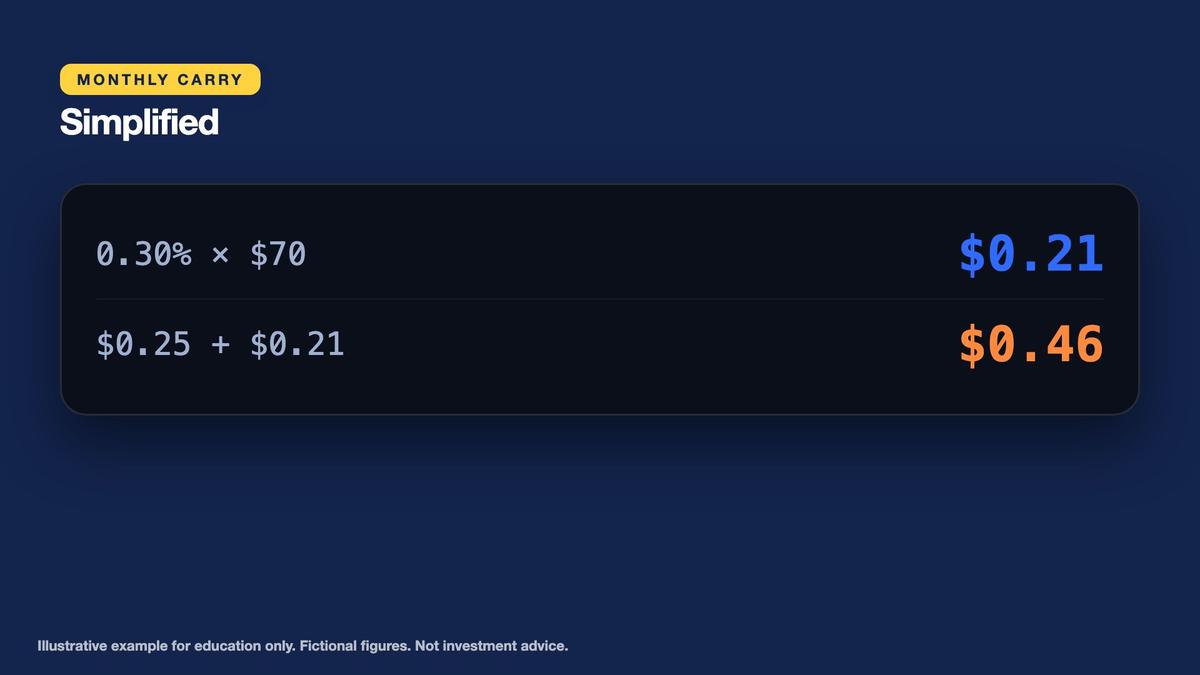
One intuition behind deferred prices exceeding spot is the cost of carrying inventory. A physical holder may need to store oil, pay for financing, insure or handle the barrels, and manage delivery logistics. Assume fictional monthly storage of $0.25 per barrel. Also assume financing of 0.30% monthly on the $70.00 spot reference. That financing calculation is $70.00 multiplied by 0.003, or $0.21 per barrel. The total simplified one-month carry is therefore $0.46 per barrel. That figure resembles the invented M1 premium of $0.50, helping explain why an oil futures price might sit above the cash reference.
Key points
- Calendar spread M2 - M1 = 71.20 - 70.50 = $0.70, or 0.70 / 70.50 = 0.99% of M1. Adjacent spreads: $0.70, $0.60, $0.50.
- Simplified monthly carry: $0.25 storage + 0.30% x $70 ($0.21) = $0.46 a barrel.
- Cost of carry is intuition, not a full pricing model: demand, seasonality and expectations also matter.
Cost of carry is only part of a futures pricing explanation. Convenience value from physically available inventory, seasonal demand, supply bottlenecks, inventories, financing terms and expectations also matter. Real futures prices are determined by market transactions and cannot be reconstructed reliably from one storage charge and one interest rate. The invented $0.46 monthly estimate is not an arbitrage guarantee or a universal formula. A learner should record how a number was calculated, identify its assumptions, and avoid converting a rough economic intuition into a precise price forecast. The calendar spread and cost-of-carry calculation describe different concepts even when their dollar values seem related.
Recognize Backwardation and the Meaning of Curve Shape
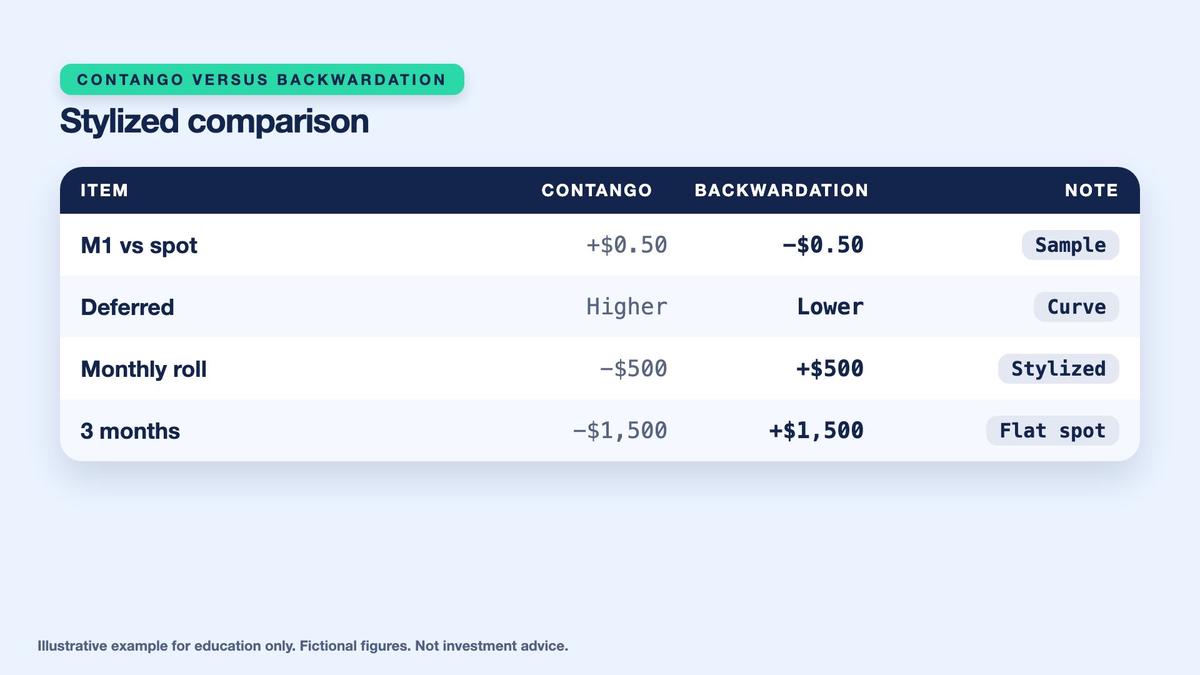
The futures curve does not always rise with maturity. In a separate fictional backwardation scenario, retain spot at $70.00 but set M1 at $69.50, M2 at $69.00 and M3 at $68.60. The near-month contract trades below spot, and later contracts trade below nearer contracts. The respective discounts to spot are $0.50, $1.00 and $1.40. This descending term structure is backwardation. It is the opposite shape from the invented contango curve, but both can occur under different market conditions or at different points in time.
Backwardation can be consistent with relatively valuable nearby supply. For example, refiners or other physical market participants may be willing to pay more for barrels available soon than for barrels delivered in later months. But curve shape reflects a broader set of market conditions, including inventories, convenience value, financing, uncertainty and expected physical availability. A downward-sloping curve does not guarantee that the next spot price will decline or that a long futures position will earn a positive return. Similarly, an upward-sloping contango curve does not guarantee that spot will rise.
Key points
- Backwardation: spot $70.00, M1 $69.50, M2 $69.00, M3 $68.60. Nearby barrels cost more than later ones.
- A curve is a set of current quotes for different months, not a forecast of future prices.
- Curve shape can change at any time.
The critical distinction is between observing a curve and predicting its evolution. The observed backwardation prices of $69.50, $69.00 and $68.60 are current hypothetical quotations for different contract months, not future realized spot prices. If the underlying physical market changes, the entire curve can shift or twist. A long position's return depends on the futures contract held and the subsequent movement in that specific contract's price. Keep the contango and backwardation alternatives separate in the worksheet rather than adding them together or treating their differences as guaranteed trading opportunities.
Read Expiry, Settlement and Convergence Before Rolling
Every actual futures contract has a defined life cycle and legally meaningful specification. Important details include the contract month, last trading day, final settlement procedure, trading hours and whether the contract settles in cash or can lead to physical delivery. Different instruments can impose different obligations. A participant who does not intend to deliver or receive physical oil must understand when and how the position needs to be closed or replaced. The fictional M1 contract has 30 days until expiry, but this simplified statement is not a substitute for the exact deadlines and settlement details in a real contract specification.
As expiry approaches, a futures contract generally tends to converge toward the relevant underlying settlement value under its contractual delivery and quality conventions. In our simplified physical-market illustration, a front-month contract at $70.50 may approach a $70.00 spot reference as the remaining premium disappears, assuming that spot stays unchanged and the contract's settlement reference is comparable. In actual markets, the convergence process is more complicated because spot quotations can use different locations or quality definitions, and the underlying cash price changes. The timing and path are not guaranteed. What matters is that a futures price contains a maturity dimension absent from a simple spot quotation.
Key points
- Read the contract: last trading day, settlement method (cash or physical), trading hours and tick value.
- Near expiry the contract converges toward the settlement value; liquidity moves to later months first.
- Physical delivery risk means a trader should close or roll before the last trading day.
Liquidity can migrate from an expiring contract to later maturities before the last trading day. A trader attempting to exit an illiquid contract near expiry may encounter wider spreads or slippage. A futures-based fund may therefore roll according to a published schedule before formal expiry, while another product may hold a combination of maturities. The learner should distinguish the expiry date from the last trading day and any earlier broker or fund-specific cutoffs. Those details determine when a roll must happen and whether delivery risk, trading restrictions or settlement obligations might apply. Reading the current official specification is essential.
Perform the Two-Leg Roll and Separate Price Difference From Cost
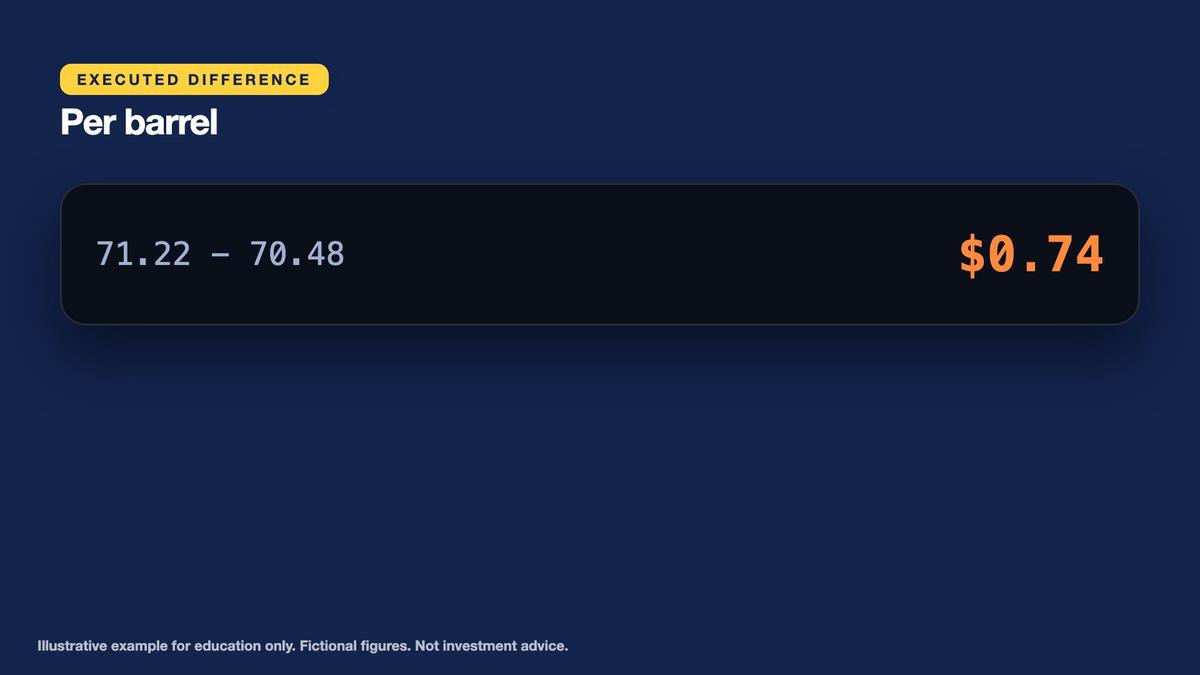
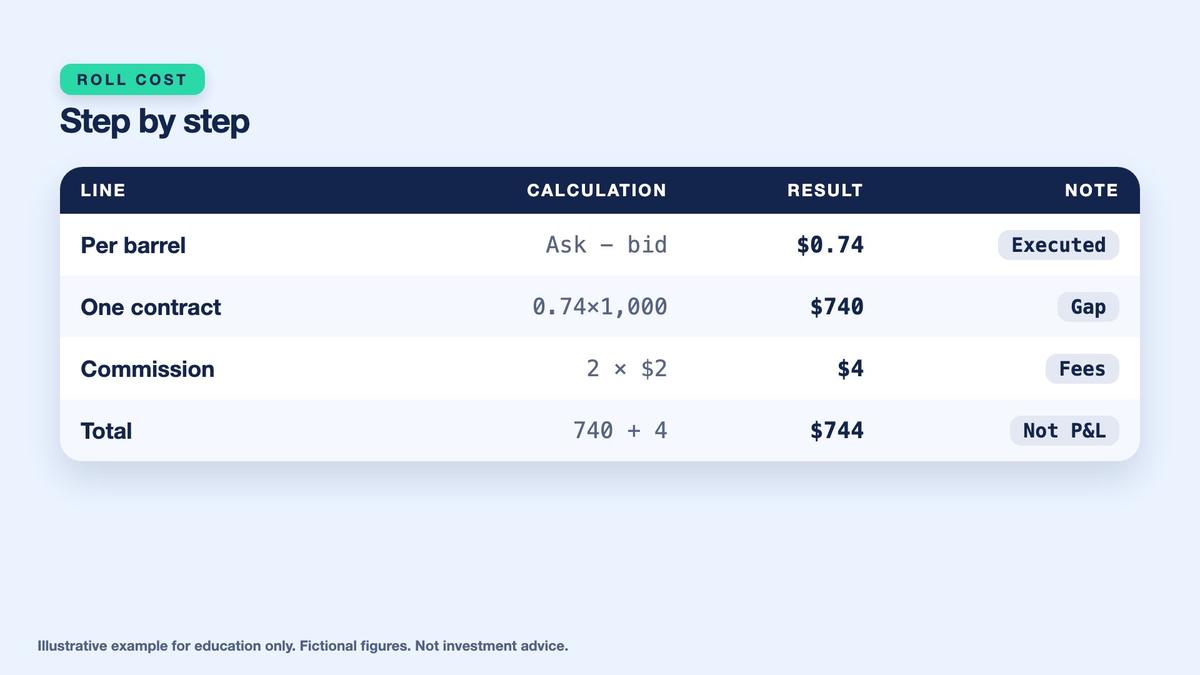
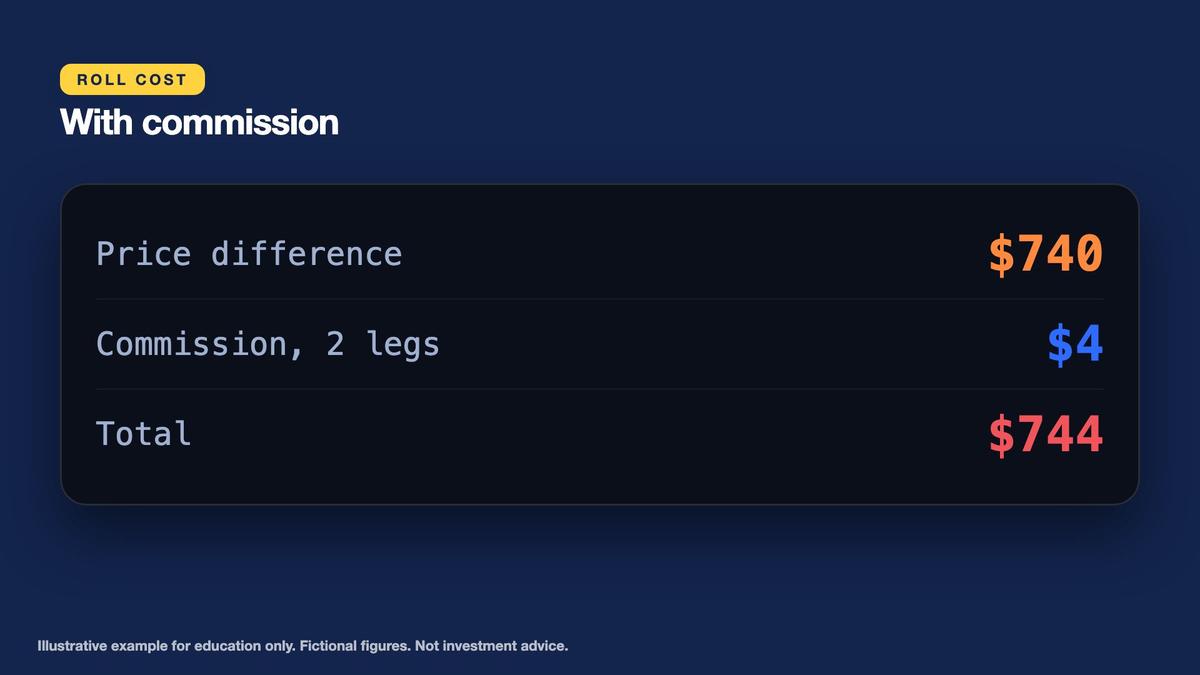
Now simulate rolling one fictional long M1 futures contract representing 1,000 barrels into M2. To close the existing long, sell M1 at its executable bid of $70.48. To establish the replacement long, buy M2 at its executable ask of $71.22. The price difference between the new purchase and old sale is $71.22 minus $70.48, or $0.74 per barrel. Across 1,000 barrels, this equals $740. Each leg also incurs $2.00 commission, so the two-leg transaction pays $4.00 in explicit commission. The specified roll price differential plus charges totals $744.
Decompose that $740 figure carefully. M1's reference midpoint is $70.50, and M2's is $71.20. Their midpoint calendar spread is $0.70 per barrel, or $700 across the contract. Selling M1 at $70.48 adds $0.02 per barrel of midpoint-referenced execution friction. Buying M2 at $71.22 adds another $0.02. Together, the two fills add $0.04 per barrel, or $40, in execution friction compared with trading at both reference midpoints. The accounting comparison is therefore $700 of contract-price difference plus $40 of execution friction plus $4 of commission, equaling the stated $744.
Key points
- Roll: sell M1 at the $70.48 bid, buy M2 at the $71.22 ask: 71.22 - 70.48 = $0.74 per barrel.
- One contract: 0.74 x 1,000 = $740; add $2 commission per leg, $4, for $744.
- The $744 is a comparison of costs and prices, not an automatic realized loss.
The $744 comparison must not be described as an automatic immediate realized loss from replacing one futures contract with another. Futures are contractual price exposures, and closing one maturity while opening a later maturity changes the price reference used for future profit and loss. The $700 midpoint gap is not itself a cash purchase premium equivalent to buying a physical asset outright, while the $40 of execution friction and $4 commission represent transaction costs relative to the stated reference midpoints. Whether a long futures position subsequently gains or loses depends on how the newly held contract moves, including its convergence toward settlement. A complete roll journal records both legs, commissions, contract months and the resulting exposure without double-counting costs.
Model Contango Drag With Flat Spot and a Rising Spot Scenario
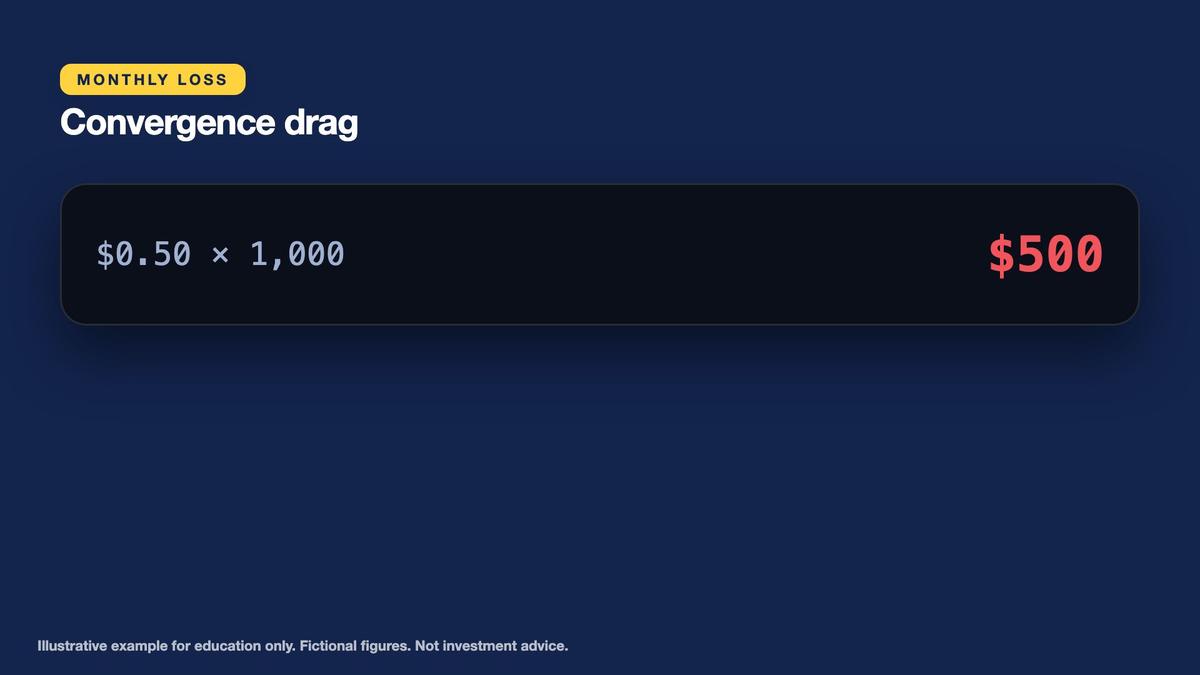
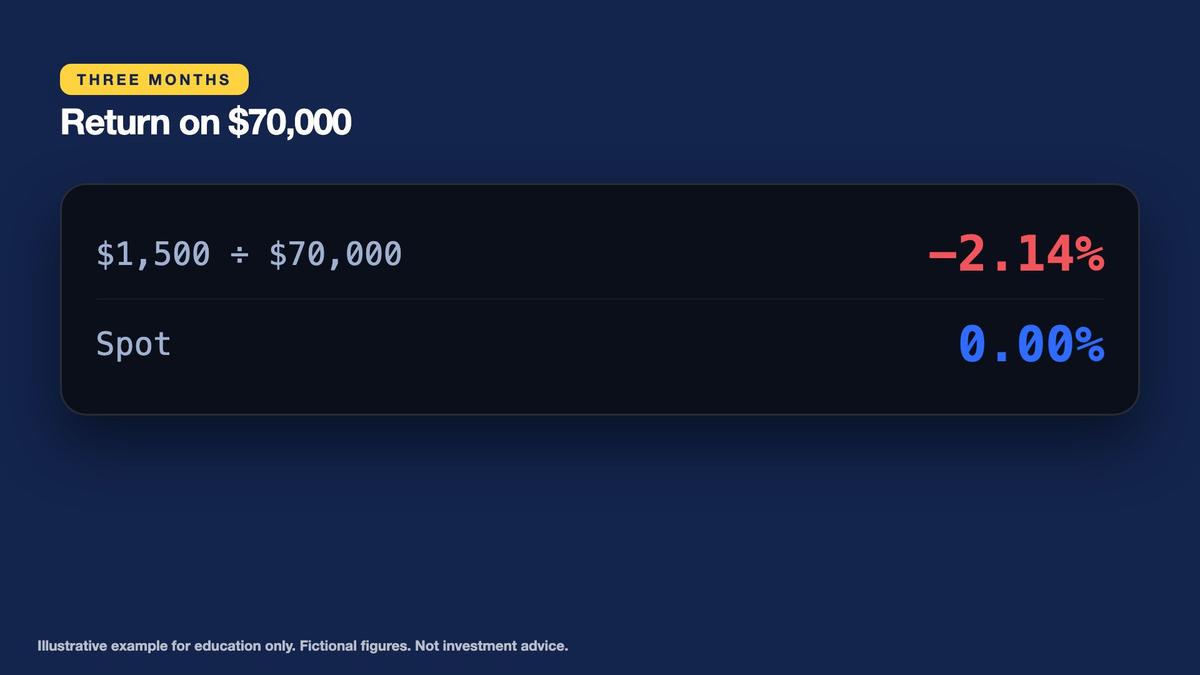
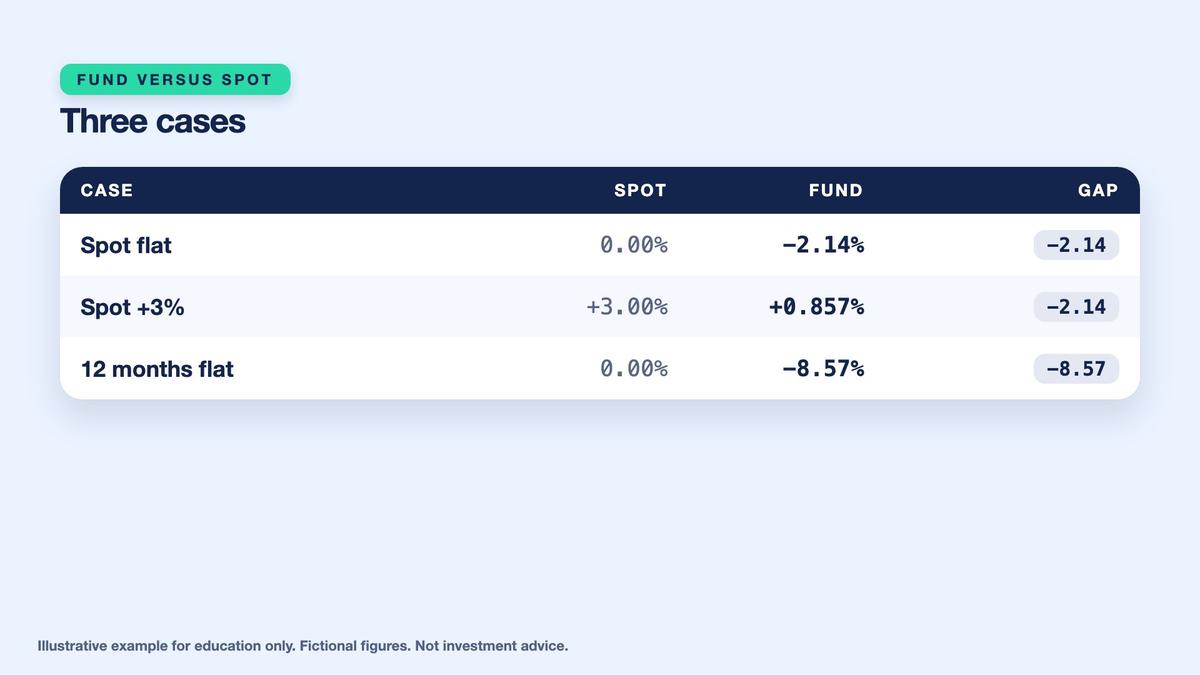
Introduce fictional Sample Oil Fund, which maintains exposure equivalent to one front-month contract of 1,000 barrels and rolls each month. For this separate simplified illustration, suppose every newly held front-month contract begins exactly $0.50 above current spot and converges to spot by expiry. First hold spot flat at $70.00 throughout three months. In each month, the held contract begins at $70.50 and ends at $70.00, producing a $0.50-per-barrel loss. At 1,000 barrels, that is $500 per month. Across three identical months, losses total $1,500, or approximately 2.14% of the initial $70,000 exposure, even though the spot price has not moved.
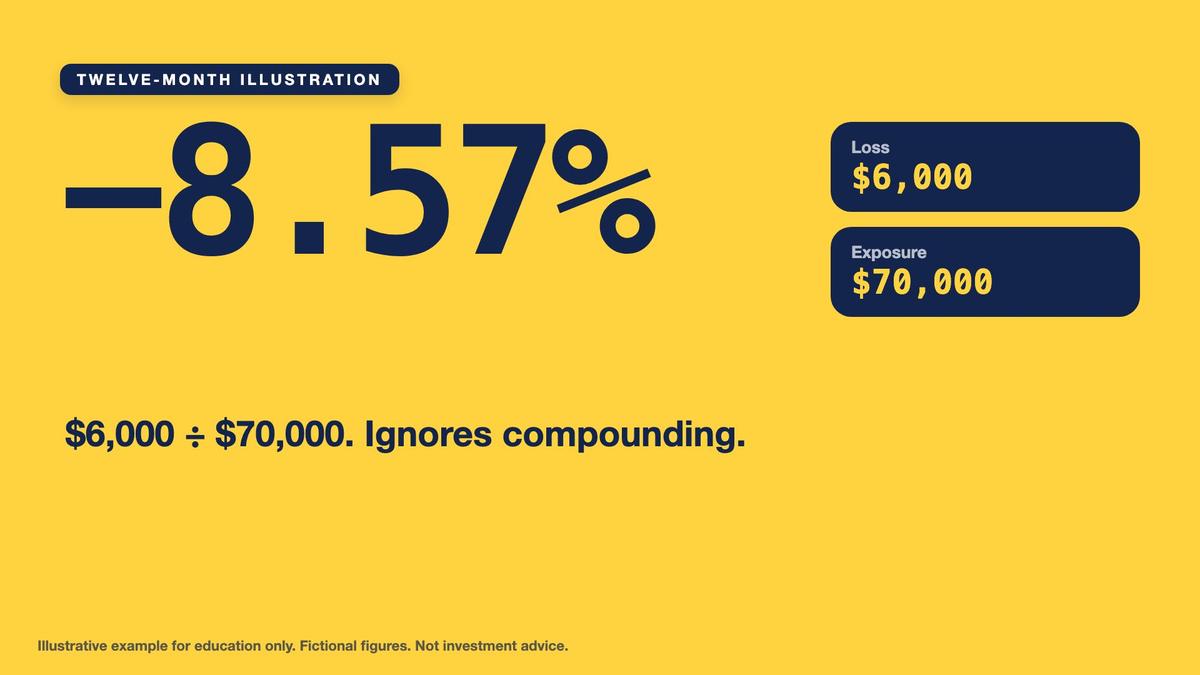
Extend the identical assumptions to twelve months. Twelve monthly convergence losses of $500 produce $6,000 of modeled loss, or approximately 8.57% of the initial $70,000 reference exposure. This is a linear fixed-exposure arithmetic illustration. It ignores transaction charges, management fees, collateral yield, changing contract sizes, compounding, altered roll dates and changes in the term structure. Crucially, do not add the earlier $744 two-leg roll comparison again. That calculation used a particular $0.74 execution differential between M1 and M2, while the fund example models repeated $0.50 premium convergence under an independent set of assumptions. Stacking them would combine incompatible models and double-count aspects of futures pricing.
Key points
- Sample Oil Fund rolls monthly into a contract $0.50 above spot: $0.50 x 1,000 = $500 lost to convergence each month.
- Flat spot: 3 months lose $1,500 (2.14% of $70,000); 12 months lose $6,000 (8.57%, no compounding).
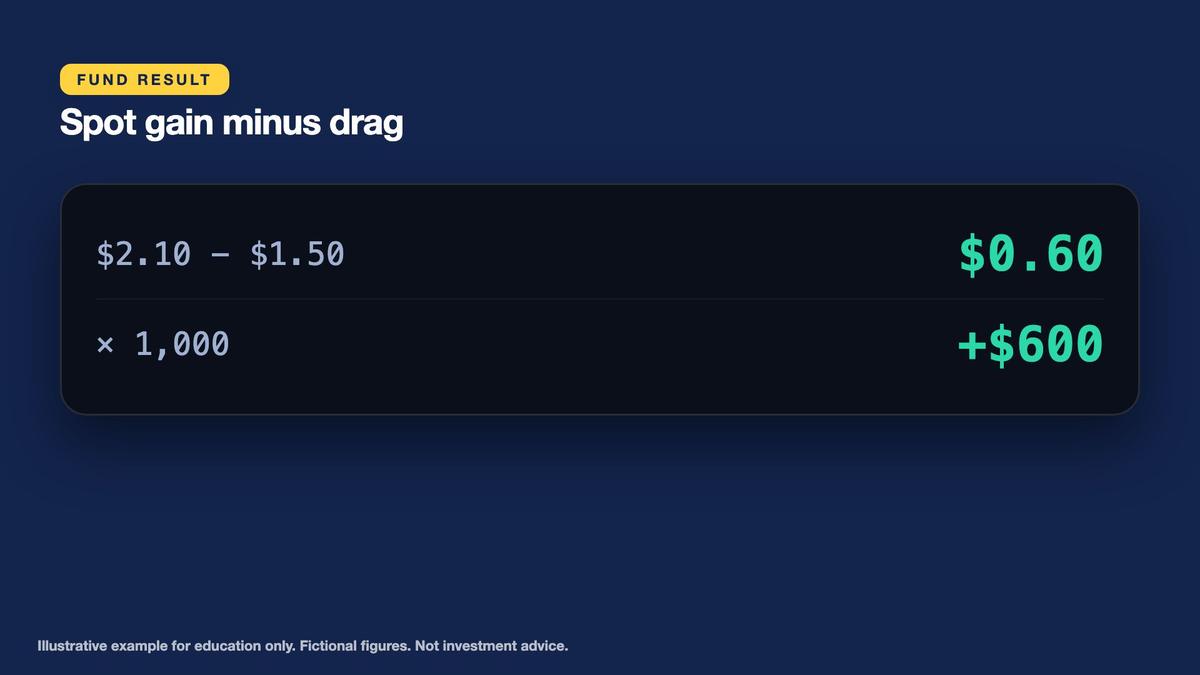
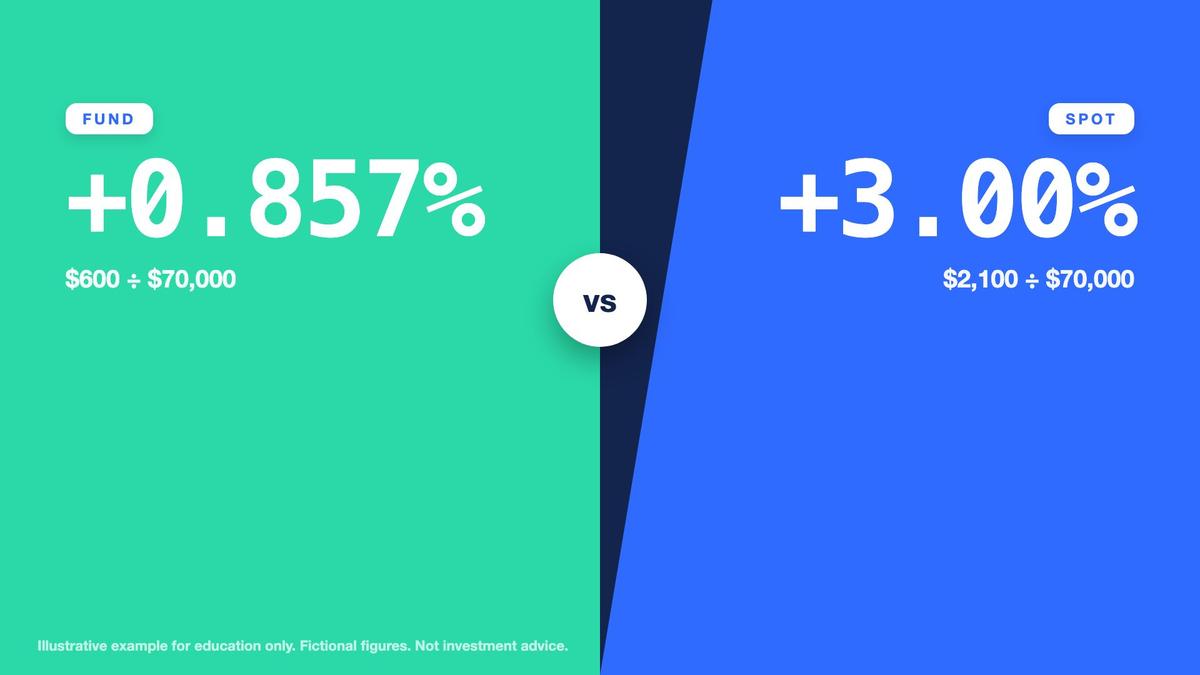
- Spot +3% to $72.10 gains $2,100, but the fund gains $2,100 - $1,500 = $600, or 0.857%.
Now suppose the fictional spot reference rises 3% over the same three-month period, from $70.00 to $72.10. The increase is $2.10 per barrel, or $2,100 across 1,000 barrels of equivalent spot exposure. Under the fund's simplified repeated convergence assumption, three monthly $0.50 premium losses total $1.50 per barrel. Subtracting $1.50 from the $2.10 underlying increase leaves $0.60 per barrel. Across 1,000 barrels, modeled fund profit is $600, equivalent to approximately 0.857% of the original $70,000 exposure. The fictional spot reference rose 3.00%, but the futures-based model gained much less. The difference illustrates tracking divergence, not a prediction.
Compare Backwardation Roll Yield and Read Product Documents
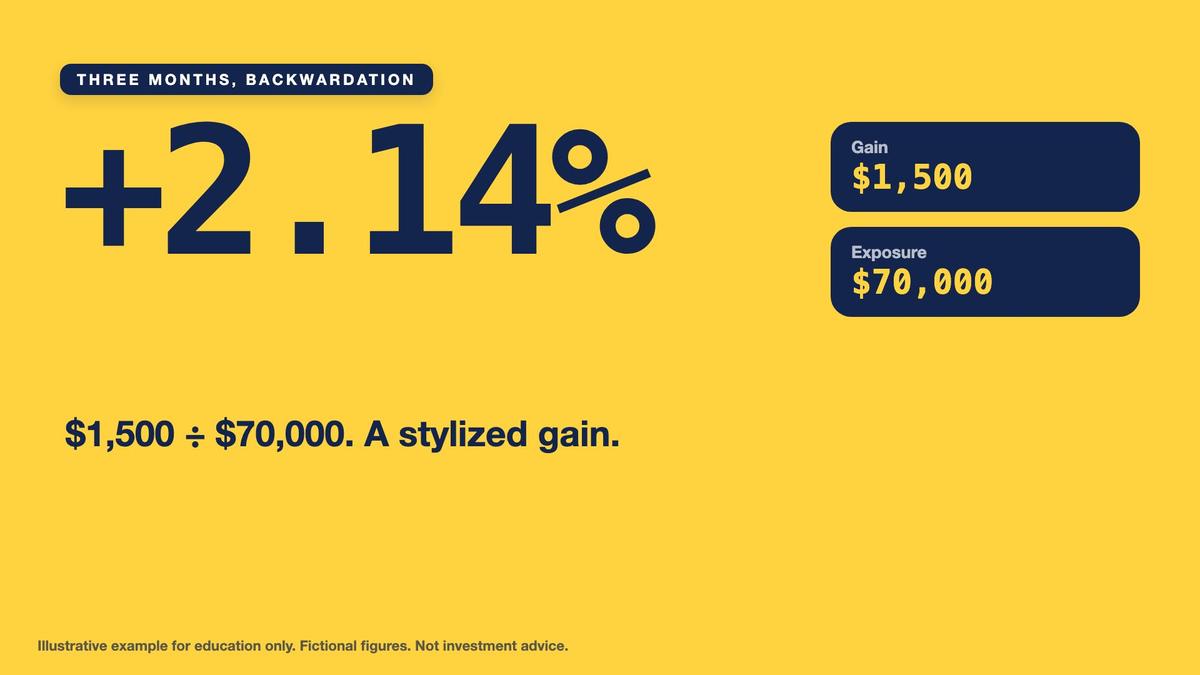
Repeat the fund illustration with backwardation instead of contango. Assume spot remains flat at $70.00, but every newly held front-month contract begins $0.50 below spot, at $69.50, and converges upward to $70.00 by expiry. A long position then gains $0.50 per barrel from convergence each month, equal to $500 across 1,000 barrels. Across three hypothetical months, modeled gains total $1,500, or approximately 2.14% of initial $70,000 reference exposure. This is the opposite directional convergence contribution from the contango case. It does not demonstrate that real backwardated markets guarantee positive returns, because subsequent spot prices and curve shapes are unknown.
The convergence contribution is often discussed under the term roll yield, but precise definitions can vary. Some presentations decompose a futures investment into spot-related return, convergence or roll yield, and collateral income, while other reporting conventions combine or separate components differently. Bid-ask spreads, commissions and management expenses are additional considerations that may reduce realized results. A simple description such as positive roll yield in backwardation is therefore a conditional shorthand, not a complete total-return model. The learner should ask how the particular report defines roll yield before comparing percentages from different funds or sources.
Key points
- Backwardation: contract $0.50 below spot converges upward, +$500 a month, +$1,500 (2.14%) over three months. Stylized.
- Roll yield definitions vary: read how a product splits spot, convergence, collateral and fees.
- Read the fund documents: which months, which roll rule, futures or swaps, and which fees.
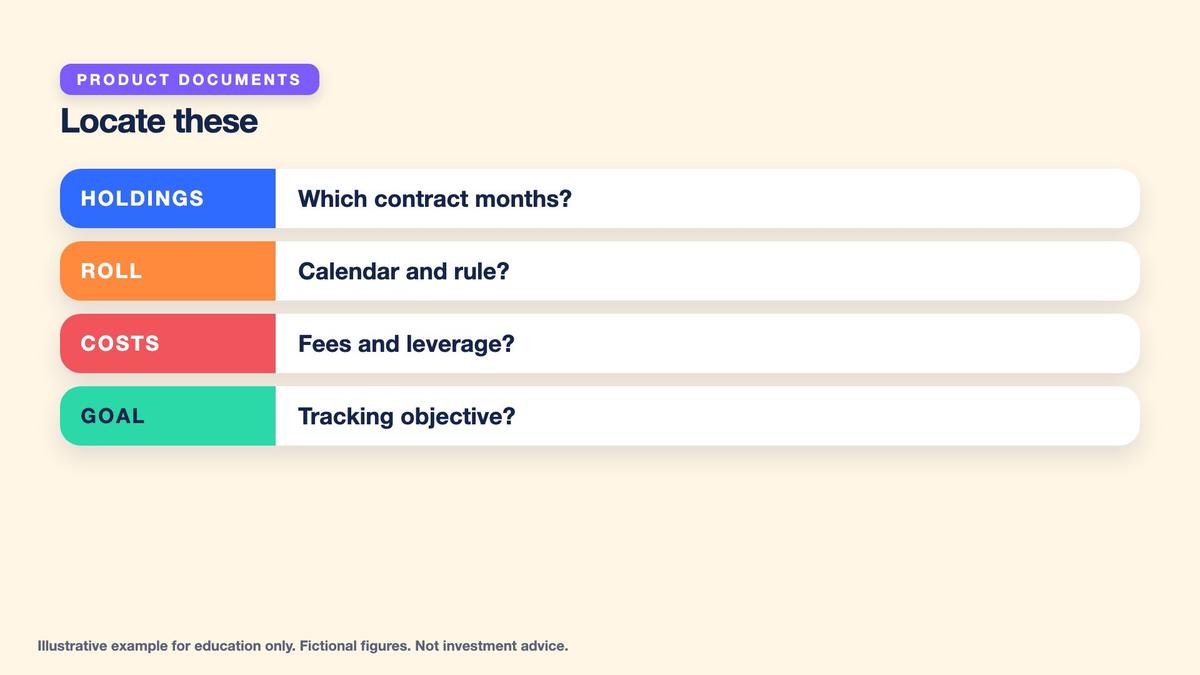
Read the fictional Sample Oil Fund's methodology as if evaluating a real product. Determine which contract months it holds, whether it rolls on a fixed calendar or other rule, and whether exposure comes from futures, swaps or a combination. Inspect its stated tracking objective: the spot price, a front-month futures index, a diversified maturity index or something else. Then identify management fees, commissions, financing or collateral treatment, leverage, trading hours, fund share liquidity and counterparty relationships. A product labeled oil exposure may track an oil futures strategy rather than physical spot. Its performance can therefore differ for reasons fully consistent with the documents, not necessarily because the product malfunctioned.
Complete the Curve, Roll and Expiry Research Sheet
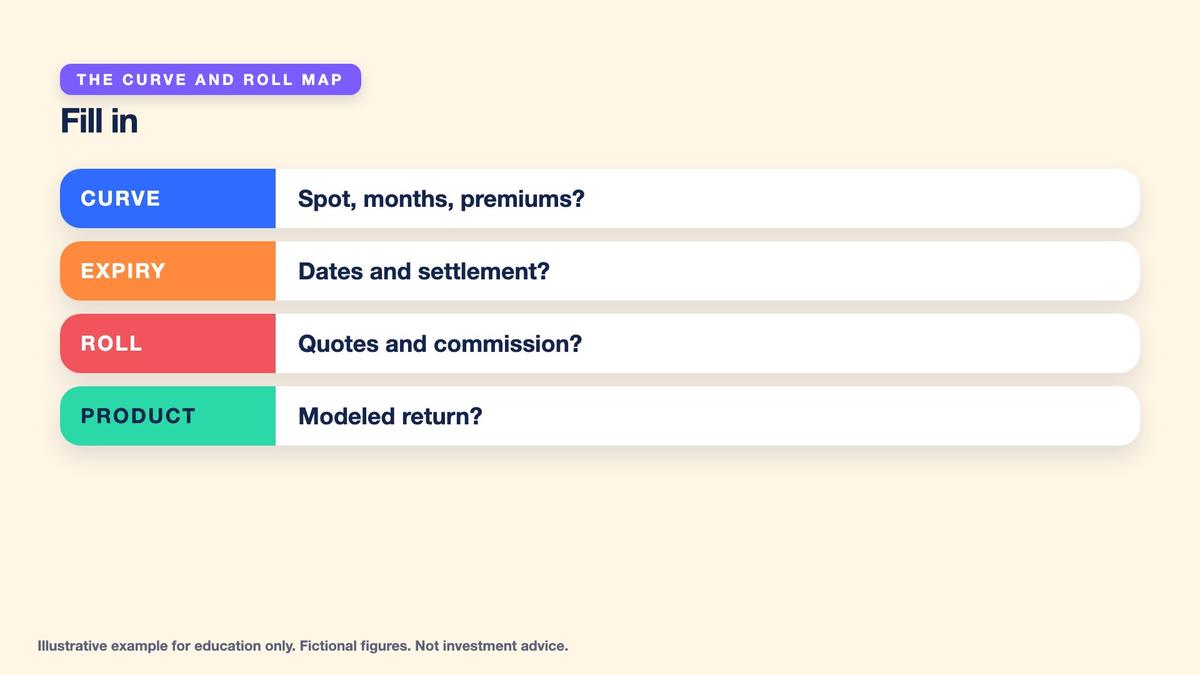
Build a one-page sheet with three groups of information. The curve group records fictional $70.00 spot and the M1 through M4 contango prices of $70.50, $71.20, $71.80 and $72.30, including time to expiry, premiums and calendar spreads. It also records the alternative backwardation values of $69.50, $69.00 and $68.60. Add the simplified monthly carry components of $0.25 storage and $0.21 financing. Label the sample prices fictional and preserve their common observation date. The settlement and contract group records multiplier, last trading day, settlement method, potential delivery obligations, fees, and any unknown specification information that requires verification.
Practice Lab: Build and Reconcile a Fictional Oil Futures Curve
Use only the invented oil market with spot $70.00 and a fictional 1,000-barrel futures contract. Follow the research worksheet in sequence: record the M1, M2, M3 and M4 contango prices and days to expiry, calculate each premium over spot and monthly calendar spread, verify the simplified storage and financing carry, then chart the separate backwardation curve. Next record expiry, last-trading-day and settlement questions that an actual product specification would need to answer. Simulate rolling one long M1 contract by selling at $70.48 bid and buying M2 at $71.22 ask, recording $2 commission on each leg. Decompose the $744 price-differential-plus-fee comparison into underlying contract-price gap, execution friction and explicit commission without calling the entire amount an immediate realized loss. Finally evaluate the separate fictional Sample Oil Fund model with repeated $0.50 monthly futures convergence under unchanged spot, spot rising 3%, and backwardation. Keep the explicit two-leg roll and the repeated-convergence return illustration in separate calculations. Use simulated money only; no real exchange, fund, futures trade or delivery arrangement is involved.
- Decision 1: The fictional oil market has $70.00 spot and contango futures M1 $70.50, M2 $71.20, M3 $71.80 and M4 $72.30, expiring in 30, 60, 90 and 120 days respectively. — Calculate each premium over spot, each adjacent calendar spread, and the M2-minus-M1 spread as a percentage of M1.
- Decision 2: The fictional market has storage expense of $0.25 per barrel monthly and financing of 0.30% per month on $70.00, while a separate backwardation curve prices M1 at $69.50, M2 at $69.00 and M3 at $68.60. — Calculate simplified monthly carrying cost, compare it with the $0.50 M1 contango premium, and describe the backwardation discounts.
- Decision 3: A fictional long M1 futures contract represents 1,000 barrels. The roll sells M1 at $70.48 and buys M2 at $71.22; reference midpoints are $70.50 and $71.20, with $2 commission on each leg. — Calculate the executed roll differential, its contract-sized value, the commission-inclusive comparison, and the portion that represents immediate execution friction.
- Decision 4: Fictional Sample Oil Fund holds 1,000 barrels-equivalent front-month exposure. Every month a new front contract begins $0.50 above spot and converges to spot; spot remains $70.00 throughout. — Calculate the modeled fund result after three months and twelve months, express both relative to $70,000 starting exposure, and explain why spot and fund results differ.
- Decision 5: Over three fictional months, oil spot instead rises 3% from $70.00 to $72.10 while contango convergence costs $0.50 per barrel monthly. A separate backwardation case has unchanged spot and contracts starting $0.50 below spot. — Calculate the rising-spot fund result, compare it with spot, calculate the backwardation result, and list essential expiry and product disclosures.
Answer key
The execution group records a long one-contract M1 position, its sale at $70.48, the corresponding M2 purchase at $71.22, and the $0.74-per-barrel executed difference. Multiply by 1,000 for $740, then add $4 commissions to obtain the stated $744 comparison. Keep the $700 midpoint calendar spread separate from the $40 spread-related execution friction and $4 commissions. Journal explicitly that the $700 contract-price gap is not automatically an immediate realized futures loss. The performance group then records the independent repeated-convergence model: $1,500 loss over three flat-spot contango months, $6,000 over twelve, $600 gain when spot rises 3%, and $1,500 gain in the flat-spot backwardation alternative.
Key points
- Curve group: spot, M1-M4 prices, days to expiry, premiums and spreads.
- Execution group: sale $70.48, purchase $71.22, $0.74, $740, $4 commission, $744.
- Product group: what it holds, when it rolls, settlement and costs, linked to the modeled -2.14%, +0.857% and +2.14%.
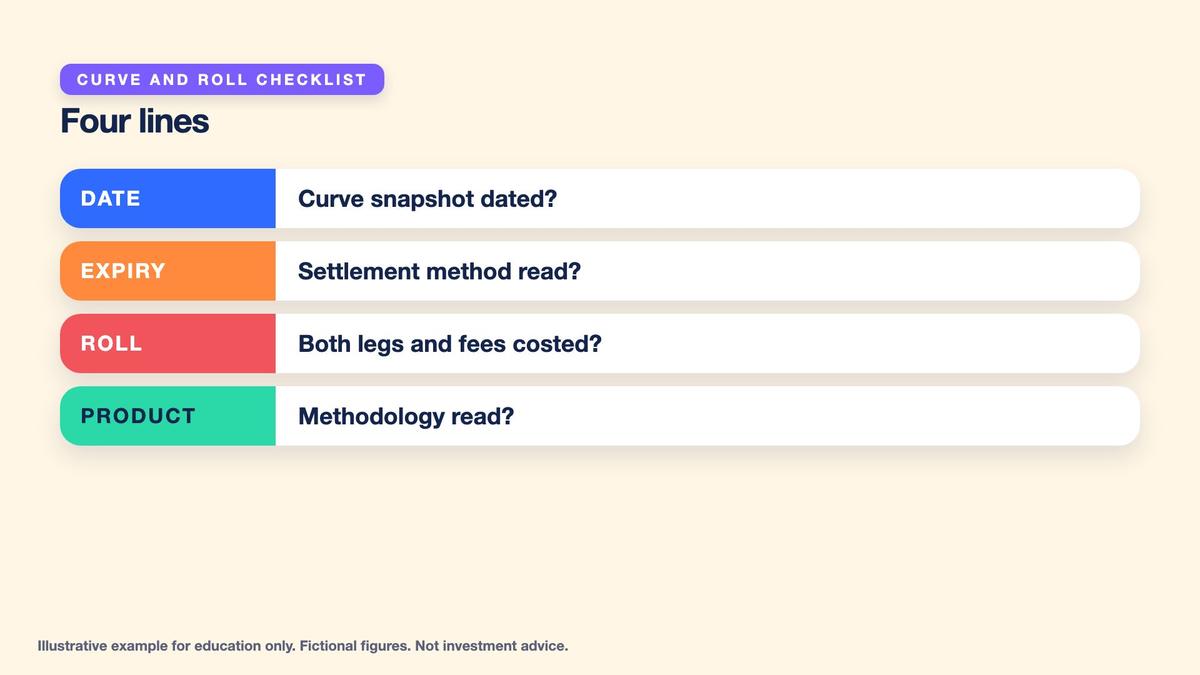
Complete the checklist by asking which price the product follows, which maturity is held, when positions expire or roll, what happens at settlement, and how the product accounts for transaction costs, collateral and fees. Connect the calculations to the earlier oil market basics lesson, the XAUUSD contract and sizing lab, the spread and slippage lab, and the margin and leverage lesson. Futures contracts can introduce financial exposure and delivery considerations that a cash oil quotation does not describe. The next Micro WTI demo laboratory will apply this discipline to a dated exchange specification, smaller contract multiplier, tick profit and loss, and expiry risk. The final learning outcome is explaining product divergence without offering a price forecast.
Worked example at a glance
Key terms
- Spot: the price for immediate delivery of the commodity.
- Futures contract: an agreement tied to a specific month, with set size and terms.
- Contango: a curve where later months cost more than nearer ones.
- Backwardation: a curve where later months cost less than nearer ones.
- Calendar spread: the price difference between two contract months.
- Cost of carry: storage, financing and handling costs of holding a commodity.
- Convergence: the tendency of a contract to move toward settlement value at expiry.
- Expiry: the end of a contract life, with a last trading day.
- Settlement: how a contract ends: in cash or by physical delivery.
- Roll: closing a near contract and opening a later one.
- Roll yield: the convergence part of a futures-based return; definitions vary.
- Notional: price times quantity, the dollar size of a contract.
Multi Asset Trading Lab provides educational information only and does not constitute personalized investment, trading, financial, legal, tax, commodities, brokerage, futures, fund-selection or risk-management advice. All oil market prices, futures contracts, curves, contract-month quotations, financing charges, storage charges, spreads, execution fills, commissions, product holdings, roll policies, settlement scenarios and performance outcomes in this lesson are fictional classroom assumptions. No actual exchange, exchange contract code, fund, broker, futures contract, current oil quotation, real financial product or real-money trading opportunity is identified or recommended. Every numerical example uses simulated money and hypothetical positions only. No exchange account, live trade, futures delivery obligation or financial transaction is required or encouraged. The invented spot oil reference is $70.00 per barrel, and the fictional futures multiplier is 1,000 barrels per contract, making each $1-per-barrel price movement equivalent to $1,000 in gross contractual value change before costs. This multiplier belongs only to the fictional example and must not be assumed applicable to all real futures or oil-linked products. Actual futures instruments can differ in underlying quality, location, delivery month, contract quantity, tick size, tick value, last trading day, price limits, margin, settlement mechanism, fees, trading hours and liquidity. Learners must inspect current official specifications before attempting to understand an actual contract. The fictional contango curve has M1 at $70.50 with 30 days to expiry, M2 at $71.20 with 60 days, M3 at $71.80 with 90 days, and M4 at $72.30 with 120 days. Their premiums over the fictional $70.00 spot reference are $0.50, $1.20, $1.80 and $2.30 per barrel, or approximately 0.714%, 1.714%, 2.571% and 3.286% of spot. The adjacent calendar spreads are $0.70, $0.60 and $0.50 per barrel, and the M2-minus-M1 spread equals approximately 0.99% of M1. These are simultaneous hypothetical prices for different maturities, not predictions of future realized spot quotations or guaranteed investment gains. The simplified monthly cost-of-carry illustration assumes $0.25 per barrel storage and financing of 0.30% per month on the $70 reference, equal to $0.21 per barrel. Their sum is $0.46 per barrel per month, close to the fictional $0.50 M1 futures premium. This resemblance illustrates possible economic intuition only. The actual futures term structure reflects market supply and demand, inventory availability, convenience value, financing, transportation, market expectations and other interacting factors. A futures curve cannot reliably be reconstructed from one fixed storage charge and financing percentage, and its slope does not guarantee any future spot-price direction. The alternative fictional backwardation curve has M1 at $69.50, M2 at $69.00 and M3 at $68.60 against the same $70 spot reference, producing respective discounts of $0.50, $1.00 and $1.40. Backwardation can be consistent with relatively valuable nearby physical supply, but it does not guarantee positive long-position performance, future price increases or profitable rolling strategies. Actual curves can change shape and level rapidly, including moving between contango and backwardation. Futures expiry creates legal and operational obligations that differ among products. Some futures contracts can involve physical delivery, while others settle financially in cash. Last trading days, notice periods, delivery processes, final settlement values, broker liquidation rules and earlier broker restrictions must be verified from the applicable current specifications. A customer who does not intend physical delivery may still face material obligations or execution risks if positions are not managed within required deadlines. Near-expiry liquidity may be reduced, bid-ask spreads may widen, and market conditions may differ from the classroom assumptions. Convergence between futures prices and the relevant underlying settlement reference is a broad market mechanism rather than a guarantee that any unrelated spot quotation, location or grade will exactly match a futures price on a particular date. The explicit fictional roll assumes one long M1 contract representing 1,000 barrels. Selling M1 at the stipulated $70.48 bid and buying M2 at the $71.22 ask produces an executed price differential of $0.74 per barrel, or $740 when multiplied by 1,000 barrels. The reference midpoint quotations are $70.50 for M1 and $71.20 for M2, so their underlying calendar price gap is $0.70 per barrel, or $700 across the contract. Execution at the specified bid and ask adds $0.02 per barrel on each leg, giving $0.04 per barrel or $40 midpoint-referenced execution friction in total. The example charges $2 per contract per side, giving $4 total commissions. The stipulated $744 roll comparison therefore consists of $700 midpoint contract-price gap, $40 execution friction and $4 commissions. This figure must not be described as an automatic, immediately realized $744 loss solely from selling a futures contract at a lower quotation and opening a later contract at a higher quotation. Futures contracts are generally marked based on changes in their own settlement or market values, and replacing one maturity with another changes future price exposure. The $700 midpoint calendar difference is an economic characteristic of the term structure, not necessarily a cash fee, realized mark-to-market loss or independent transaction expense. The $40 execution friction and $4 commissions are genuine transaction costs relative to the stipulated midpoint references, while subsequent profits and losses depend on the price path of the newly held contract. The classroom comparison uses a simplified two-leg execution convention and ignores other charges, bid-ask changes, broker rules, liquidity limitations, variation margin and slippage beyond the specified fills. Actual contract rolls can involve additional or different risks, including spread execution timing and legging risk. The fictional Sample Oil Fund is entirely invented and represents 1,000 barrels-equivalent long exposure in front-month futures with a simplified monthly roll strategy. Its illustrative recurring-convergence model is separate from the explicit $744 two-leg roll example. It assumes that each newly held front-month contract begins exactly $0.50 above the prevailing spot price and then converges to spot at expiry, with the curve repeatedly returning to the same fictional shape each month. With spot fixed at $70.00, each monthly convergence loses $0.50 per barrel, or $500 for the constant 1,000-barrel exposure. Three months produce $1,500 modeled loss, approximately 2.14% of the initial $70,000 reference exposure, while spot itself remains unchanged. Twelve months produce $6,000 modeled loss, approximately 8.57% of starting reference exposure. These results are linear arithmetic illustrations with fixed contract-equivalent exposure, no compounding, no changes in the assumed curve relationship, no fund fees, no collateral interest, no additional trading friction and no changes in cash or contract quantity. They are not forecasts of any real product's tracking error or annual return. The explicit $744 roll comparison must not be added as a separate monthly cost to these recurring-convergence calculations; doing so would combine different assumptions and may double-count related curve or execution effects. Under the separate illustrative three-month spot increase, the fictional spot reference rises 3% from $70.00 to $72.10, an increase of $2.10 per barrel or $2,100 across 1,000 barrels. The stylized three-month contango convergence effect subtracts $1.50 per barrel, leaving $0.60 per barrel or $600 in modeled fund profit, equivalent to approximately 0.857% of the original $70,000 exposure. The example demonstrates that a hypothetical positive spot movement does not guarantee an equal futures-based product return, but it does not estimate any real tracking difference. Under a separate backwardation scenario with unchanged $70 spot and each newly held front month priced $0.50 below spot, the hypothetical convergence gain is $500 per month and $1,500 over three months, approximately 2.14% of initial exposure. This result does not guarantee that backwardation generates investment gains because actual futures prices, spot references and liquidity evolve over time. Terms such as roll yield can have different definitions in investment research, product reporting and futures return decomposition. Some methodologies distinguish spot-related return, convergence or roll contribution, collateral return and fees, while others combine or define these differently. The user must identify the convention before interpreting a reported roll-yield figure or comparing products. Real futures-based investment products may hold different contract maturities, multiple futures months, swaps, cash collateral, leveraged exposures or instruments with particular delivery and settlement requirements. Their performance can be affected by product expenses, financing, collateral income, roll schedules, premiums or discounts to net asset value, market liquidity, bid-ask spreads, counterparty relationships, tracking methodology and tax or regulatory considerations. A product's oil-related name does not guarantee that it tracks current physical spot oil prices or delivers equivalent returns over any holding period. Leveraged futures exposure can change account equity sharply relative to posted margin and may result in margin calls, forced liquidation, gaps or losses exceeding initial expectations. The earlier oil market basics lesson, XAUUSD sizing laboratory, spread and slippage material, and margin and leverage lessons provide useful educational concepts but do not establish a safe or profitable trading method. Learners should preserve the curve observation date, underlying instrument definitions, all contract months, expiration dates, last trading days, settlement terms, quantities, bid-ask quotations, commissions, roll execution prices, margin assumptions, collateral conventions, tracking methodology and omitted costs in a research journal. No numerical result in this lesson predicts future spot prices, future futures curves, portfolio returns or the direction of any oil market. The next Micro WTI demo lab is presented only as a planned classroom exercise using dated specifications, tick calculations and expiry checks. This lesson does not recommend buying, selling, holding, rolling, borrowing against or trading any actual oil, commodity future, exchange-traded fund, CFD, option, derivative or other financial instrument. All outcomes and activities remain fictional, simulated and educational only.
Lesson Checkpoint
Review what you learned and get feedback on your work.