



In this twelve-minute beginner lesson, learners compare three fictional methods of obtaining gold price exposure: owning physical metal, holding shares of a listed gold product, and trading a broker's XAUUSD contract. Using one invented sample-date gold price of $2,000 per troy ounce and a target of $10,000 in notional exposure, learners calculate equivalent quantities, entry costs, spreads, holding costs, break-even movements, financing charges, and margin requirements. The lesson compares a physical purchase with a dealer premium and storage expense, a fictional Sample Gold Fund with a bid-ask spread and annual expense ratio, and a fictional CFD-style XAUUSD instrument using leverage and overnight financing. A hypothetical 10% gold price increase illustrates why ownership, execution prices, costs, and holding periods can produce different financial results despite similar underlying exposure. Learners also calculate a simplified margin stop-out and distinguish ownership of metal from ownership of fund shares or a contractual claim against a broker. The final outcome is a one-page exposure map identifying cost, custody, counterparty, trading hours, leverage, and instrument specifications. All figures and institutions are fictional; every calculation is educational, uses simulated money only, and provides neither investment advice nor price predictions.
Define Gold Exposure and Normalize the Units
Gold exposure describes how the economic value of a holding or contract responds to changes in gold prices. Different instruments can provide exposure to the same underlying market without granting the same legal ownership, trading access, custody rights or loss characteristics. This lesson compares three fictional routes: physical bullion from an invented dealer, shares in fictional Sample Gold Fund, and a broker's CFD-style XAUUSD instrument. None of these represents a real product recommendation. All figures are invented for a single hypothetical sample date. The reference gold spot price is $2,000 per troy ounce, and the objective is to compare approximately $10,000 of underlying exposure.

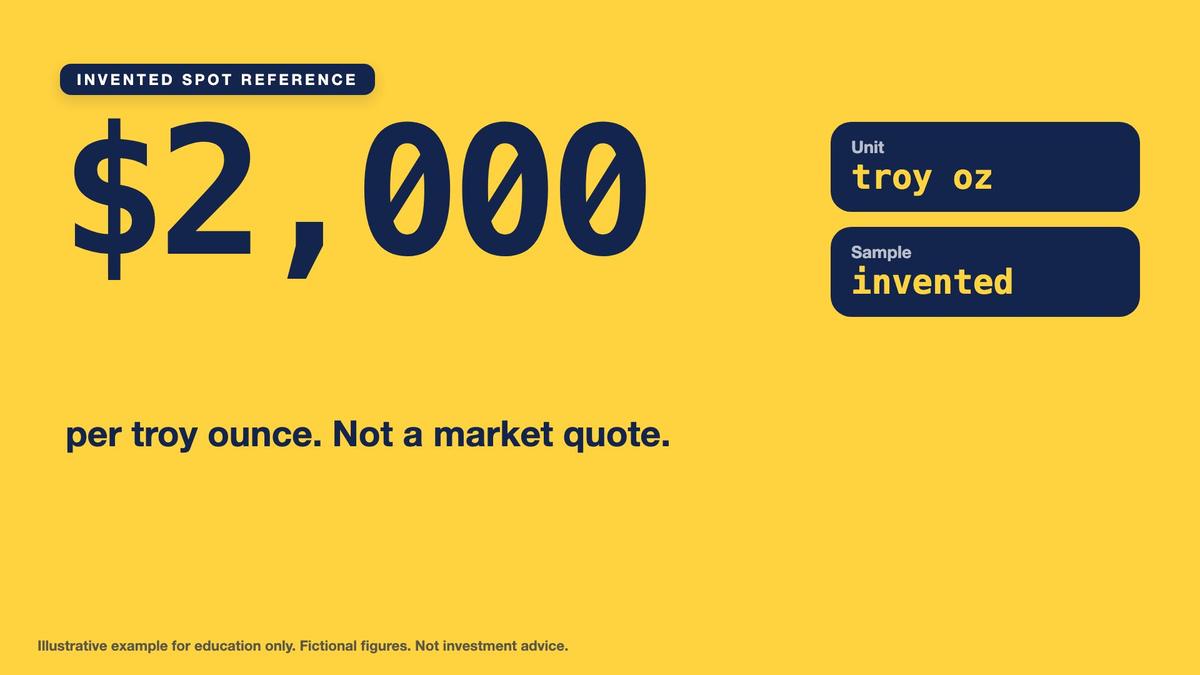
Gold is commonly quoted by the troy ounce in international precious metals markets. XAU/USD is a quotation convention expressing the price of one troy ounce of gold in US dollars. This notation does not itself establish whether a broker offers spot metal, a derivative, an unallocated metal account or another instrument; the contract specification determines what the customer actually receives. At the fictional reference price of $2,000 per ounce, $10,000 of gold exposure equals five troy ounces. Using the specified conversion of 31.1035 grams per troy ounce, five ounces equal 155.5175 grams. Keep this quantity consistent when comparing routes.

Key points
- Gold exposure means how a holding or contract responds to gold prices; the same exposure can be held in different ways.
- Invented reference: $2,000 per troy ounce, so $10,000 = 5 oz = 155.5175 g (31.1035 g per ounce).
- A fictional broker lot is 100 oz, so 5 oz = 0.05 lot; always check the real contract size.
The fictional broker defines one standard lot as 100 troy ounces, equal to 3,110.35 grams using the same conversion convention. Consequently, five ounces represent 0.05 standard lot. These quantities are part of the classroom contract specification and must never be assumed universal. Different real products can use different contract multipliers, minimum sizes, tick values or settlement methods. A comparison should begin by normalizing underlying exposure before evaluating ownership and costs. Otherwise, one product may appear cheaper simply because it represents fewer ounces or uses a different unit. The three routes also require different amounts of initial cash, even when their reference gold exposure is similar.

Route One: Physical Gold, Dealer Premium and Storage
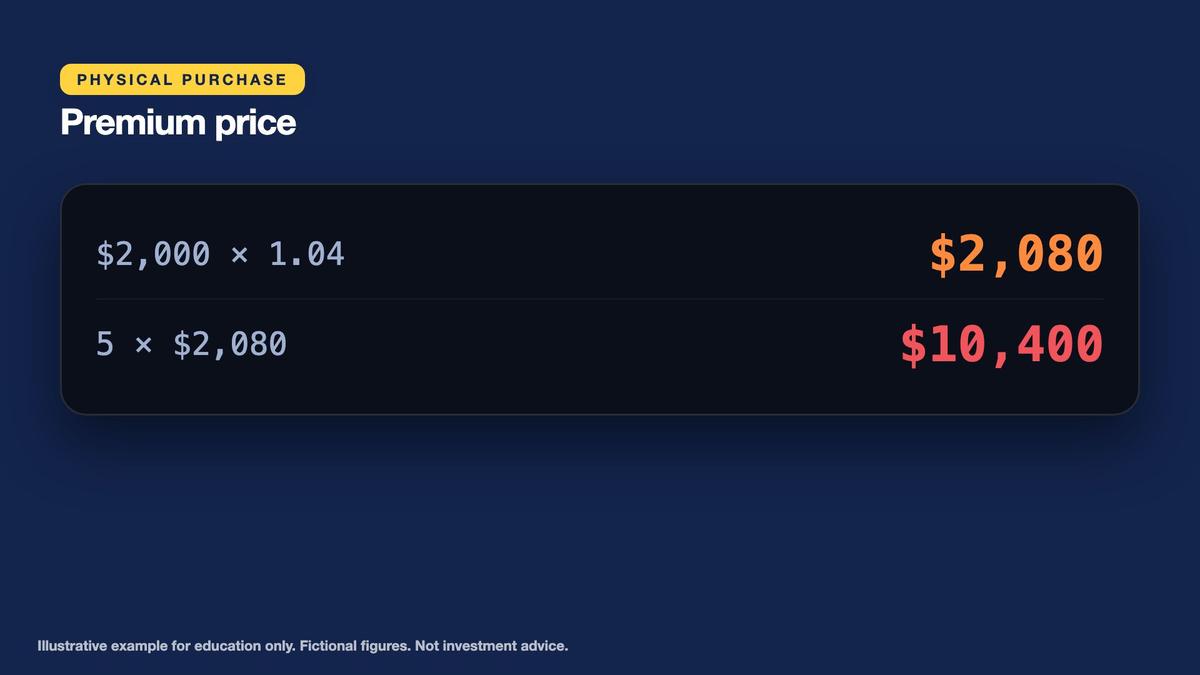
Our fictional physical gold dealer sells metal for the reference spot price plus a 4% premium. At a $2,000 spot price, the purchase price is $2,000 multiplied by 1.04, or $2,080 per ounce. Purchasing five ounces therefore requires $10,400 in simulated cash. The buyer receives ownership of physical metal rather than shares in a fund or a broker's contractual price exposure. However, purchasing the metal at a premium means the cash paid exceeds the $10,000 underlying spot reference value. Dealer premiums may represent fabrication, distribution, inventory, handling and other costs under a given market arrangement.
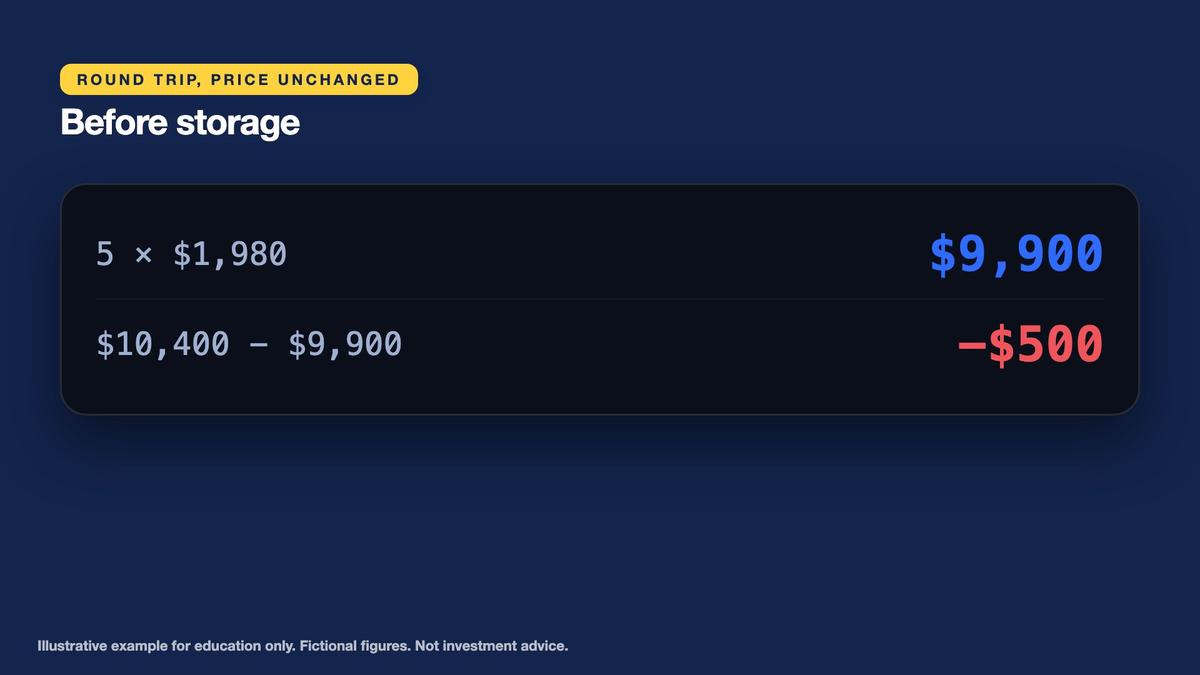
The fictional dealer buys back physical gold at 1% below the current spot reference. If the spot price remains unchanged at $2,000, the repurchase price is $1,980 per ounce. Selling five ounces returns $9,900. The difference between the $10,400 purchase price and $9,900 resale proceeds is a $500 round-trip loss before storage costs. Assume storage costs $50 for the year. Total first-year loss at unchanged spot becomes $550. Dividing $550 by the actual $10,400 cash purchase cost gives approximately 5.288%, displayed as 5.29%. The purchase premium and buyback discount are both important elements of physical transaction friction.
Key points
- Physical: buy at spot plus 4% = $2,080 per oz, so 5 oz cost $10,400.
- Dealer buyback at spot minus 1% = $1,980 per oz, so an unchanged-price sale returns $9,900, a $500 loss.
- Add $50 storage: first-year cost $550, which is 5.29% of $10,400 (550 / 10,400 = 5.288%).
Physical ownership avoids reliance on a broker to honor a derivative payout on the metal itself, assuming the purchaser receives genuine metal with valid title. That does not eliminate all counterparty or operational risks. A buyer may rely on the dealer's authenticity, transfer and repurchase procedures, or on a vault, insurer or service provider for storage. Theft, damage, counterfeit concerns, insurance exclusions, transport and resale liquidity can affect the outcome. Trading access depends on dealer availability rather than an exchange's order-book hours. A complete exposure map should record where the metal is held, who can access it, whether insurance exists, and how resale prices are determined.
Route Two: Listed Gold Product, Shares and Expense Ratio
The second route is fictional Sample Gold Fund, a listed investment product whose assumed shares each represent exposure backed by 0.01 troy ounce of gold. At the $2,000 fictional reference spot price, that amount of metal has a reference value of $20 per share. The listed product is quoted with a $20.00 ask and $19.98 bid. Its spread is $0.02, or approximately 0.10% of the $19.99 midpoint. Buying $10,000 at the ask obtains 500 shares, which collectively represent five troy ounces. The purchaser owns fund shares, not individually identified or directly redeemable gold bars under this example.
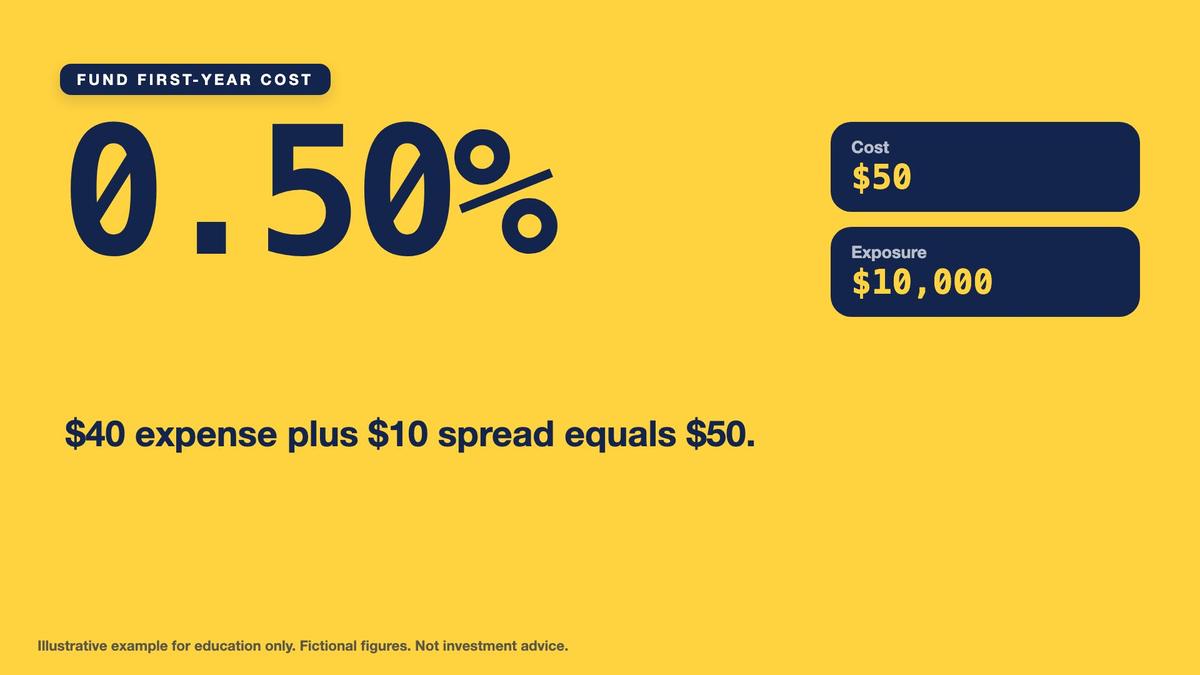
Suppose the gold reference and share quotations remain unchanged for one year. Selling the 500 shares at the fictional $19.98 bid would produce $9,990, or $10 less than the $10,000 purchase. This $10 is the round-trip spread friction under the assumed constant quotes. The fund also has an invented annual expense ratio of 0.40%. Applying that rate to the initial $10,000 for a simplified classroom comparison gives $40 in annual expenses. Adding the $10 spread-related loss and $40 expense gives $50 total first-year cost, equivalent to 0.50% of the $10,000 purchase. Actual fund expenses generally accrue through fund assets and NAV, rather than being billed as a separate cash invoice.
Key points
- Sample Gold Fund: each share is backed by 0.01 oz, about $20 at $2,000 spot; 500 shares = 5 oz.
- Spread $0.02 (0.10%): selling unchanged at $19.98 loses 0.02 x 500 = $10.
- Expense ratio 0.40% = $40, so first-year cost is $50, or 0.50% of $10,000.
A listed gold product introduces a different ownership and custody chain from physical bullion. The investor holds securities, while the fund may rely on custodians, administrators, authorized participants and exchange infrastructure. Trading normally depends on exchange opening hours, order-book liquidity and the availability of the relevant share class. Share prices may deviate from underlying net asset value, and expenses or tracking differences can affect returns. Lesson 12 introduced index and ETF structures, while Lesson 13 emphasized factsheet holdings, fees and disclosures. The same habits apply here: verify legal structure, what backs the shares, whether metal redemption is possible, which fees apply, and the official instrument documentation.
Route Three: XAUUSD Contract, Spread, Leverage and Financing
The third route is a fictional broker's CFD-style XAUUSD instrument. The broker displays a bid of $1,999.80 and ask of $2,000.20 per troy ounce, creating a $0.40 spread, or 0.02% of the $2,000 midpoint. The contract provides price exposure, not ownership of physical gold. With the invented 100-ounce standard lot, a five-ounce position is 0.05 lot. For a position representing five ounces, each $1 movement in gold price changes the contract's gross value by $5 before fees and financing. This is an important unit check because profit and loss depend on the contract multiplier.
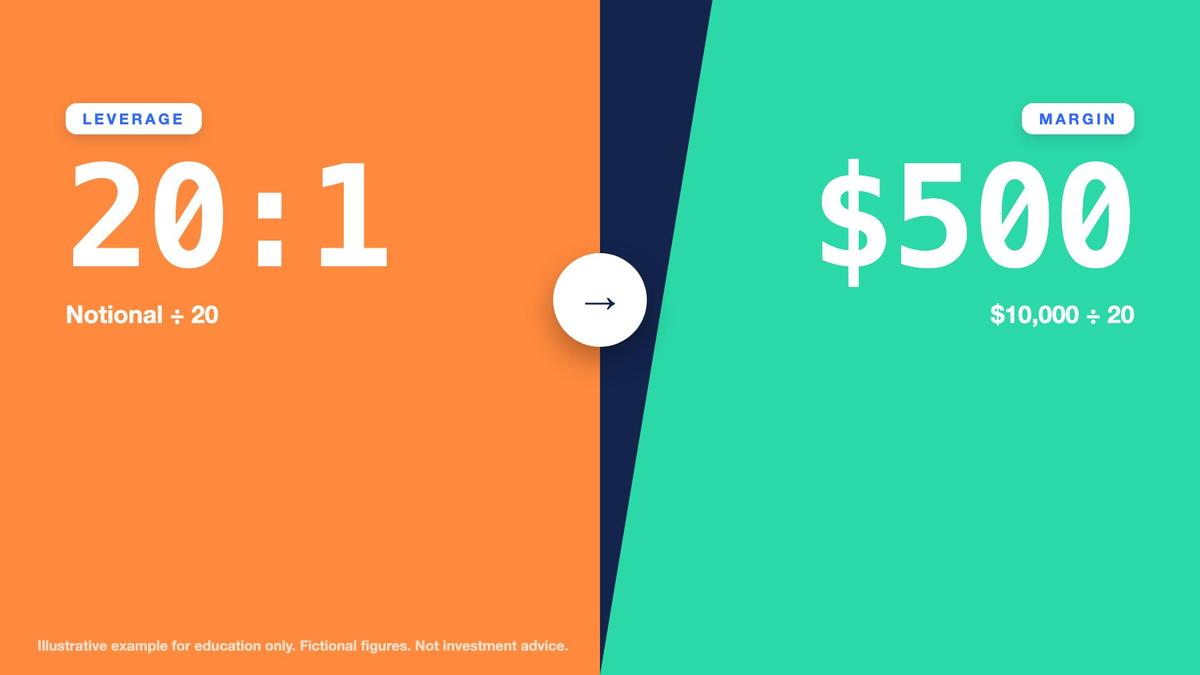
Our fictional broker permits leverage of 20:1, so the $10,000 reference notional requires $10,000 divided by 20, or $500 of initial margin. Margin is collateral supporting a larger contractual position, not a purchase payment for physical bullion. Buying at $2,000.20 and immediately closing at $1,999.80 produces a $0.40 loss per ounce, equal to $2 across five ounces. Although $2 is small relative to the $10,000 underlying reference exposure, a leveraged account may be sensitive to adverse market movements, funding charges, changes in required margin and counterparty performance. Trading access depends on the broker's contractual schedule.
Key points
- Broker XAUUSD: bid 1,999.80, ask 2,000.20, spread $0.40 (0.02%); 5 oz moves $5 per $1.
- Leverage 20:1 means margin = $10,000 / 20 = $500; margin is collateral, not ownership of metal.
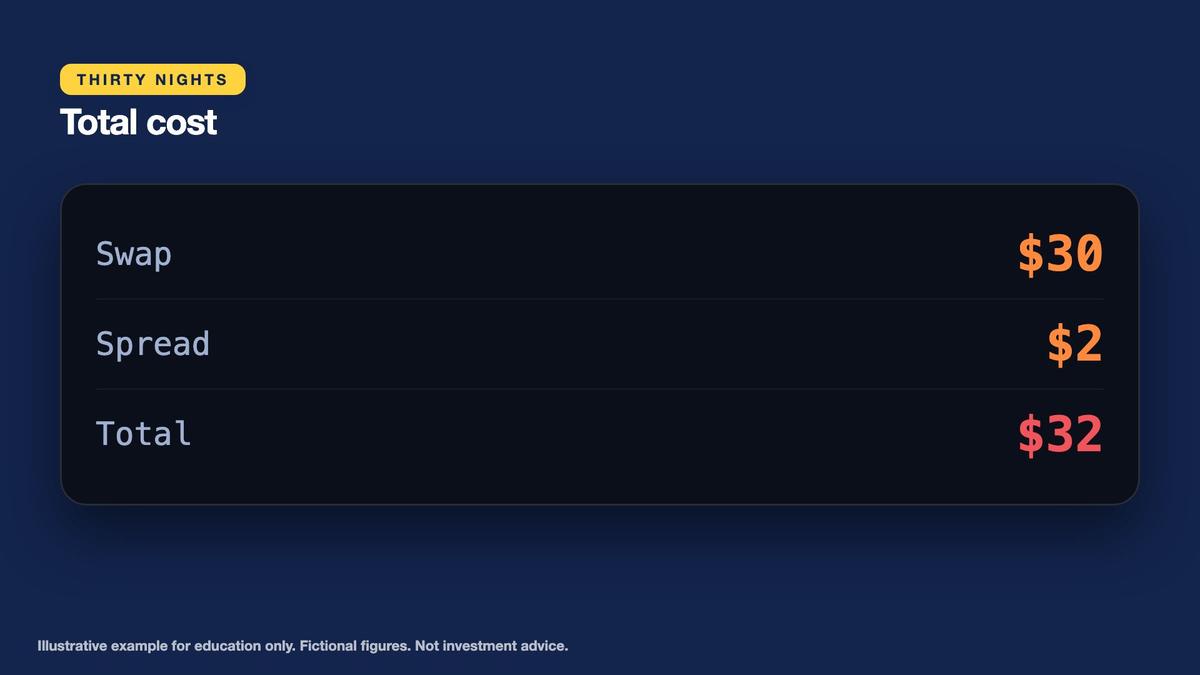
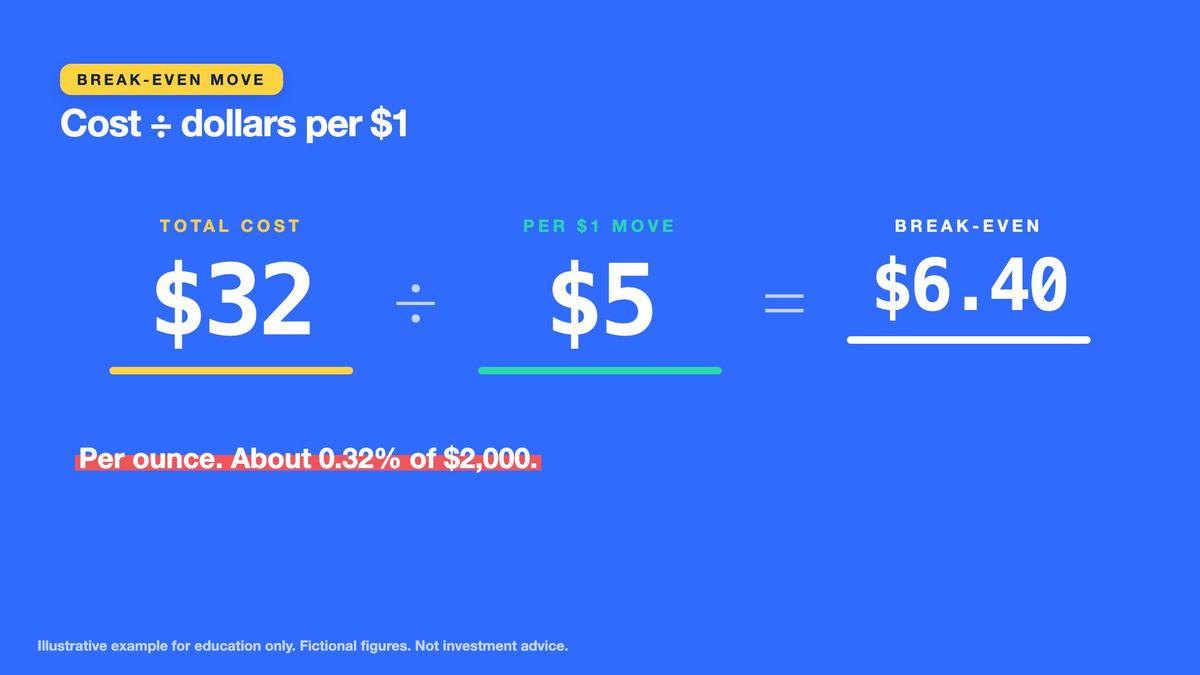
- Swap $1 a night: 30 nights cost $30 + $2 spread = $32, a break-even move of $6.40 per oz (0.32%).
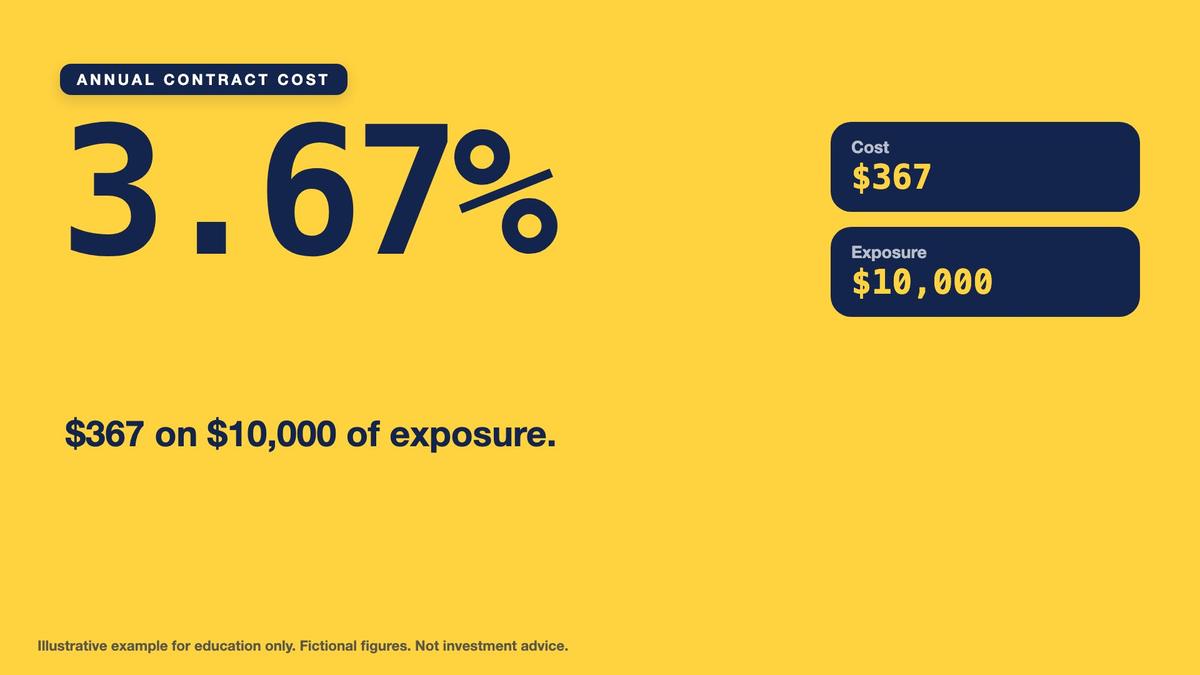
The invented overnight swap or financing cost is $1 per night for the complete five-ounce position. Holding for 30 nights produces $30 in swap charges, which combines with the $2 round-trip spread friction for $32 total cost. Since the position changes $5 for each $1 gold price movement, the favorable underlying reference move required to offset $32 is $32 divided by $5, or $6.40 per ounce. Relative to the $2,000 starting reference, this is 0.32%. Holding for 365 nights produces $365 swap plus $2 spread, totaling $367 or 3.67% of the $10,000 reference notional. The calculation assumes the swap remains fixed throughout, which is not guaranteed in real contracts.
Compare First-Year Costs and Holding-Period Suitability
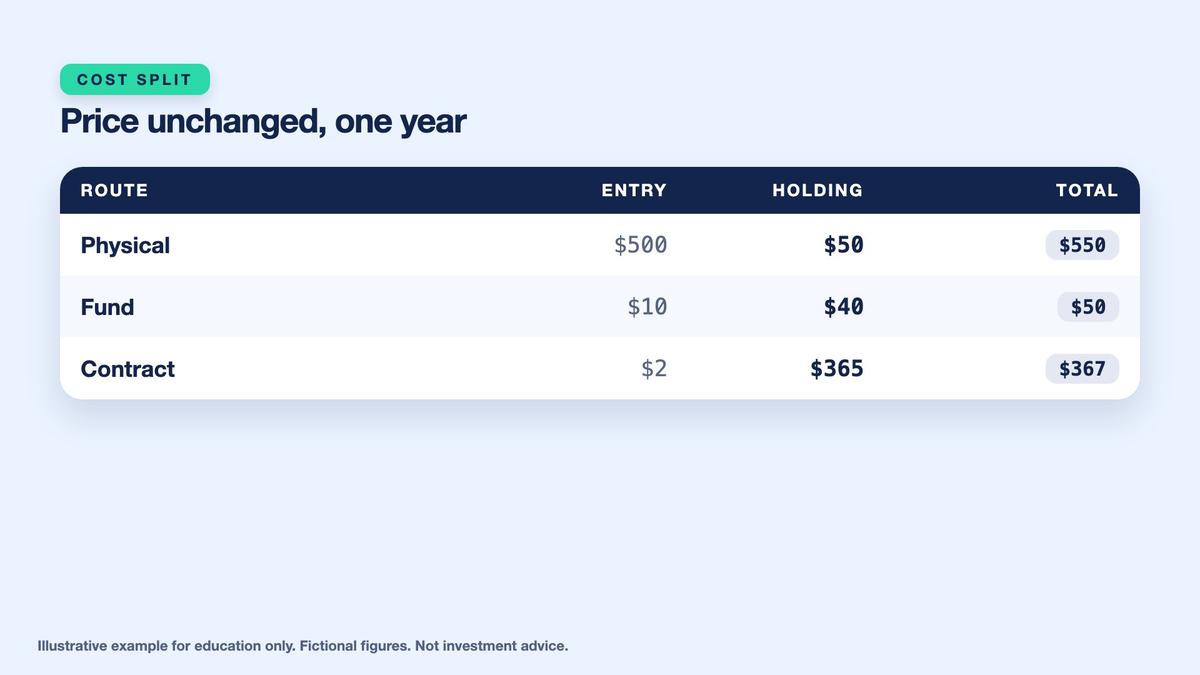
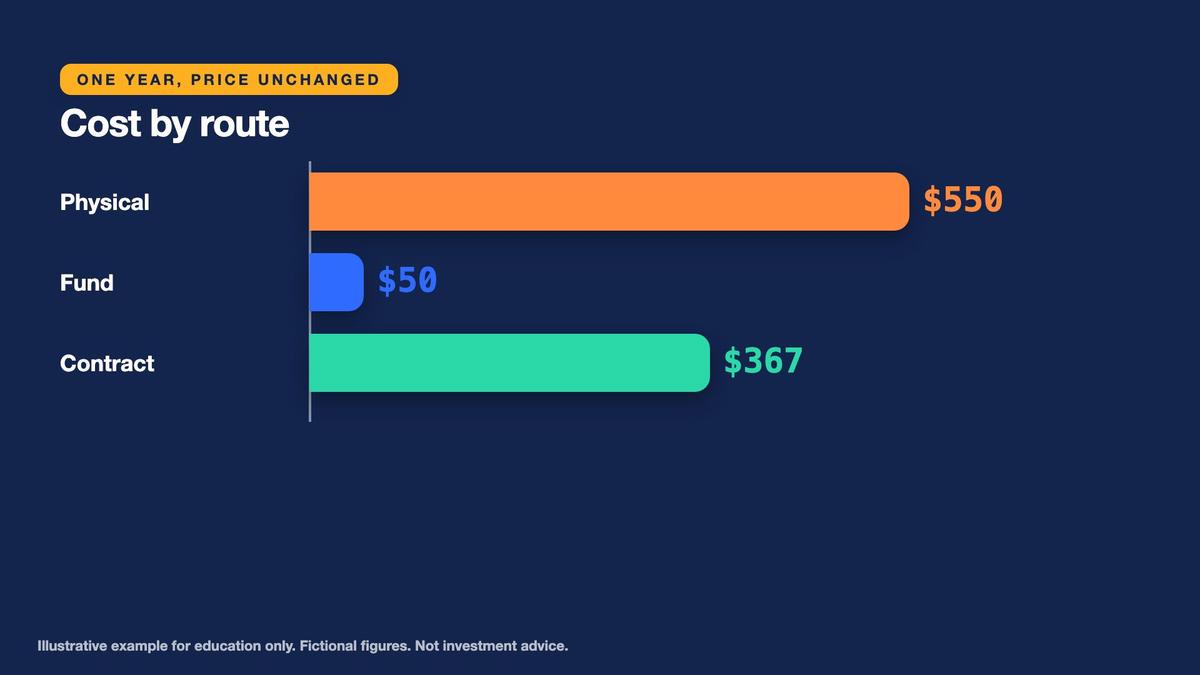
At an unchanged $2,000 gold reference, the physical route loses $550 after accounting for the dealer's initial premium, repurchase discount and one year of storage. The fictional listed fund loses $50 after the $10 bid-ask friction and simplified $40 annual expense. The XAUUSD contract incurs $367 in combined spread and overnight swap costs after 365 nights, assuming no other charges. These numbers should not be mistaken for guaranteed future costs; each is derived from invented pricing arrangements. They demonstrate that similar underlying gold exposure can produce different outcomes purely through the chosen ownership and execution structure.
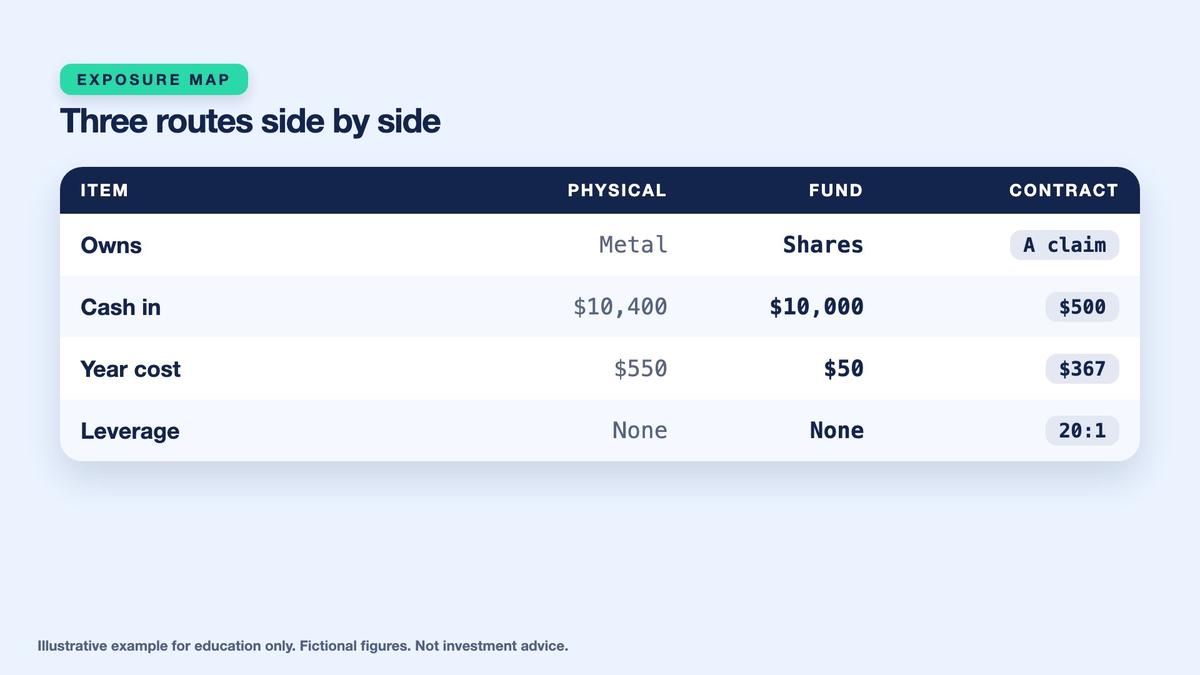
The cash required also differs. The physical purchase costs $10,400 despite representing five ounces at the $10,000 spot reference. The listed product costs $10,000 for 500 shares at the stated ask. The leveraged XAUUSD contract requires only $500 initial margin for approximately $10,000 of exposure, but the remaining notional is not a freely owned asset purchased at a discount. Leverage magnifies changes in account equity relative to the posted collateral and may trigger forced closure. Comparing costs only as a percentage of margin can distort the economic exposure, so use consistent notional references alongside the margin figures.
Key points
- First-year costs with the price unchanged: physical $550, fund $50, contract $367 after 365 nights.
- Cash needed differs: $10,400, $10,000 and $500 of margin; do not compare them as identical downside.
- The contract is cheap to enter ($2 spread) but costs 3.67% a year to hold ($367 on $10,000).
Holding-period suitability depends on the investor's purpose and the instrument's mechanics. Physical metal introduces upfront premium and custody responsibilities. Listed funds provide securities-market access and recurring expenses, but exchange sessions and market liquidity constrain trading. Broker CFDs can display narrow entry spreads but accumulate financing charges and expose the customer to leverage, liquidation and broker solvency. No instrument is universally superior simply because it has a lower spread or smaller initial cash requirement. This course does not recommend a holding period or allocation. The educational task is to identify which costs recur, which risks remain, and whether the instrument's legal structure matches the hypothetical objective.
Apply a Fictional 10% Price-Up Scenario
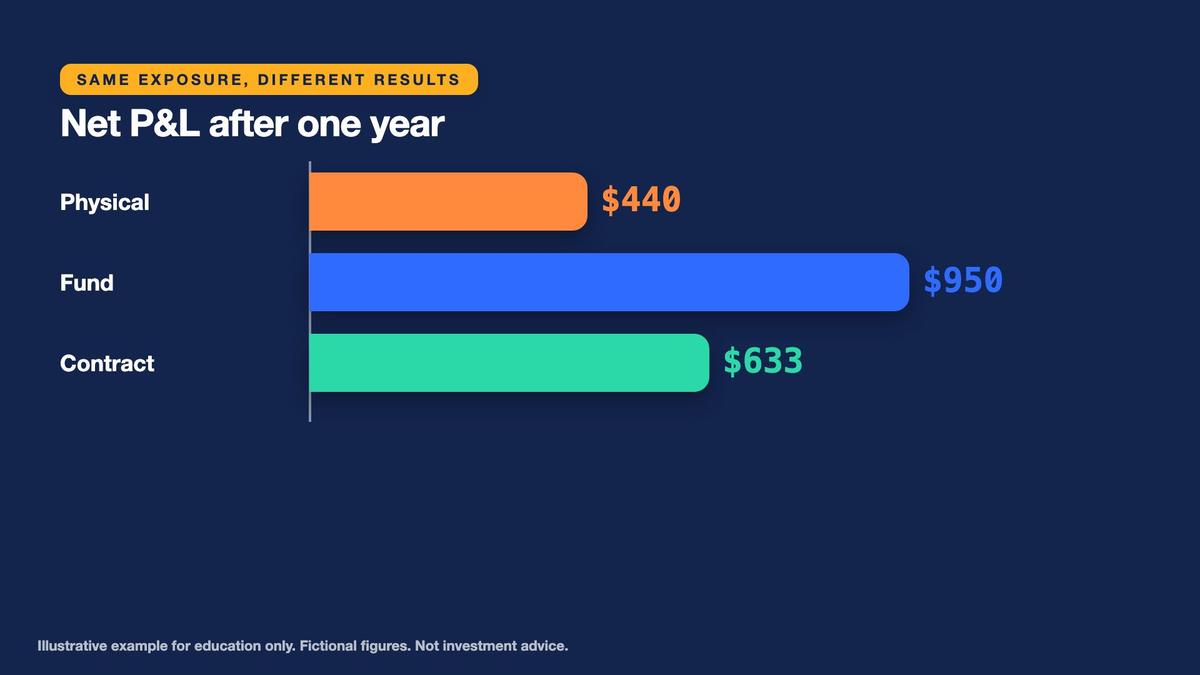
To compare net outcomes, imagine gold's reference price rises 10% over one year, from $2,000 to $2,200 per troy ounce. This is an illustrative scenario, not a prediction or historical result. For physical metal, the dealer's 1% repurchase discount produces an ending buyback price of $2,200 multiplied by 0.99, or $2,178 per ounce. Five ounces sell for $10,890. After subtracting the original $10,400 purchase cost, gross realized profit is $490. Deducting the $50 annual storage expense leaves $440 net profit under the fictional assumptions.
For the listed Sample Gold Fund, the underlying gold representation of 0.01 ounce per share gives an approximate ending midpoint reference of $22.00 per share at $2,200 gold. Our invented exit bid is $21.98. Selling 500 shares produces $10,990. Subtracting the $10,000 purchase cost gives $990 before the annual expense assumption. Deducting the simplified $40 expense produces $950 net profit. The exercise deliberately holds the annual expense at $40 based on initial capital rather than dynamically applying the expense ratio to changing net asset value. A real fund would generally reflect expenses through its NAV and actual return path.
Key points
- An illustration, not a forecast: gold rises 10% to $2,200.
- Physical: 5 x 2,178 = $10,890; net +$440 after the $10,400 cost and $50 storage.
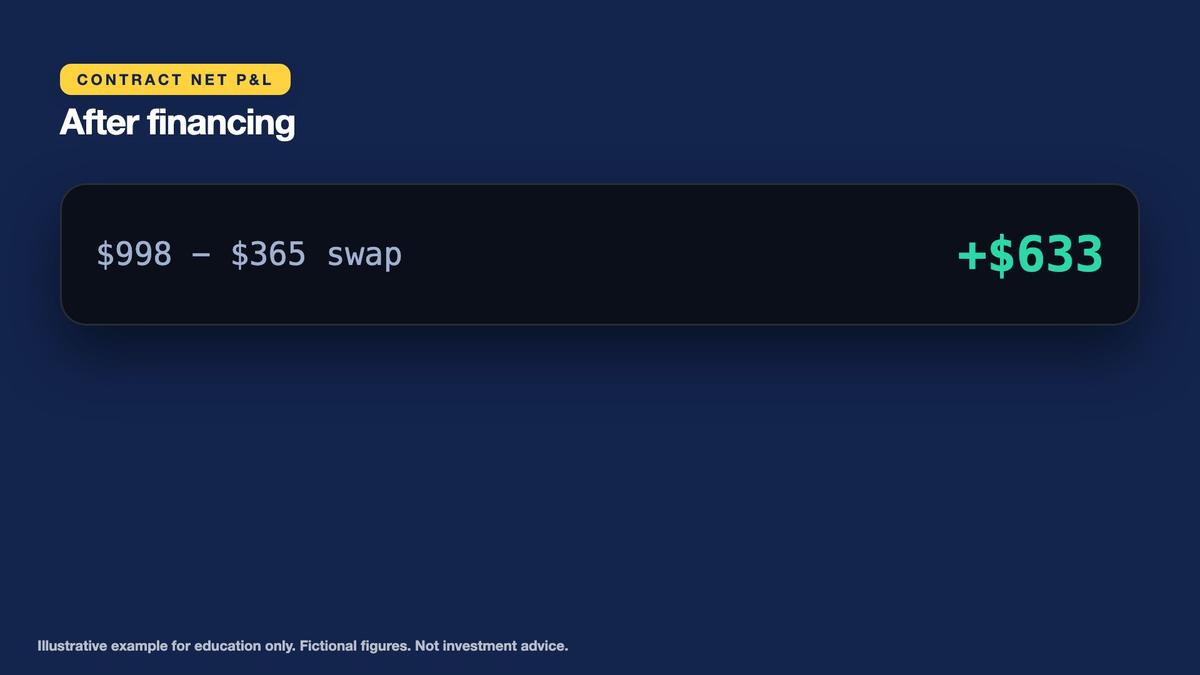
- Fund +$950 (10,990 - 10,000 - 40); contract +$633 (5 x 199.60 = $998 gross, minus $365 swap).
For the XAUUSD contract, the initial long position entered at the $2,000.20 ask. Assume the ending broker bid is $2,199.80 when the underlying reference is $2,200. The executable difference is therefore $199.60 per ounce. Multiplying by five ounces gives $998 gross contract profit, already incorporating the entry and exit spread. The 365-night financing charge is $365, so net contract profit is $633 before any other charges. The three resulting profits are $440 physical, $950 listed fund and $633 broker contract. Their differences reflect invented ownership costs, execution quotations and financing, not investment recommendations or general performance rankings.
Understand Margin Stop-Out and Counterparty Risk
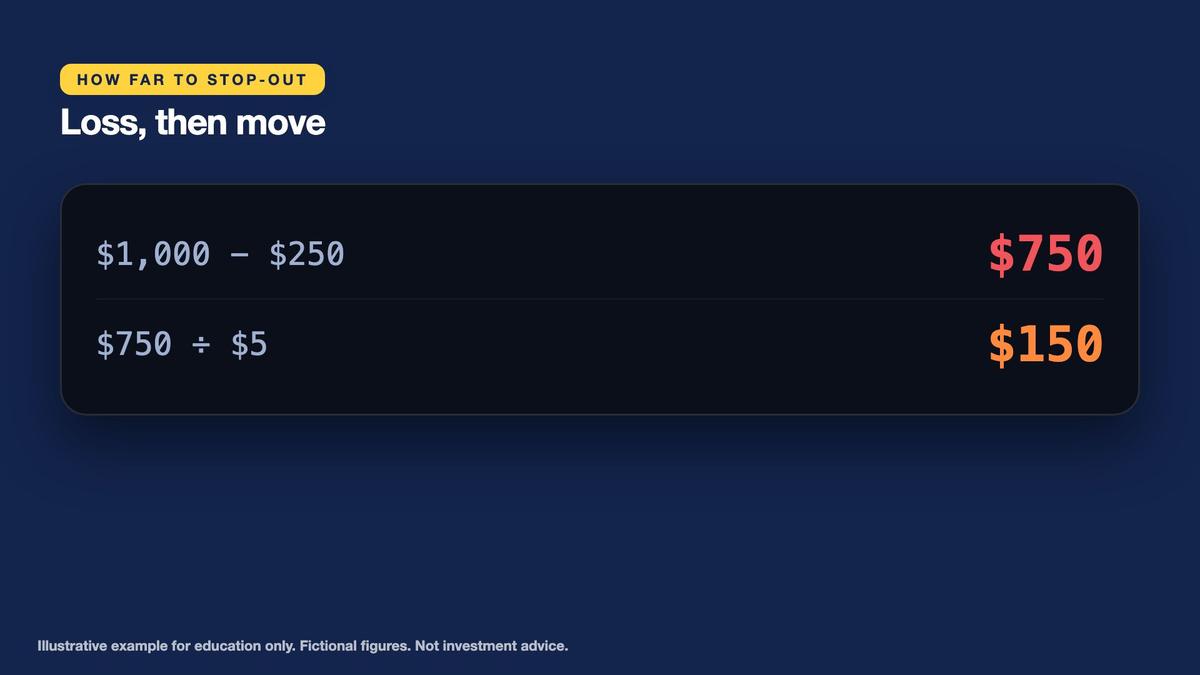
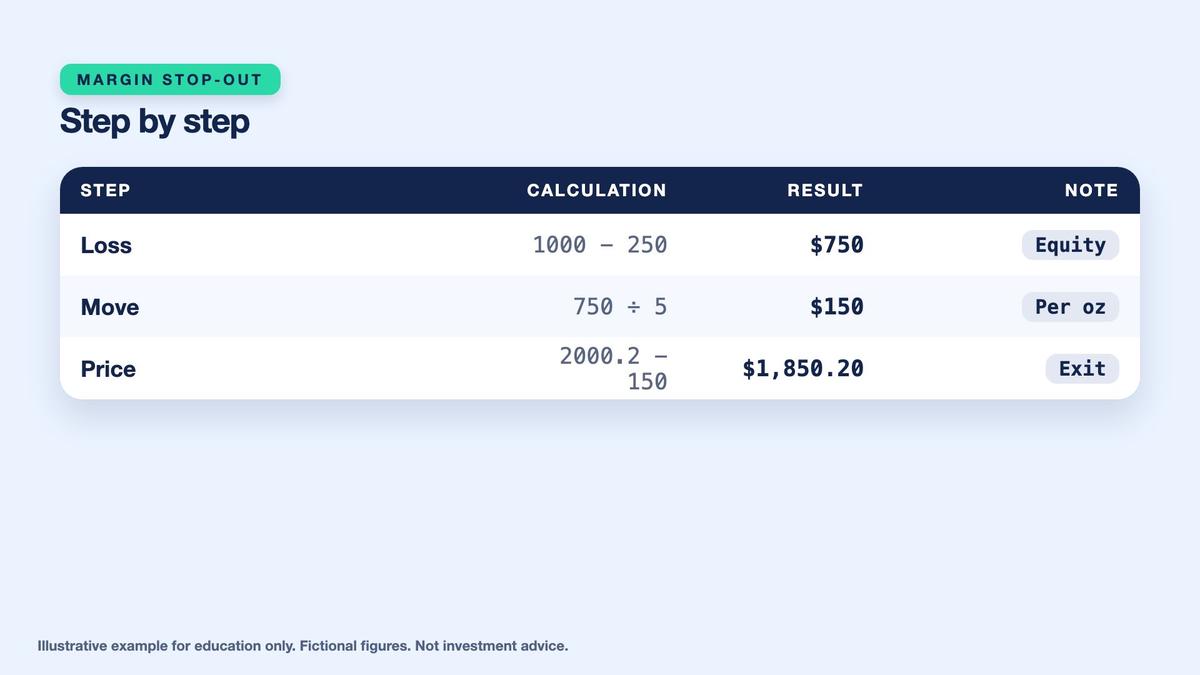
The fictional XAUUSD contract creates leveraged exposure with only $500 used margin. Now assume the simulated account has $1,000 initial equity, and the broker's simplified stop-out rule closes positions when equity falls below 50% of used margin. Half of $500 is $250. Equity must therefore decline from $1,000 to the $250 threshold, a $750 loss. With five ounces of exposure, each $1 adverse movement produces $5 loss. Dividing $750 by $5 gives a $150 adverse price change. These calculations use constant position size and margin, and ignore financing, commissions, changing spread and slippage.
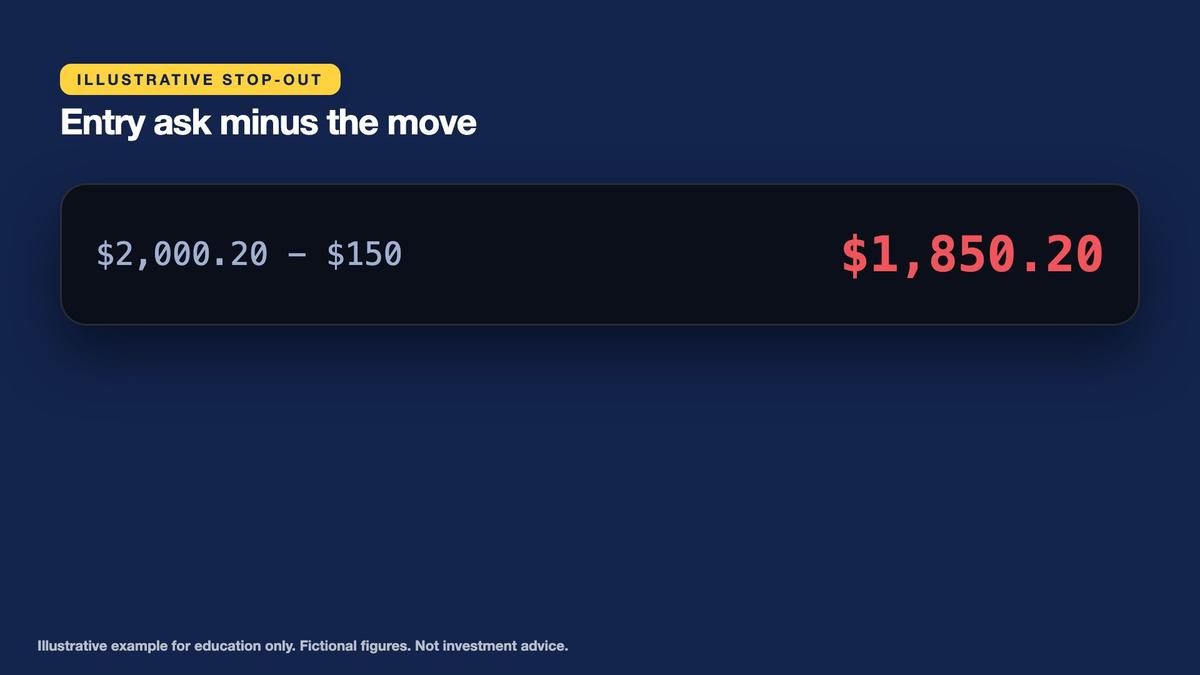
Starting from the fictional $2,000.20 long entry ask, subtracting $150 gives an illustrative closing-price level of $1,850.20. The $150 decline represents approximately 7.5% of the $2,000 starting spot reference. Because the stated stop-out rule activates when equity falls below $250, the mathematical level is a boundary rather than a guarantee of execution at precisely $1,850.20. Actual brokers can calculate equity and margin using different mark prices, dynamic requirements, hedged positions, financing, commissions and liquidation policies. Gaps or thin liquidity can cause forced closure at worse levels, and losses may exceed the simple illustration.
Key points
- Stop-out example: equity $1,000, margin $500, positions close below 50% of margin = $250.
- A $750 loss at $5 per $1 is a $150 move; 2,000.20 - 150 = $1,850.20, about 7.5%.
- Real brokers can close earlier; counterparty and custody risks differ for every route.
Counterparty and custody exposures also differ between routes. Physical bullion may avoid a broker's contractual performance obligation but remains exposed to dealer authenticity, storage, theft and insurance arrangements. A listed gold fund depends on its legal structure, asset custody, administrator, trading venue and any relevant intermediaries. A broker CFD depends on the provider's pricing, settlement, margin, withdrawal and solvency arrangements. The earlier lessons on margin and leverage, exchange versus self-custody, and wallet safety introduced ways to map these dependencies. The correct research question is not merely how closely the quote tracks gold, but what the learner owns, who owes performance and how failure would affect recovery.
Final Checkpoint: Build the One-Page Gold Exposure Map
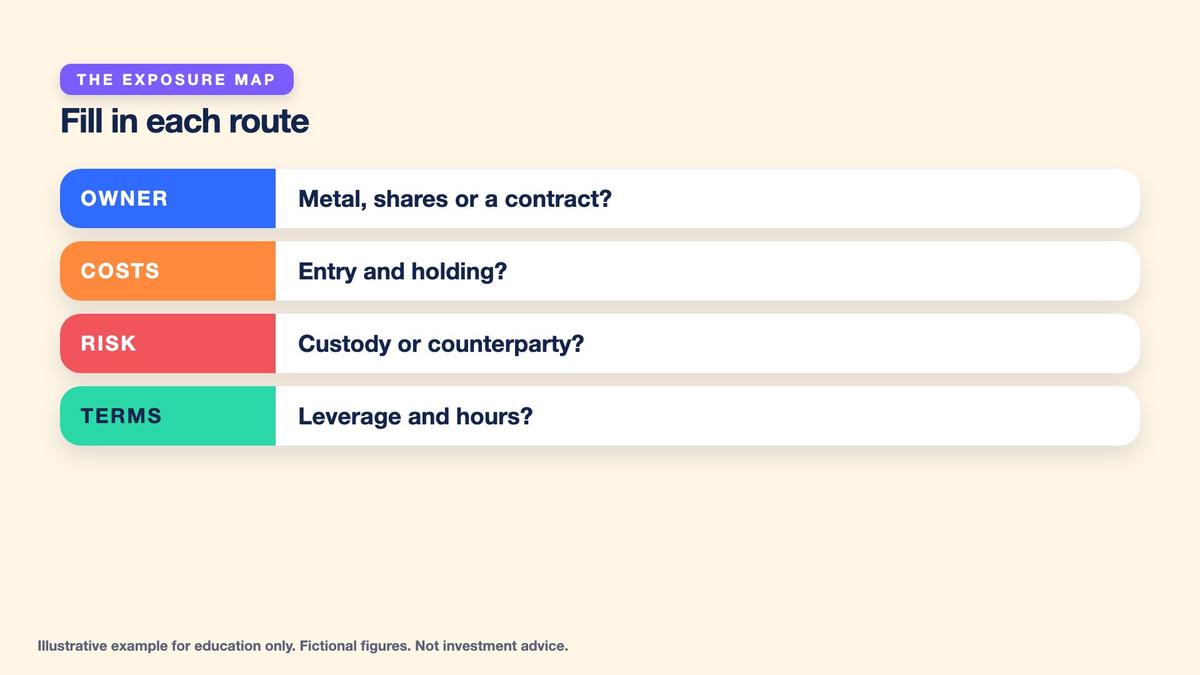
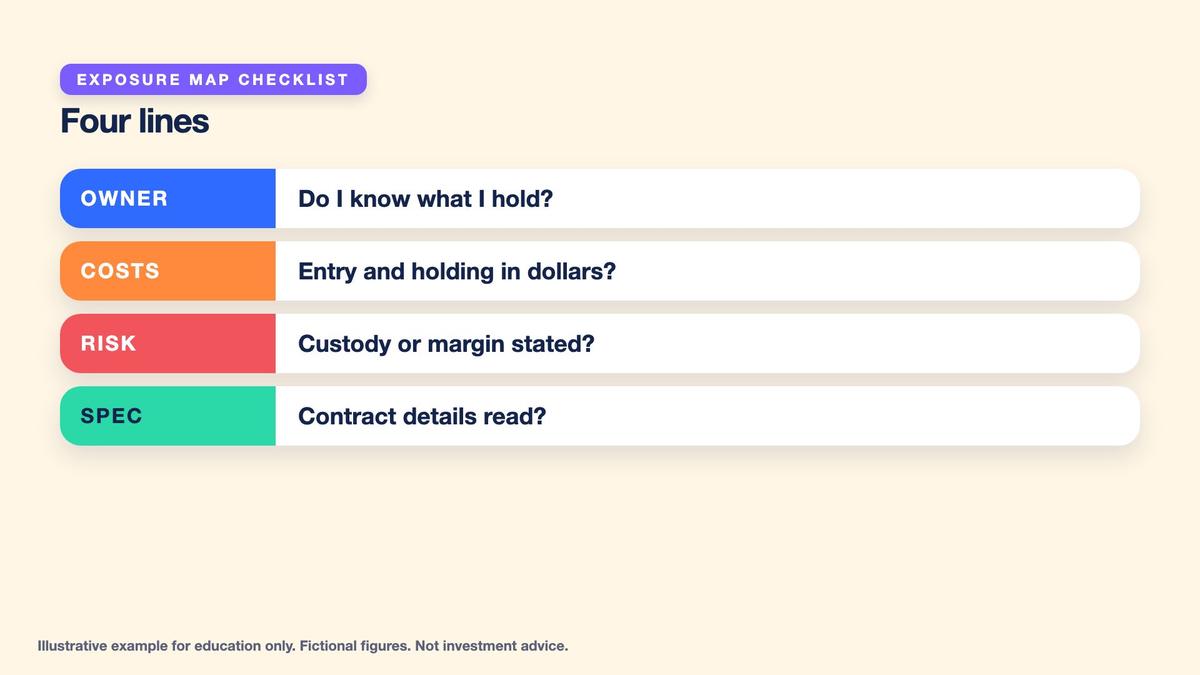
Complete a three-column comparison for physical gold, Sample Gold Fund and the fictional XAUUSD broker contract. Include the underlying gold quantity, unit conventions, initial cash requirement, legal ownership, counterparties, custody, entry price, sale price, round-trip friction, annual costs, trading hours, leverage and recovery responsibilities. Verify that five troy ounces equal 155.5175 grams and 0.05 of the fictional broker's 100-ounce lot. Record that the physical purchase requires $10,400, the listed fund requires $10,000, and the leveraged broker contract requires $500 initial margin for approximately $10,000 underlying exposure. These cash amounts are not interchangeable measures of total risk.

Practice Lab: Map Three Fictional Routes to Gold Exposure
Use only the invented sample-date price of $2,000 per troy ounce, the fictional physical dealer, Sample Gold Fund, and the fictional CFD-style XAUUSD broker instrument. Start with $10,000 of underlying gold exposure, equal to five troy ounces, and use 31.1035 grams per troy ounce. Record the actual cash required by each route rather than assuming it equals underlying notional. Compare ownership, dealer premium, buyback price, storage, fund bid-ask spread, expense ratio, broker spread, 20:1 leverage, margin and nightly financing. Calculate first-year unchanged-price costs, apply the separate illustrative 10% gold price increase, and stress-test the broker margin account. Clearly label annual expense and swap assumptions as simplified fixed amounts, and keep market exposure separate from the amount of cash committed. Complete a one-page table covering ownership, counterparties, trading hours, custody and recovery. Do not use real brokers, funds, dealers, market prices or trading accounts.
- Decision 1: Gold's invented reference is $2,000 per troy ounce. The exposure target is $10,000. One troy ounce equals 31.1035 grams, and the fictional broker defines one standard lot as 100 ounces. — Calculate the exposure in ounces, grams and broker lots, and explain why these units must be checked before comparing instruments.
- Decision 2: The fictional dealer charges 4% above the $2,000 reference to purchase five ounces, buys back at 1% below unchanged spot, and charges $50 annual storage. — Calculate physical purchase cost, unchanged-price resale proceeds, annual round-trip loss, and the percentage loss relative to cash paid.
- Decision 3: Sample Gold Fund represents 0.01 ounce per share. Its ask is $20.00, bid is $19.98 and annual expense ratio is 0.40%; the hypothetical broker quotes $1,999.80 bid and $2,000.20 ask with $1 per night financing for five ounces. — Calculate the fund's unchanged-price first-year cost and the broker contract's 30-night cost and favorable reference break-even movement.
- Decision 4: The fictional gold reference rises from $2,000 to $2,200 after one year. The dealer buys back at 99% of spot, the fund exits at $21.98 per share with a fixed $40 expense, and XAUUSD exits at $2,199.80 after entering at $2,000.20 and paying 365 nights of $1 swap. — Calculate the net financial result of each route and explain why equal underlying exposure does not imply equal P&L.
- Decision 5: The fictional XAUUSD broker offers 20:1 leverage on five ounces. An account has $1,000 equity and $500 used margin. The stated stop-out rule applies when equity falls below 50% of used margin. — Calculate the equity threshold, loss to that threshold, adverse price change and approximate closing-price level, then complete the ownership and counterparty checklist.
Answer key
Reconcile the unchanged-price first-year cost illustration: $550 physical, $50 listed product and $367 broker CFD after 365 nights. Confirm that the contract's 30-night combination of $30 financing and $2 spread requires a $6.40 favorable reference move to break even. Then apply the hypothetical 10% underlying gold price increase and verify $440 physical net profit, $950 listed-fund net profit and $633 contract net profit. For the margin case, confirm $1,000 equity, $500 used margin, $250 stop-out threshold, $750 adverse loss capacity and $1,850.20 approximate closing-price boundary under the simplified rules.
Key points
- Build a one-page map: owner, counterparty, costs, trading hours, leverage, custody and recovery.
- Reconcile $550, $50 and $367, and the 30-night total of $32.
- State purpose and horizon without recommending a route, and read the real instrument specification first.
Finish by writing the purpose and horizon of the hypothetical exposure without recommending any particular route. Read each invented instrument's terms as though reviewing a real contract specification: the lot multiplier, quote units, bid and ask, spread, fee base, financing schedule, margin requirements, market opening hours, redemption rights, asset custody and provider obligations. Preserve all inputs and assumptions in a dated research journal. The previous ETF, order execution, leverage, custody and wallet-safety lessons provide the supporting concepts. The outcome is an accurate comparison of physical ownership, listed product shares and broker XAUUSD exposure, including why the same gold reference can produce different net results and failure modes.
Worked example at a glance
Key terms
- Gold exposure: how the value of a holding or contract responds to the gold price.
- Troy ounce: the unit gold is priced in: 31.1035 grams.
- XAUUSD: the notation for gold quoted in US dollars per troy ounce.
- Premium: the amount a dealer charges above the spot price.
- Buyback price: what a dealer pays when you sell back, here spot minus 1%.
- Expense ratio: the yearly fund charge, here 0.40%.
- Spread: the gap between the bid and the ask.
- Leverage: exposure that is a multiple of the margin posted, here 20:1.
- Margin: collateral that supports a leveraged position; not ownership and not a loss limit.
- Swap: the overnight financing charge on a leveraged position.
- Stop-out: the level at which a broker closes positions as equity falls.
- Counterparty: the other party you rely on to honor a contract.
Multi Asset Trading Lab provides educational information only and does not constitute personalized investment, trading, financial, legal, tax, accounting, commodities, brokerage, custody or risk-management advice. All market quotations, dealer prices, fund structures, broker terms, contract sizes, expense ratios, financing charges, storage costs, leverage settings, margin requirements, price scenarios and financial outcomes in this lesson are fictional teaching assumptions. The $2,000 gold price is invented for a sample date and is not a real or current gold market quote. No real gold dealer, listed fund, broker, investment product, ticker, account or trading venue is identified or recommended. XAUUSD is used only as the conventional notation for gold quoted in US dollars per troy ounce, not as a recommendation to trade a particular broker instrument. All activities use simulated money and classroom calculations; no purchase of bullion, securities, derivatives or other financial assets is required or encouraged. The underlying gold exposure target of $10,000 represents five troy ounces at the fictional $2,000 reference. The weight conversion uses 31.1035 grams per troy ounce, yielding 155.5175 grams for five ounces and 3,110.35 grams for 100 ounces. The broker's standard lot is defined as 100 ounces solely for the fictional example, so five ounces equal 0.05 lot. Real brokerage specifications may differ materially, and learners must verify units, contract multipliers and settlement methods before interpreting an actual instrument. The physical gold example assumes a fictional dealer charges 4% above reference spot, resulting in a $2,080 per-ounce purchase and $10,400 cash cost for five ounces. The dealer buys back at 1% below spot, or $1,980 per ounce when the reference is unchanged, giving $9,900 resale proceeds. The $500 transaction loss plus $50 annual storage produces $550 first-year loss, approximately 5.29% of the $10,400 purchase cost. Physical ownership does not guarantee protection against theft, loss, damage, counterfeiting, disputed title, unexpected resale discounts, storage provider failure, uninsured events or liquidity shortages. The phrase no counterparty on the metal itself assumes authentic metal has been legally delivered and owned outright; reliance on dealers, insurers, vaults or storage arrangements can still introduce counterparty and recovery risks. Insurance costs are not included beyond the specified $50 storage assumption, and real expenses may vary. The fictional Sample Gold Fund assumes each share represents exposure backed by 0.01 troy ounce of gold, so 500 shares represent five ounces. The invented $20.00 ask and $19.98 bid produce a $0.02 spread, approximately 0.10% of the $19.99 midpoint. Buying 500 shares costs $10,000, and an unchanged-price sale at the $19.98 bid produces $10 of trading friction. The invented annual expense ratio of 0.40% is applied to initial capital as a simplified fixed $40 amount, giving $50 total first-year cost or 0.50% of purchase notional. Actual investment funds generally accrue expenses within fund assets or net asset value over time, and market prices may reflect tracking differences, premium or discount to NAV, changes in underlying metal entitlement, fund structure, trading commissions or other expenses excluded from this illustration. The fictional fixed $40 expense is a classroom simplification and should not be treated as the actual behavior of an expense ratio in a rising or falling market. Fund shareholders own securities or contractual rights under fund documents, not necessarily individually allocated or directly redeemable physical metal. Funds can face custody, issuer, administrator, legal, liquidity, market-access and redemption risks, and listed products generally trade during applicable exchange sessions. The fictional CFD-style XAUUSD broker instrument gives only contractual price exposure and does not convey ownership of physical gold. The stipulated broker bid is $1,999.80 and ask is $2,000.20, giving a $0.40 spread or 0.02% of the $2,000 midpoint. The five-ounce position changes in gross value by $5 for each $1 movement per ounce. The example assumes 20:1 leverage, meaning the $10,000 underlying reference exposure requires $500 initial margin. Margin is collateral supporting a larger notional exposure and is not a guaranteed loss limit or proof of physical gold ownership. Real brokers can change margin requirements, use different prices for calculating equity, restrict trading, widen spreads, impose commissions or financing charges, and liquidate positions under terms unlike this example. The fictional round-trip spread is $0.40 per ounce, or $2 for five ounces. A fixed $1 nightly swap charge for the whole position gives $30 financing over 30 nights and $365 over 365 nights. The simplified 30-night total cost is $32, requiring a favorable $6.40 underlying reference movement at $5 gross profit per $1 price move to offset the spread and financing, equal to 0.32% of the invented $2,000 reference. The 365-night total is $367, equal to 3.67% of $10,000 reference notional. Actual overnight financing may vary by time, instrument, position direction, market rates, calendars or broker methodology and may not be constant or even have the same payment direction in every case. The simplified spread and swap examples exclude commissions, conversion fees, slippage, changing spread, margin interest not specified and other costs. The illustrative one-year gold price increase of 10%, from $2,000 to $2,200, is not a forecast, historical return or probability estimate. Under that invented scenario, physical gold sells back for five times $2,178, producing $10,890 proceeds and $440 profit after the $10,400 purchase cost and $50 storage. The fictional listed product's ending reference is approximately $22 per share, while its stipulated $21.98 bid yields $10,990 proceeds for 500 shares and $950 profit after subtracting initial $10,000 purchase cost and the simplified $40 annual expense. The CFD-style contract enters at the fictional $2,000.20 ask and exits at the $2,199.80 bid, producing $998 gross profit across five ounces before $365 financing, or $633 net profit. These outcomes are determined by route-specific assumptions, not evidence that any route will outperform another in actual markets. The $10,000 reference exposure requires different cash or margin amounts across routes: $10,400 for physical purchase, $10,000 for listed shares and $500 initial margin for the leveraged contract. These amounts must not be compared as though they represent identical downside exposure or ownership rights. The fictional stop-out example begins with $1,000 account equity, $500 used margin and a threshold of 50% of used margin, or $250 equity. Reaching that boundary from $1,000 requires a $750 loss. At $5 loss per $1 adverse movement, the resulting movement is $150 per ounce, giving an illustrative $1,850.20 closing-price boundary from the $2,000.20 opening ask. The stated fictional rule activates when equity falls below $250; reaching exactly $250 identifies the simplified mathematical boundary, not necessarily an execution event. The corresponding $150 price move is approximately 7.5% of the $2,000 reference. Real brokers may liquidate earlier or later according to mark prices, variable margin, margin tiers, collateral offsets, account conditions, spread widening, financing, transaction costs, platform rules or market movements. Forced liquidation can occur at worse prices than indicated, and actual losses can exceed simplified model expectations or deposited collateral under certain conditions. Leveraged trading can be inappropriate or exceptionally risky for beginners, and this course does not encourage opening real leveraged positions. The educational exposure map highlights ownership, counterparty, entry cost, holding cost, trading hours, leverage, custody and recovery responsibilities. Physical gold, listed securities and broker derivatives have fundamentally different legal rights, liquidity constraints, fee structures and failure modes. Earlier lessons on ETF expense ratios, bid-ask spreads and slippage, margin and leverage, counterparty exposure, custody, and wallet safety explain related principles but do not provide guarantees of safe outcomes. All sample figures, calculations and comparison results are hypothetical, and no illustrated profit, cost or break-even calculation predicts future gold prices or actual investment returns. The lesson's purpose is to identify and compare instrument mechanics before any independent evaluation, not to rank products, recommend holding periods, suggest asset allocations, or advise buying, selling, borrowing against, or trading gold or any related security or derivative. No real-money activity is required or encouraged.
Lesson Checkpoint
Review what you learned and get feedback on your work.