



In this eleven-minute beginner lesson, learners examine Bitcoin's basic network design and compare the supply, demand, ownership, and failure assumptions of two entirely fictional digital assets: Capped Coin and Flexible Token. Learners distinguish maximum supply from circulating supply, calculate issuance rates and post-halving supply growth, compare circulating market capitalization with fully diluted valuation, and measure token-holder dilution and potential unlock pressure. Simplified demand illustrations demonstrate why price depends on market participation rather than scarcity alone, while volatility and drawdown exercises reinforce the importance of risk limits. The lesson culminates in a one-page comparison of supply rules, token distribution, demand drivers, failure scenarios, and evidence that would change a research thesis. All prices, valuations, transactions, and scenarios are hypothetical, use simulated money only, and are not forecasts or investment advice.
Bitcoin, Blockchain Rules and the Meaning of a Token
Bitcoin is a decentralized digital network that maintains a shared transaction ledger. Instead of one central organization updating every balance, network participants use common rules to verify transactions and blocks. Bitcoin uses proof-of-work mining: miners expend computing resources to propose valid blocks, and the network's consensus rules determine which blocks are accepted. The system targets roughly ten minutes between blocks on average, although individual intervals vary. Its existing consensus rules limit eventual issuance to approximately 21 million coins. That supply limit is a protocol rule supported by network participants, not a promise that the asset will maintain any particular market value.

New Bitcoin enters circulation through block subsidies received by successful miners, alongside transaction fees paid by users. The subsidy halves every 210,000 blocks, approximately every four years at the network's target block interval. Over time, the subsidy declines, while the importance of transaction fees to miner revenue may increase. Bitcoin's security mechanism is proof of work, so referring to Bitcoin miners as proof-of-stake validators would be incorrect. Other blockchain systems can use validators, staking, and different issuance designs. Security ultimately depends on the network's rules, economic incentives, participants, and attack costs.

Key points
- Bitcoin is a network with a shared ledger and a fixed 21 million cap.
- New Bitcoin enters through block subsidies, which halve about every four years.
- A token is a digital unit defined by software; supply rules and demand are separate questions.
A token is a digital unit defined by a network's software or a smart contract. Depending on the system, tokens may represent payment units, governance rights, access to a service, participation incentives, or other functions. Creating a token can be technically straightforward on some networks, but creation alone does not establish usefulness or demand. Investors must ask who can issue new units, change rules, control administrative permissions, or distribute tokens. This lesson uses Bitcoin only to explain established network principles and compares two entirely fictional assets, Capped Coin and Flexible Token, without making price predictions.
Capped Coin: Maximum Supply, Circulation and Halving
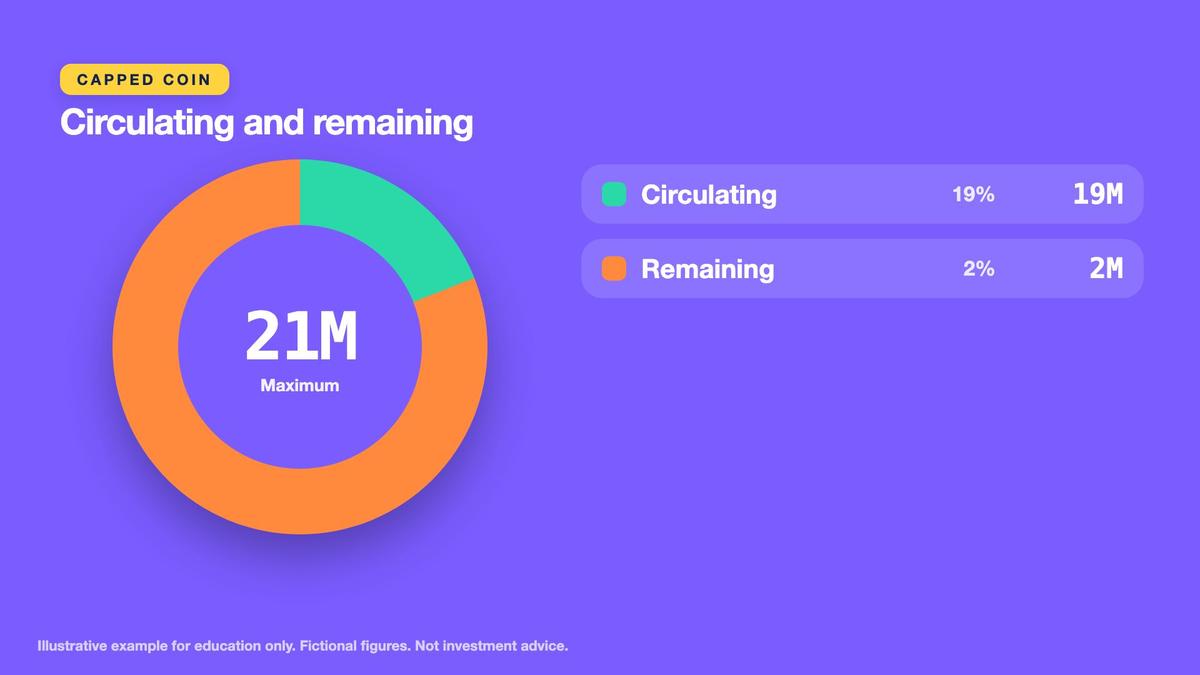
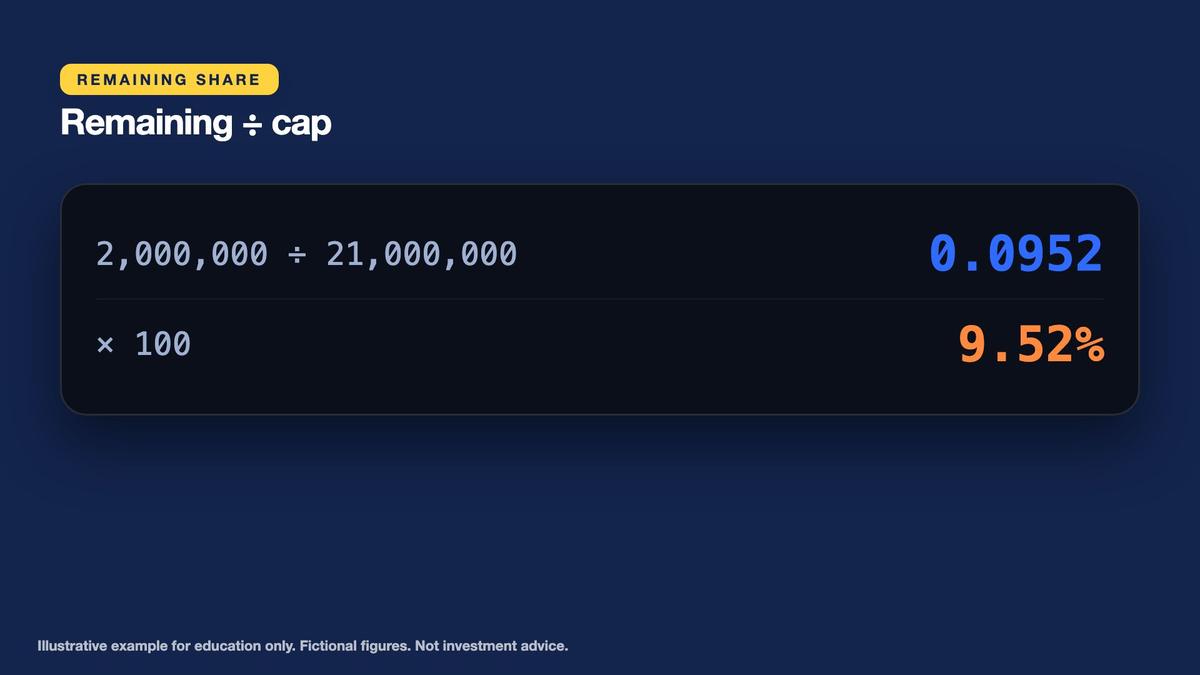
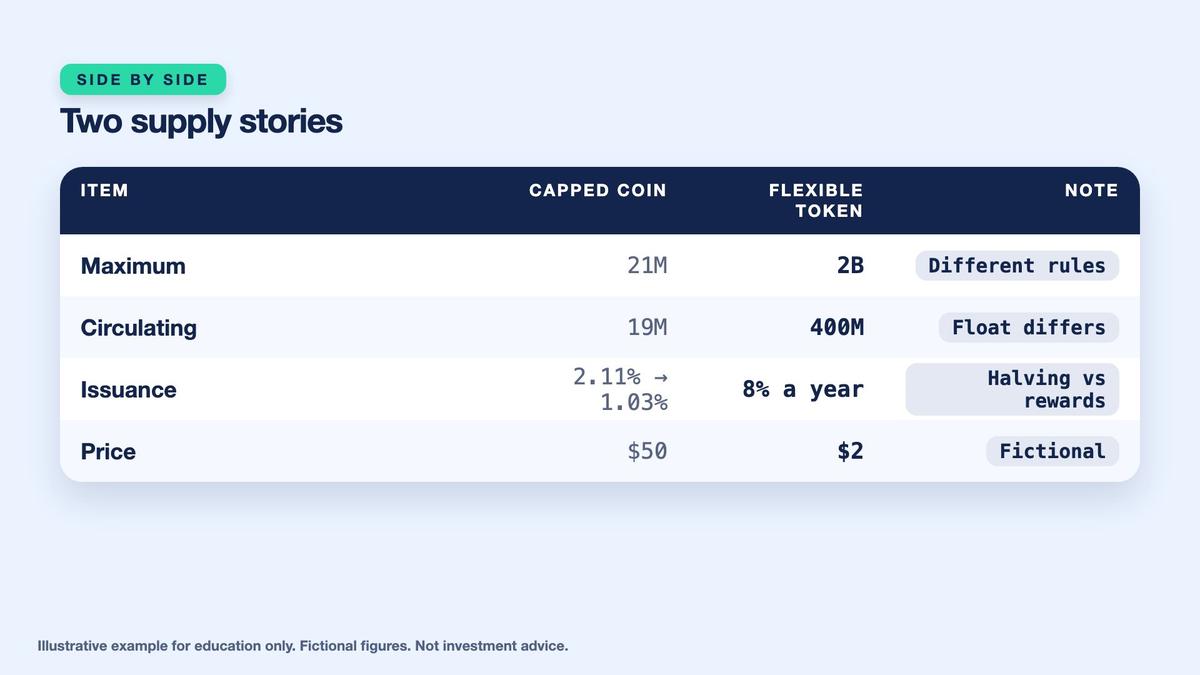
Our first hypothetical asset is Capped Coin, designed to resemble a capped-issuance digital asset for educational purposes. Its maximum supply is 21,000,000 coins, while 19,000,000 are currently circulating. The difference is 2,000,000 coins remaining for future issuance. Dividing that remainder by the maximum supply gives approximately 9.52% of the cap, or about 9.5% when rounded to one decimal place. Circulating supply describes coins counted as available under the example's stated definition, whereas maximum supply describes the upper limit of eventual issuance. Neither number, by itself, determines demand or a sustainable price.

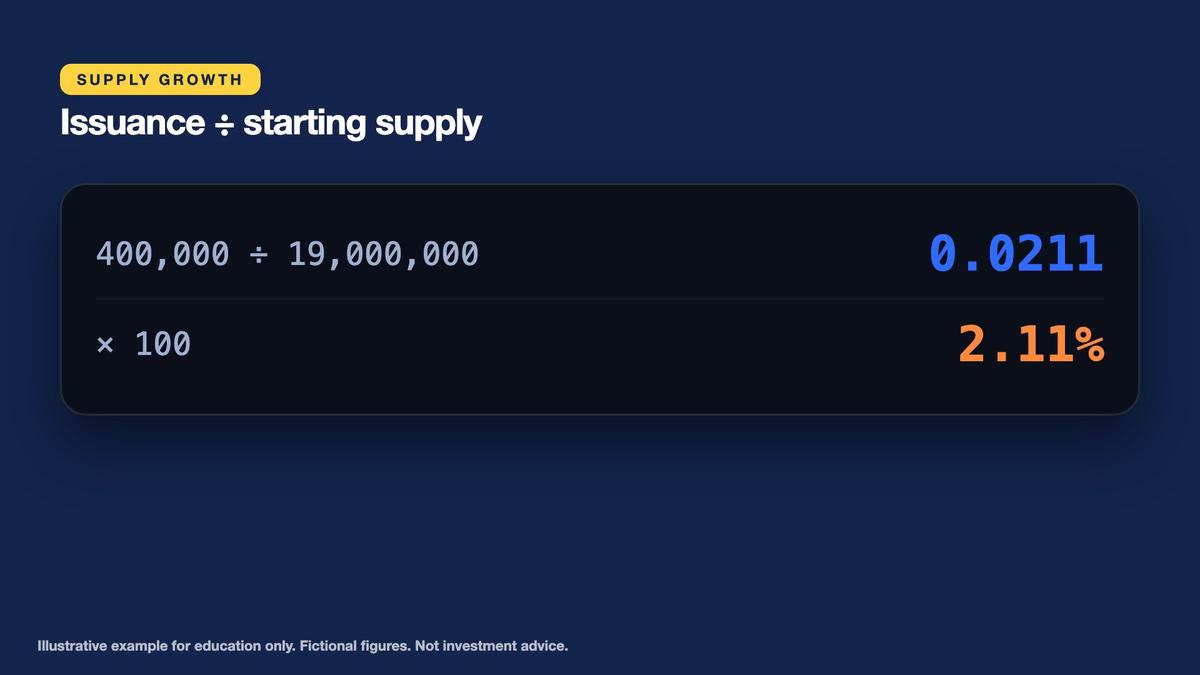
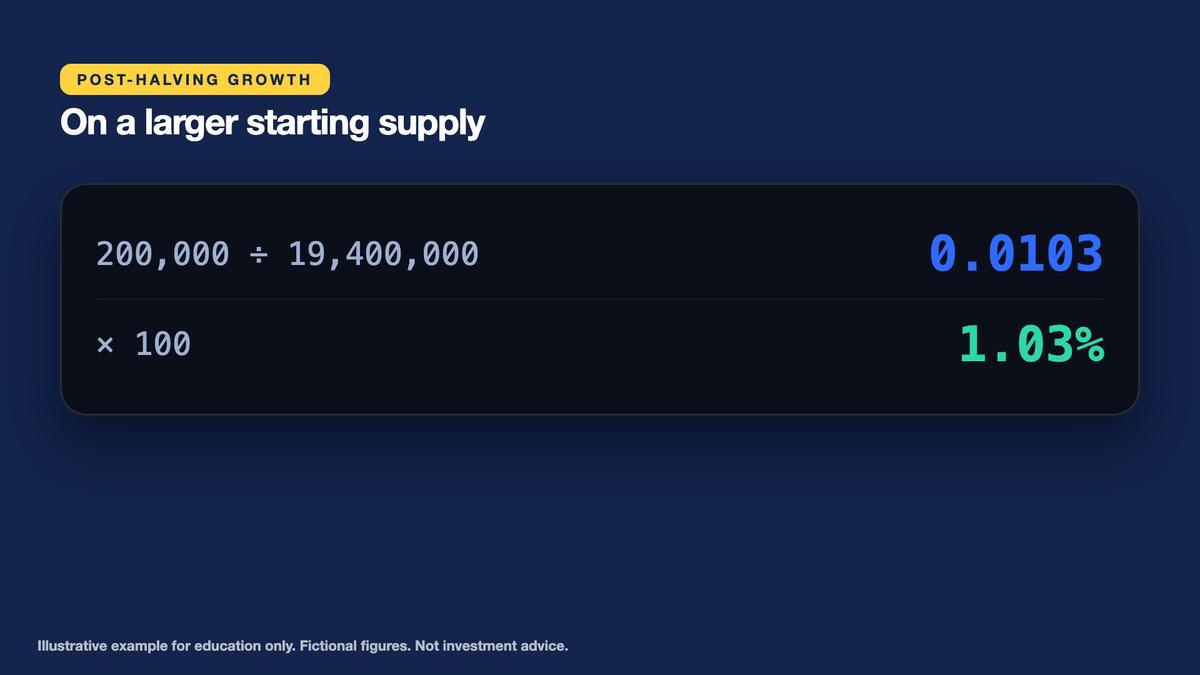
Suppose Capped Coin issues 400,000 additional units during the current year. Annual supply growth is defined here as newly issued units divided by the starting circulating supply: 400,000 divided by 19,000,000 equals approximately 2.1053%, rounded to 2.11%. At the end of that year, circulating supply becomes 19,400,000. If a subsequent halving reduces annual issuance to 200,000 coins, the next year's growth rate uses 19,400,000 as the new starting denominator. The resulting rate is approximately 1.0309%, or 1.03%. Using the correct starting supply for each period prevents misleading comparisons.
Key points
- Capped Coin: maximum 21,000,000, circulating 19,000,000, remaining 2,000,000 (9.52%).
- Supply growth = 400,000 / 19,000,000 = 2.11%; after a halving 200,000 / 19,400,000 = 1.03%.
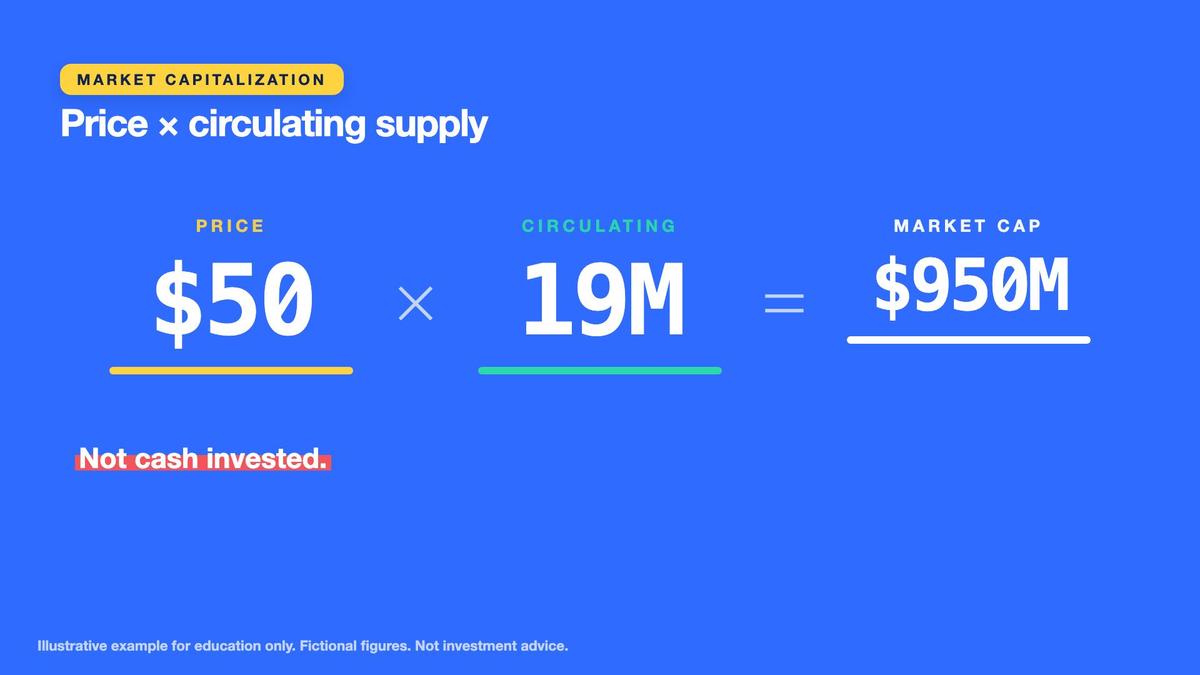
- Market cap = $50 x 19,000,000 = $950 million; it is a valuation, not cash invested.
At a fictional price of $50 per coin, multiplying the initial circulating supply of 19,000,000 by the price gives circulating market capitalization of $950 million. Market capitalization is a valuation derived from the marginal market price and supply; it is not a treasury reserve or the amount of cash investors collectively contributed. A declining issuance schedule can reduce the rate at which new supply becomes available, but cannot guarantee demand. A capped asset may still experience weak adoption, competing technologies, liquidity shortages, or declining confidence. Supply discipline is one input into analysis, not proof of value.
Demand, Liquidity and Why Scarcity Is Not Enough
Digital asset prices emerge from interactions between buyers and sellers. Demand may reflect transaction utility, confidence in a network's monetary properties, perceived scarcity, expectations of future adoption, speculative interest, leverage, or available liquidity. Supply includes existing holders willing to sell, newly issued units, unlocked balances, and the depth of offers in the market. A token can have a strict numerical cap and still lack willing buyers. Scarcity creates a constraint on quantity, but economic value also requires participants to regard the asset as useful, desirable, or exchangeable.
Consider a deliberately artificial demand illustration for Capped Coin. The starting circulating capitalization is $950 million at $50 per coin. Suppose $95 million of hypothetical added demand is treated, solely for classroom arithmetic, as increasing capitalization by an equal $95 million while circulating supply remains 19 million. The modeled capitalization becomes $1,045 million, and dividing by 19 million coins gives an implied price of $55, exactly 10% higher than $50. This calculation demonstrates a proportional valuation assumption; it is not an empirical rule explaining how cash inflows determine cryptocurrency prices.

Key points
- Demand can come from utility, belief, speculation, liquidity and leverage.
- Illustration: $95 million of new money on $950 million (10%) gives about $55.00, +10%.
- This is not a price formula; real prices depend on liquidity, sellers and expectations.
In an actual order book, a small purchase can move prices sharply if liquidity is thin, while much larger buying may be absorbed with limited price movement if sellers provide sufficient supply. Market capitalization can increase or decrease without an equal amount of net cash entering or leaving. Expectations, leverage, liquidity providers, and large holders also affect price discovery. The learner should therefore label the $55 result as an artificial sensitivity illustration, never a forecast. Research should ask which demand drivers might persist, which depend on speculative narratives, and what measurable evidence would show that demand assumptions have weakened.

Flexible Token: Issuance, Staking and Holder Dilution
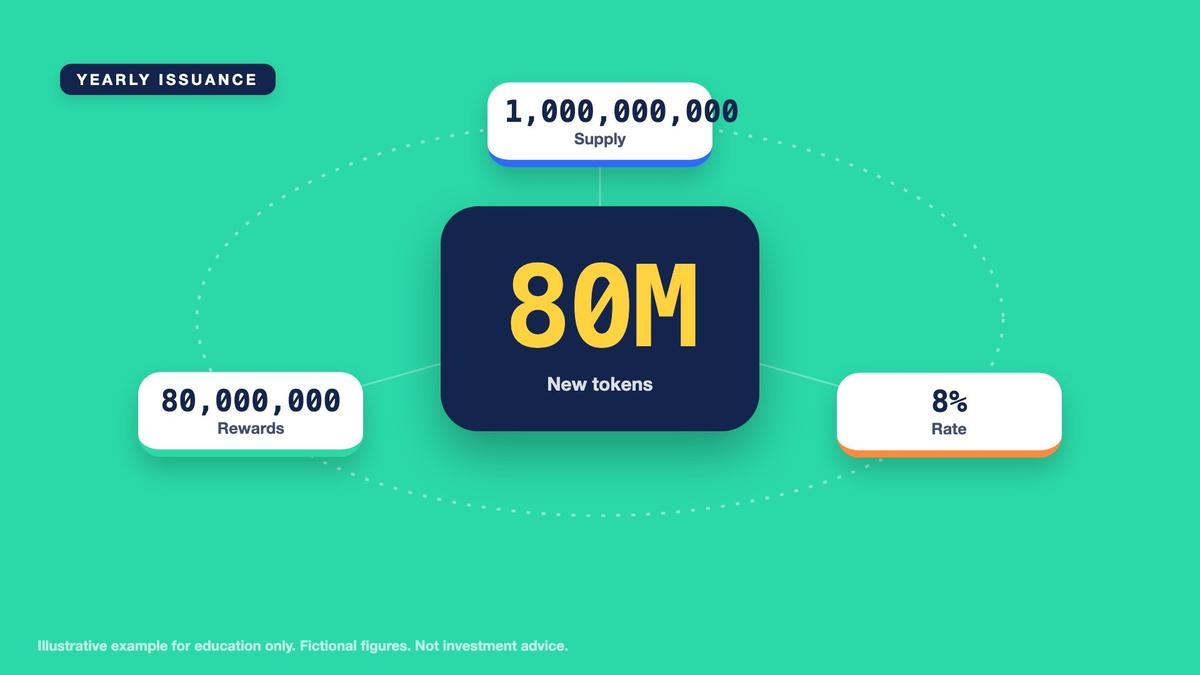
Our second fictional asset, Flexible Token, begins with a stated issued supply of 1,000,000,000 tokens. Its protocol creates new staking reward tokens equal to 8% of that starting issued supply during the year. The newly issued amount is therefore 80,000,000 tokens, bringing issued supply to 1,080,000,000. Staking rewards may compensate participants who perform network functions or commit assets under specified rules, but reward issuance increases the number of outstanding units in this example. The economic value of rewards depends on token prices, conditions, costs, and risks rather than on nominal token counts alone.
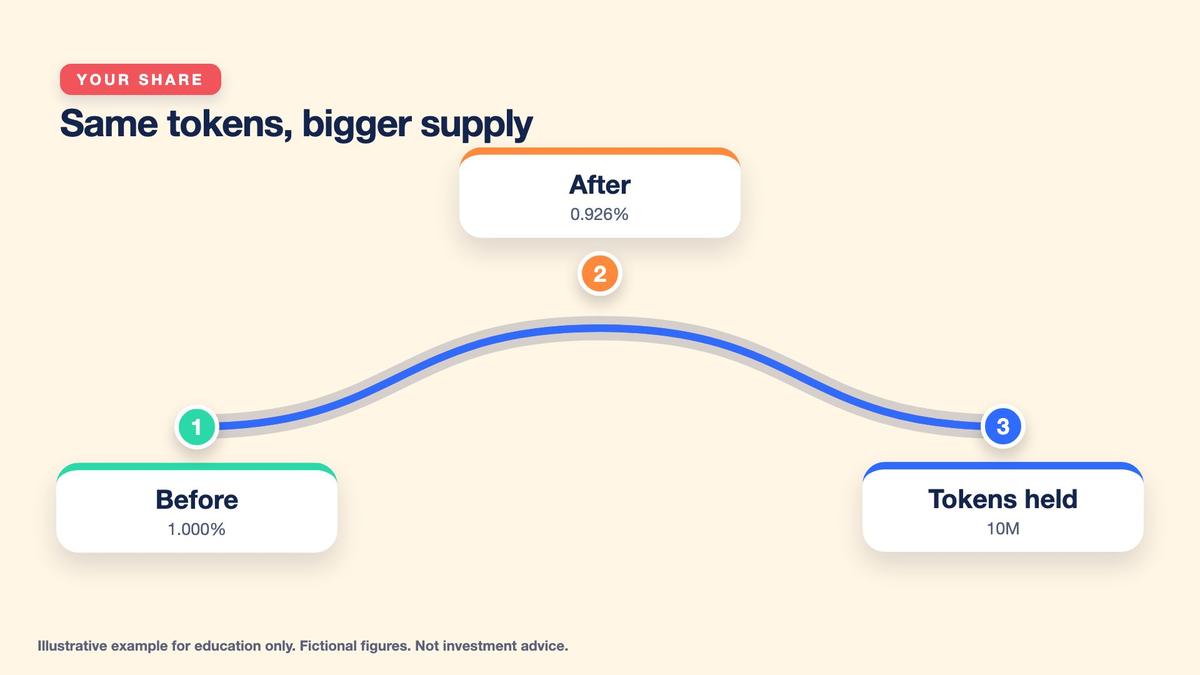
A hypothetical holder owns 10,000,000 Flexible Tokens and does not stake or receive new tokens. Initially, the holder represents 10,000,000 divided by 1,000,000,000, or exactly 1.000% of issued supply. After issuance, the same 10,000,000 tokens represent approximately 0.925926%, displayed as 0.926%. Relative ownership dilution equals one minus 1 divided by 1.08, or approximately 7.4074%, rounded to 7.41%. This is the percentage decline in the holder's proportion of total issued supply, not a guaranteed decline in the token's market price.

Key points
- Flexible Token: 8% issuance = 80,000,000 new tokens; supply becomes 1,080,000,000.
- A non-staking holder of 10,000,000 goes from 1.000% to 0.926%, a relative dilution of 7.41%.
- Staking may offset dilution but adds eligibility, lockup, slashing and liquidity risks.
Staking participants may receive rewards that offset some ownership dilution, but the economic comparison must account for reward eligibility, lockups, fees, slashing risk where applicable, custody, smart-contract security, and changes to network rules. Inflation measured by new token issuance is not identical to consumer-price inflation, nor does token issuance mechanically imply an equal market-price decline. For Flexible Token, we separately identify the total issued supply, circulating float, and maximum possible supply. Researchers should not use these different denominators interchangeably when calculating ownership, float capitalization, or fully diluted valuation.
Circulating Market Cap, Fully Diluted Value and Token Unlocks
Flexible Token has a fictional trading price of $2.00 and a circulating float of 400,000,000 tokens. Circulating market capitalization therefore equals $2 multiplied by 400,000,000, giving $800 million. However, the stated maximum possible supply is 2,000,000,000 tokens. Applying the same $2 price to that maximum produces fully diluted valuation of $4 billion. Float market capitalization and fully diluted valuation answer different questions: one uses currently circulating supply, while the other applies today's price to a broader possible supply base. Neither represents guaranteed realizable cash or future market value.


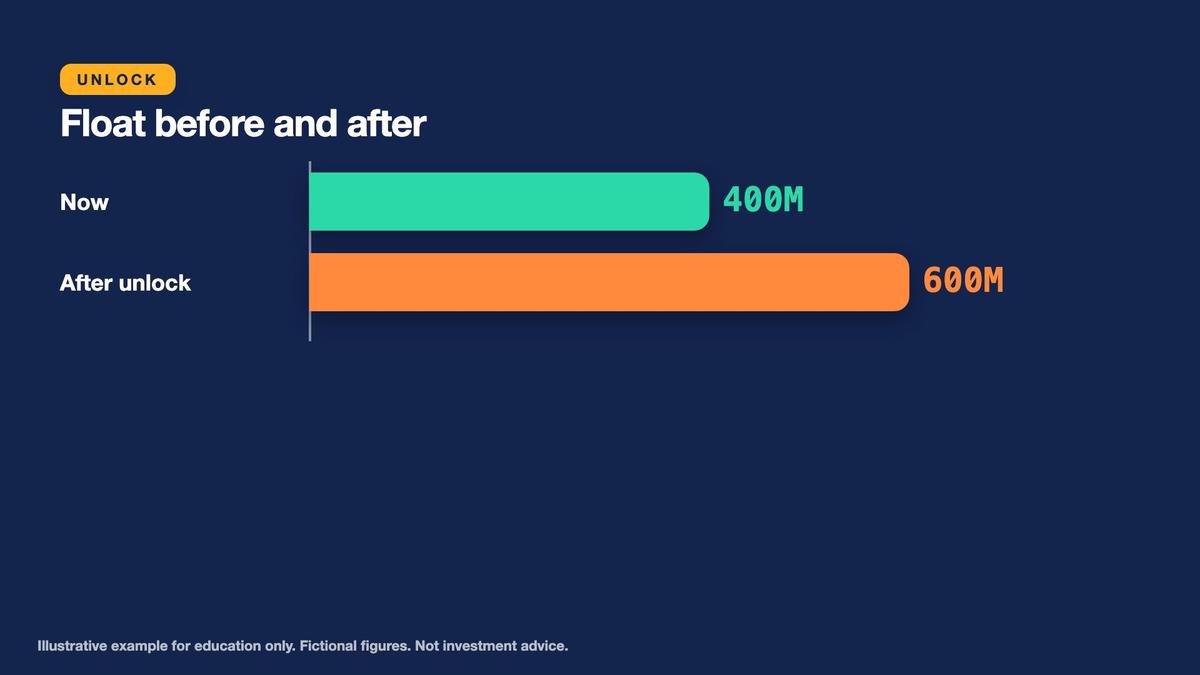
Suppose an additional 200,000,000 previously locked tokens become circulating next month. Float rises from 400,000,000 to 600,000,000, an increase of exactly 50% relative to the starting float. This scheduled unlock does not necessarily create 200 million new tokens; it makes previously noncirculating tokens available under the scenario. Unlocking can alter potential selling supply, but holder behavior is uncertain. Tokens may be retained, transferred, staked, or sold. Research should identify who receives the unlocked units, any restrictions, concentration among recipients, and the actual unlock calendar rather than assuming every token is immediately sold.
Key points
- Float market cap = $2.00 x 400,000,000 = $800 million; fully diluted = $2.00 x 2,000,000,000 = $4,000 million.
- An unlock of 200,000,000 raises float from 400,000,000 to 600,000,000, up 50%.
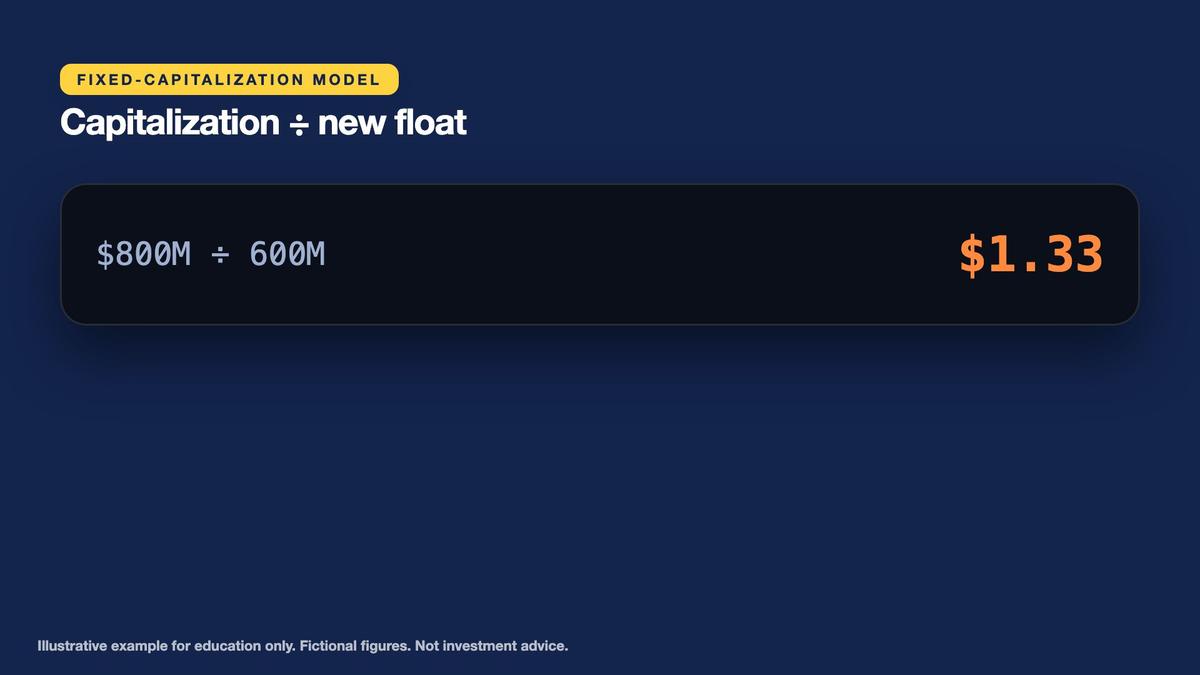
- Fixed-capitalization model: $800M / 600M = $1.33, down 33.3%; a sensitivity, not a forecast.
For a simplified sensitivity exercise, artificially keep circulating market capitalization fixed at $800 million while float increases to 600 million tokens. Dividing $800 million by 600 million gives approximately $1.333333 per token, displayed as $1.33. Relative to the original $2 price, the unrounded implied change is negative one-third, or approximately negative 33.3%. Real market capitalization does not have to remain fixed during an unlock, and this calculation is not a price prediction. Its purpose is to make the supply assumption explicit and highlight why circulating float, issued supply, and maximum supply must be distinguished.
Token Design, Governance and Failure Assumptions
A useful token research memo asks what the token does and why participants might need or want it. Does it provide access to a service, pay transaction costs, facilitate governance, support network security, or simply function as a speculative unit? The answer should be tied to observable behavior rather than promotional language. The memo should also identify who holds the supply, which groups receive newly issued tokens, how concentrated ownership is, and whether large holders face unlock restrictions. Strong network activity does not automatically mean the token captures economic value from that activity.
Governance and administrative control deserve equal attention. Who can change issuance rules, approve upgrades, unlock treasury assets, or alter smart-contract permissions? A supply cap may be enforced by widely adopted consensus rules, controlled through concentrated governance, or changeable by administrators, depending on the system. Security assumptions should consider the cost of attacking a network, software audits and their limitations, smart-contract vulnerabilities, custody arrangements, and the consequences of losing private keys. A token's attractive supply schedule cannot compensate for a system that is unreliable or insecure.
Key points
- Ask what the token does, who holds it and who receives new supply.
- Ask who can change the rules, unlock schedules or treasury spending.
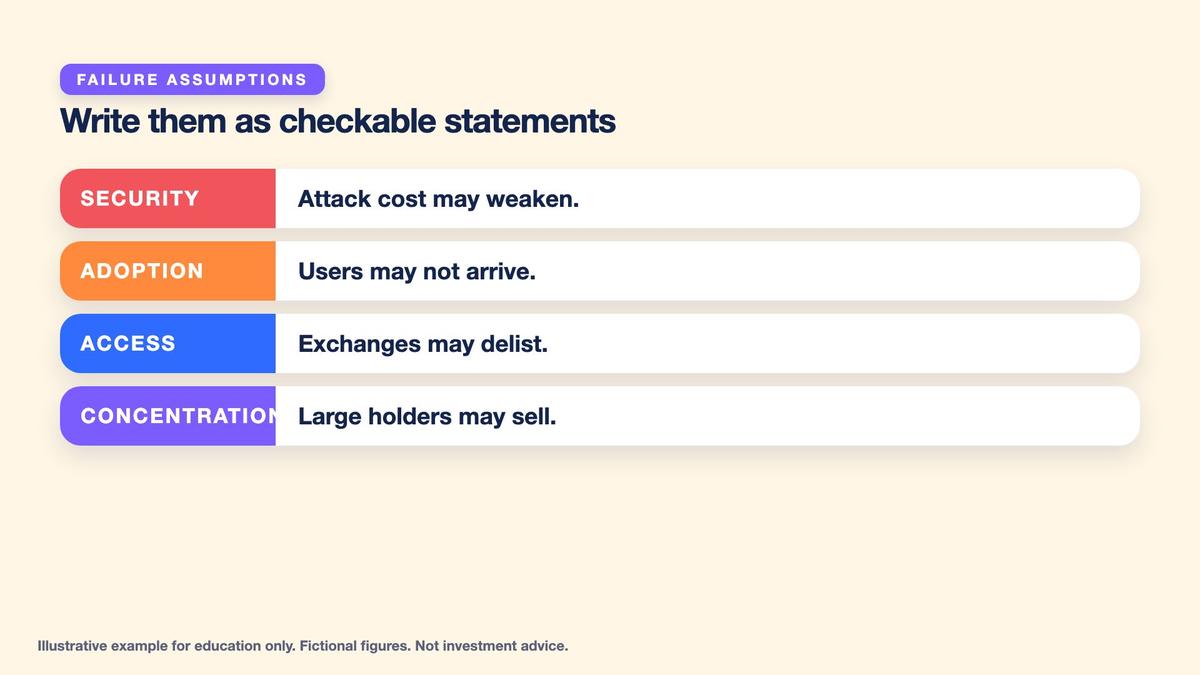
- Write failure assumptions as checkable statements before judging performance.
Write plausible failure assumptions before evaluating performance. For Capped Coin, consider stalled adoption, changing market access, weakened network security, concentrated selling, and speculative demand disappearing. For Flexible Token, add excessive issuance, unexpected unlock behavior, governance concentration, smart-contract problems, and weak token utility. Both may be affected by regulation, exchange disruptions, stablecoin stress, leveraged liquidation chains, and changing narratives. A good memo identifies measurable events that would cause reconsideration, such as material security incidents, altered supply rules, weakened network usage, unusual holder concentration, or persistent deterioration in available liquidity.
Volatility, Drawdown Recovery and Position Risk
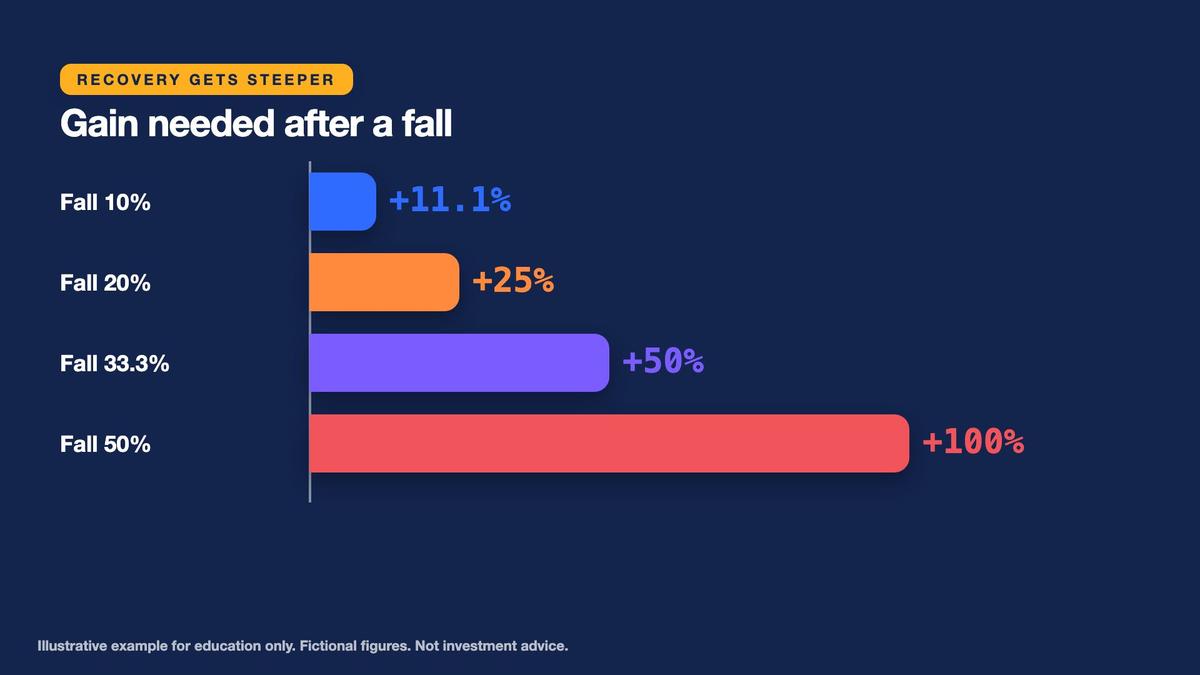
Digital assets can experience large and rapid percentage changes, making downside mathematics important. A drawdown measures the decline from a prior value or peak. If a hypothetical holding worth $100 falls 50%, its value becomes $50. Recovering from $50 to $100 requires a $50 increase on a $50 base, which is a 100% gain. This demonstrates why percentage losses and subsequent recovery gains are asymmetric. A loss of half the value cannot be reversed by a gain of merely 50% on the reduced balance.
The same principle applies to the simplified Flexible Token unlock illustration. A decline of exactly one-third leaves two-thirds of the starting value, and recovery requires one-half of that remaining value, or a 50% gain. We describe this as approximately a 33.3% decline requiring approximately a 50% recovery. If exactly 33.3% rather than one-third is used, the required recovery is approximately 49.93%, so the precise result depends on the original rounding. The important lesson is that recovery percentages must use the reduced value as their denominator.
Key points
- A 50% fall needs a 100% gain; a 33.3% fall needs a 50% gain.
- Recovery gets steeper as the fall deepens: 10% needs 11.1%, 20% needs 25%.
- Size positions with a risk budget and stop distance, and remember that stops are not guarantees.
Earlier labs introduced a planned risk budget, entry-to-stop distance, and position-allocation cap. These tools help learners size hypothetical exposures before uncertain outcomes occur. For a simple instrument, planned quantity may be calculated as risk dollars divided by stop distance and then constrained by an independent position cap. However, slippage, gaps, thin liquidity, exchange interruptions, and failed exits can produce losses beyond the planned amount. No risk rule guarantees capital preservation. In this lesson, position sizing is discussed conceptually using simulated money, without creating a real order or recommending an allocation.
Final Checkpoint: Compare Supply, Demand and Failure Cases
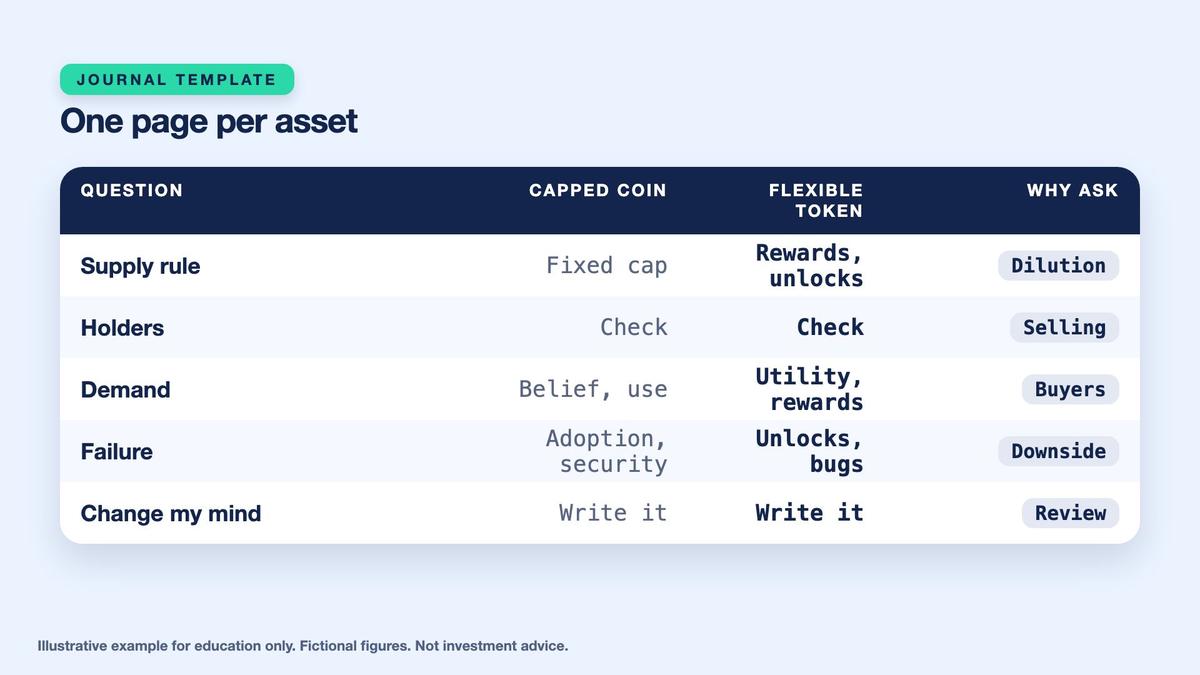
Complete a one-page comparison of Capped Coin and Flexible Token. For Capped Coin, record maximum supply of 21 million, circulating supply of 19 million, 2 million remaining, annual issuance of 400,000, and supply growth of approximately 2.11%. After a hypothetical halving, the next 200,000 issued units represent approximately 1.03% growth on a 19.4-million starting supply. Its fictional $50 price and 19-million circulating supply produce a $950 million market capitalization. Label the $55 demand illustration as an artificial proportional assumption rather than a predictable market response.

Practice Lab: Compare Two Fictional Token Economies
Use only fictional Capped Coin and Flexible Token, together with Bitcoin's general network and capped-supply principles for background. Complete one dated research memo comparing supply rules, issued and circulating units, maximum supply, issuance growth, token-holder ownership, market capitalization, fully diluted valuation, unlocks, demand assumptions, and failure conditions. Use the supplied fictional prices solely for arithmetic. Clearly label the $55 proportional-demand result and the approximately $1.33 constant-capitalization unlock result as artificial sensitivity assumptions rather than forecasts. Distinguish an ownership percentage change from a price change, and use the correct denominator for each supply metric. All financial exposure and journal work is simulated.
- Decision 1: Capped Coin has a maximum supply of 21,000,000, circulating supply of 19,000,000, current-year issuance of 400,000, and post-halving next-year issuance of 200,000 on a new starting circulation of 19,400,000. — Calculate remaining issuance, remaining percentage of the cap, current-year supply growth, and next-year post-halving growth.
- Decision 2: Capped Coin has 19,000,000 circulating units at a fictional price of $50. An artificial model assumes that $95 million of additional demand raises circulating market capitalization proportionally while supply remains unchanged. — Calculate the starting market capitalization, illustrative new capitalization and price, and explain why this is not a valid general prediction rule.
- Decision 3: Flexible Token starts with 1,000,000,000 issued tokens and creates 80,000,000 staking rewards during the year. A holder keeps 10,000,000 tokens without staking or receiving rewards. — Calculate supply after issuance, starting and ending ownership percentages, and relative dilution.
- Decision 4: Flexible Token is priced fictionally at $2.00, has a 400,000,000 circulating float and 2,000,000,000 maximum supply, and schedules an additional 200,000,000 tokens to unlock. — Calculate float capitalization, fully diluted valuation, float growth, and the artificial price implied by keeping circulating capitalization at $800 million.
- Decision 5: The learner must compare Capped Coin and Flexible Token without predicting prices. Both face uncertain adoption, security, liquidity, governance, and holder behavior, while Flexible Token also has substantial planned unlocks. — Write the strongest failure case for each asset, specify evidence that would cause a dated thesis review, and explain how drawdown mathematics influences simulated risk planning.
Answer key
For Flexible Token, record issued supply of 1 billion, annual staking issuance of 80 million, and subsequent issued supply of 1.08 billion. A non-staking holder of 10 million tokens declines from 1.000% to approximately 0.926% of issued supply, representing 7.41% relative dilution. At a fictional $2 price, 400 million circulating tokens imply $800 million float capitalization, while the 2-billion maximum implies $4 billion fully diluted value. An unlock of 200 million increases float by 50%; an artificial constant-capitalization calculation implies approximately $1.33 per token, not a forecast.
Key points
- One page per asset: supply rule, issuance, float, holders, demand drivers, failure case.
- Record supply growth, float change and a drawdown you could tolerate.
- Write what would change your mind before prices move, and date the review.
Finish the memo with demand drivers, holder concentration, security assumptions, governance permissions, unlock conditions, and the strongest argument that each asset might fail. Record what specific evidence would cause the learner to revisit the thesis, including protocol-rule changes, security events, adoption trends, or deteriorating liquidity. Explain why a 50% drawdown requires 100% recovery and why a one-third decline requires 50%. The final outcome is a documented comparison of supply, demand, and failure assumptions, not a prediction of future prices or a simulated instruction to trade.
Worked example at a glance
Key terms
- Maximum supply: the most units the stated rules allow to exist.
- Circulating supply: units counted as available under the stated method.
- Issuance: the creation of new units under network or token rules.
- Halving: a scheduled cut in the issuance rate, as in Bitcoin block subsidies.
- Market capitalization: price times circulating supply; a valuation, not cash invested.
- Fully diluted value: price times maximum supply.
- Float: the part of supply that is tradable now.
- Unlock: locked tokens becoming tradable.
- Dilution: a smaller ownership share caused by new supply.
- Staking: locking tokens to help run a network, usually for rewards and with risks.
- Drawdown: the percentage fall from a previous value or peak.
- Failure assumption: a checkable statement of how a thesis could be wrong.
Multi Asset Trading Lab provides educational information only and does not constitute personalized investment, trading, financial, accounting, legal, or tax advice. Bitcoin is discussed only for its general network, proof-of-work, block timing, issuance schedule, and approximately 21-million-coin consensus supply cap; no real Bitcoin price, capitalization, ticker-based recommendation, or future performance forecast is provided. Capped Coin and Flexible Token are entirely fictional educational assets. All prices, issuance amounts, ownership percentages, market capitalizations, fully diluted valuations, unlock schedules, demand examples, and scenario outcomes are hypothetical. No real-money cryptocurrency purchase, token sale, staking activity, leverage, or financial transaction is required or encouraged. Bitcoin's consensus rules target an average block interval of approximately ten minutes, and its block subsidy halves every 210,000 blocks, approximately every four years; individual block times vary, and proof-of-work miners differ from proof-of-stake validators used by some other networks. A stated maximum supply is a network or token-design rule, potentially subject to governance and consensus considerations, and does not guarantee economic value, demand, liquidity, adoption, or price appreciation. Market capitalization is calculated as price multiplied by circulating supply but does not represent the total cash paid into an asset, cash available for withdrawal, or a guaranteed realizable exit value. The Capped Coin illustration uses fictional $50 pricing, 19 million circulating coins, and $950 million capitalization. Its hypothetical $95 million added-demand example imposes an artificial proportional capitalization increase to produce a $55 price. Actual digital asset prices do not respond mechanically or proportionally to net inflows, and the arithmetic is not a prediction, valuation guarantee, or model of real order-book behavior. Flexible Token's 1 billion initial issued supply, 80 million yearly staking rewards, 1.08 billion post-issuance supply, 400 million circulating float, and 2 billion maximum possible supply refer to distinct supply measures. Holder ownership dilution of approximately 7.41% measures the proportional change in ownership of issued supply for a holder who receives no additional tokens; it does not guarantee a corresponding price decline. Staking rewards are not risk-free returns and may carry custody, lockup, slashing, network, liquidity, governance, operational, and smart-contract risks. The fictional $800 million circulating capitalization and $4 billion fully diluted valuation are mathematical calculations, not forecasts or estimates of realizable capital. The 200-million-token unlock example increases circulating float from 400 million to 600 million, a 50% increase. The approximately $1.33 implied price and approximately 33.33% modeled decline require an artificial assumption that circulating capitalization remains fixed at $800 million; real market capitalization, demand, token-holder decisions, exchange liquidity, and prices may change in unrelated ways. The displayed $1.33 value is rounded from $1.333333..., and the unrounded value is used for percentage-change arithmetic. A 50% value decline requires a 100% gain from the reduced value to recover, while a decline of exactly one-third requires a 50% recovery gain; an exact 33.3% decline instead requires approximately 49.93% recovery, demonstrating the importance of rounding conventions. Digital assets may experience exceptional volatility, liquidity gaps, market manipulation, concentrated ownership, protocol changes, security attacks, smart-contract exploits, loss of private keys, failed custody arrangements, regulatory or exchange-access changes, unstable collateral arrangements, leveraged liquidations, stablecoin contagion, and rapidly changing speculative narratives. Token issuance limits, burns, governance rights, and stated utility may be modified or interpreted differently depending on a system's actual rules and participants. No token's scarcity, historical performance, staking yield, or narrative guarantees that willing buyers will exist. Portfolio sizing, stop references, and risk-per-trade limits from earlier lessons are educational techniques for expressing planned exposure, not guarantees of maximum realized loss. Stops may execute worse than intended or fail under unusual conditions, and leveraged positions can create additional risks. Learners should separate facts from assumptions, use dated and independently verified documentation, examine token distribution and governance controls, write the strongest plausible failure case, and define measurable thesis-revisit conditions before considering outcomes. All research, scenarios, allocations, and calculations in this lesson are simulated and educational only. Nothing in this lesson recommends buying, selling, holding, staking, lending, minting, or trading Bitcoin or any other real digital asset, and none of the hypothetical figures predicts future prices or financial results.
Lesson Checkpoint
Review what you learned and get feedback on your work.