



In this twelve-minute beginner hands-on lab, learners compare market orders, limit orders, partial fills, and stop orders using only fictional Example ETF and a simulated trading account. They calculate a quoted bid-ask spread, market-order average execution price, slippage, midpoint execution cost, limit-order savings, opportunity cost from a missed fill, and losses from an illustrative stop-order gap. Learners also practice choosing basic time-in-force instructions, verifying order tickets, and maintaining a detailed execution journal. The outcome is a documented comparison of execution speed, price control, transaction friction, and fill uncertainty using simulated money only.
Understand Bid, Ask, Midpoint, and the Spread
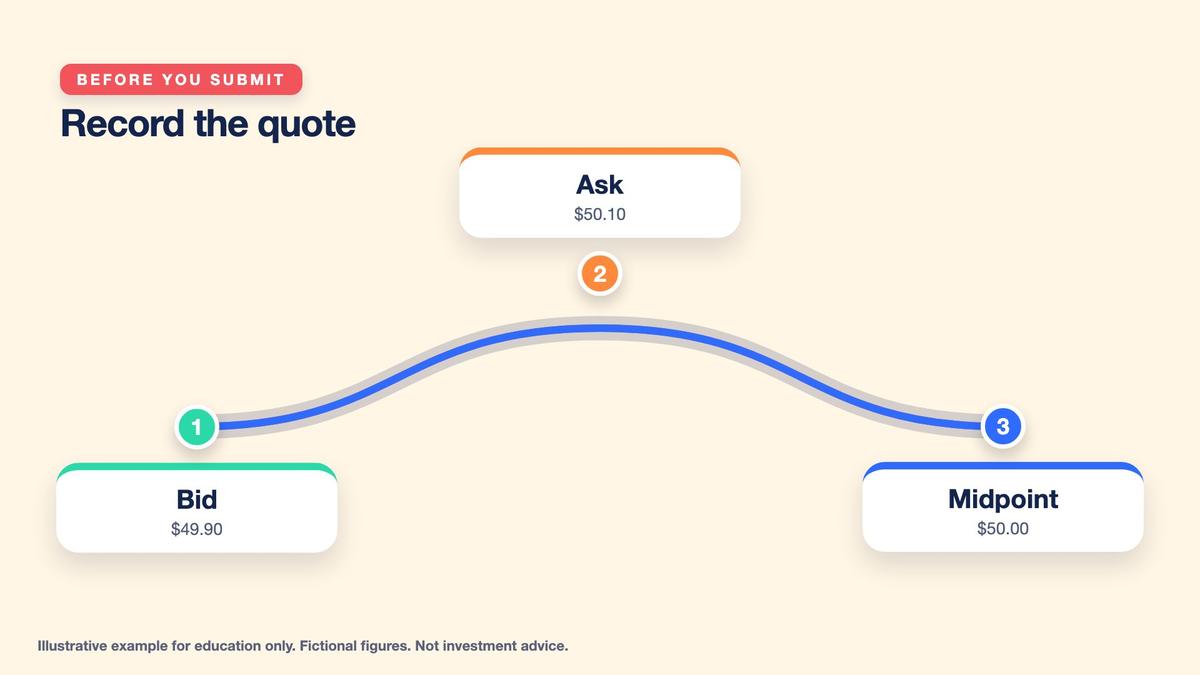
A market quotation typically displays a bid and an ask. The bid is the price at which a buyer is presently offering to purchase a security, while the ask is the price at which a seller is presently offering to sell. These quotations can have limited available quantity and can change quickly. For our fictional Example ETF, the displayed bid is $49.90 and the ask is $50.10. We will use this single quotation snapshot throughout the hands-on examples and a simulated goal of buying 100 shares. No real security or live exchange is involved.

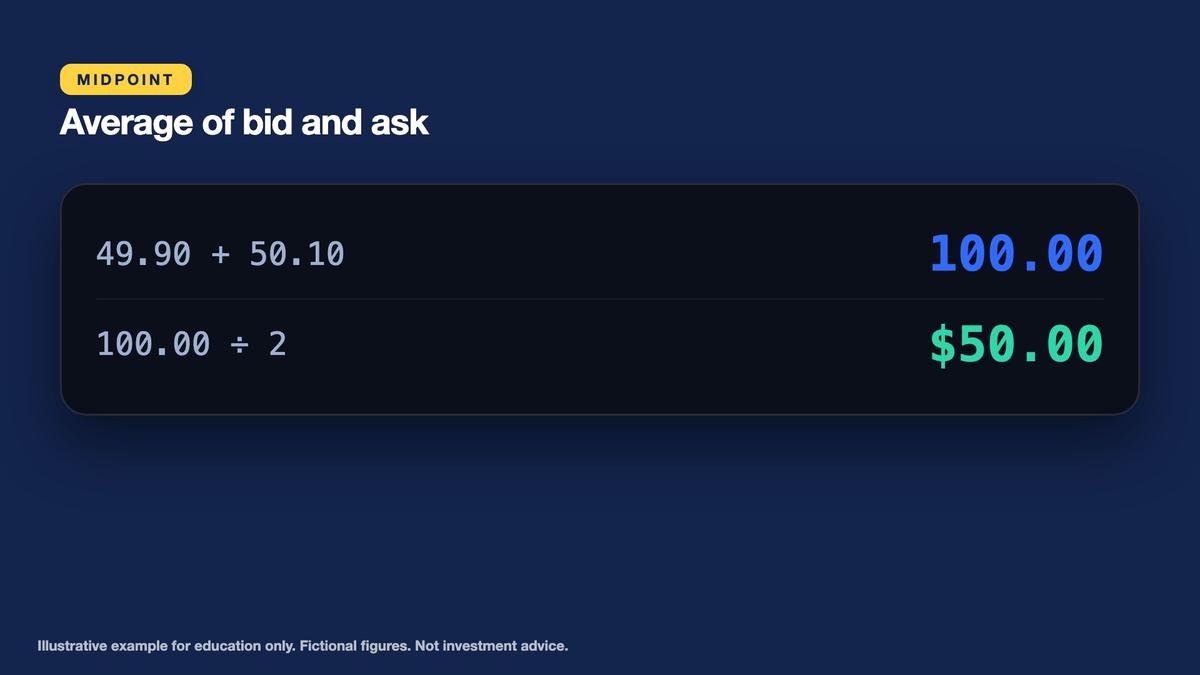
The quoted spread is calculated as ask minus bid. For Example ETF, $50.10 minus $49.90 equals exactly $0.20 per share. The midpoint is the average of the bid and ask, or ($49.90 + $50.10) divided by two, which equals $50.00. Expressing the spread relative to midpoint gives $0.20 divided by $50.00, multiplied by 100, or exactly 0.40%. This is a useful reference for comparing quotation friction, but the actual execution cost depends on which prices and quantities are available when an order is processed.


Key points
- A market order buys speed; a limit order buys control of price.
- Bid is the displayed buy price, ask the displayed sell price, and a buyer normally pays the ask.
- Today's question: what does each order cost, and what can go wrong?
The spread matters because buying at the displayed ask and immediately selling at the displayed bid can produce a loss even if the underlying market value has not changed. The displayed bid and ask also do not guarantee that every requested share can execute at those prices. Available order-book depth, changing liquidity, and execution timing influence the actual result. Before comparing order types, record the quotation timestamp, bid, ask, midpoint, displayed quantities when known, and the reference used for any execution-cost calculation.
Simulate a Market Buy and Calculate the Average Fill
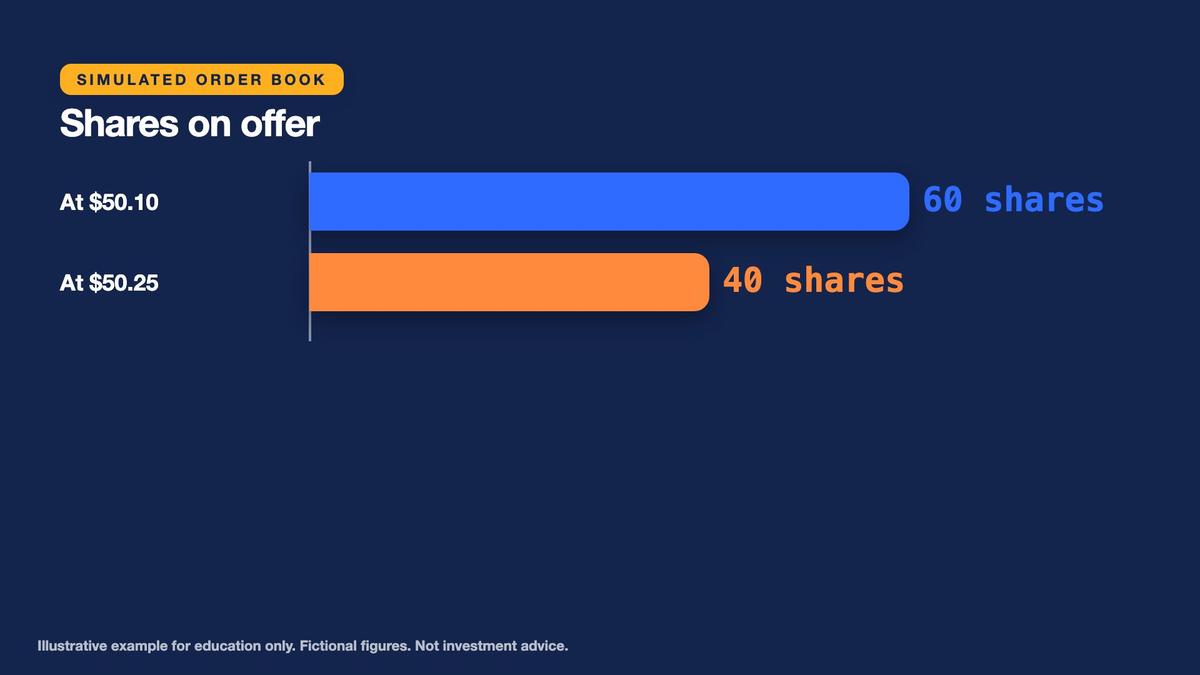
A market order seeks prompt execution using liquidity available in the order book. For a buy order, it generally interacts with available sellers, starting with favorable displayed asks and potentially moving to higher prices if the initial liquidity is insufficient. Market orders prioritize execution over exact price control. In this fictional scenario, the learner requests 100 shares of Example ETF. The invented order book contains 60 shares available at $50.10 and another 40 shares at $50.25. We assume both levels remain available and the requested quantity executes fully.
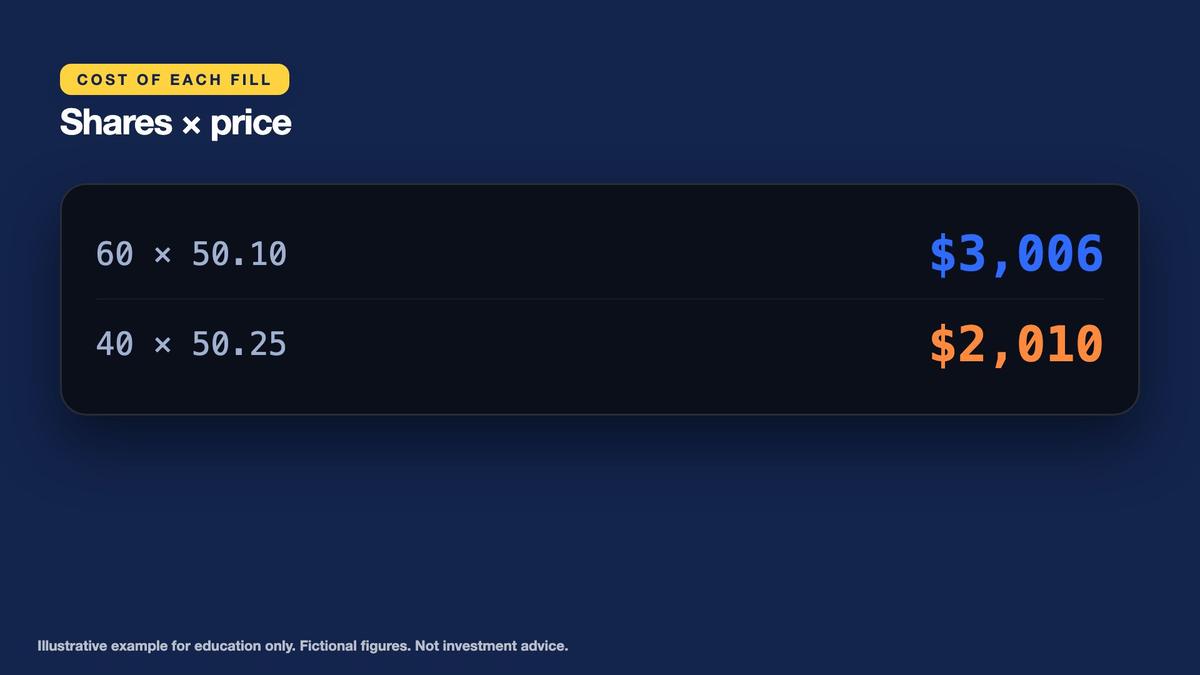
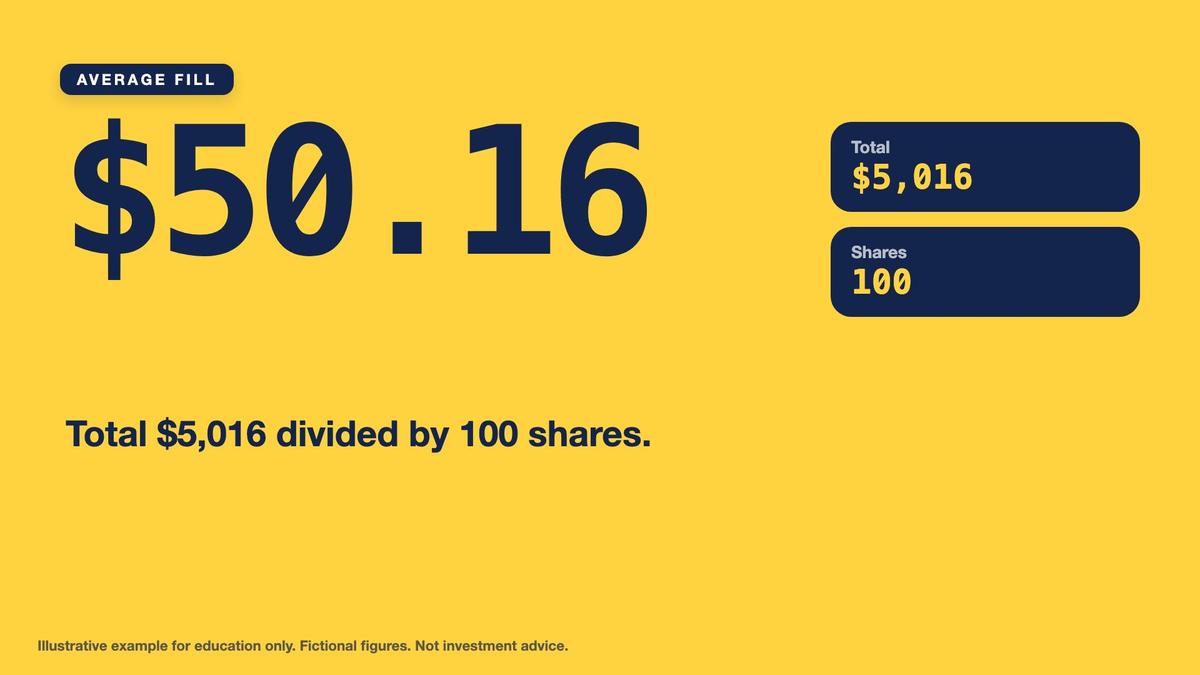
Calculate the cost of each fill separately. The first 60 shares at $50.10 cost $3,006. The remaining 40 shares at $50.25 cost $2,010. Total execution cost is therefore $5,016 for 100 shares. The volume-weighted average fill price equals total cost divided by total shares, or $5,016 divided by 100, giving exactly $50.16. A single market order can therefore have multiple fills at different prices, and its average result may differ from the ask visible before the order was submitted.
Key points
- Quote: bid $49.90, ask $50.10, midpoint $50.00.
- Spread = ask - bid = $0.20, or 0.20 / 50.00 = 0.40% of the midpoint.
- The spread is a trading cost even if the price does not move.
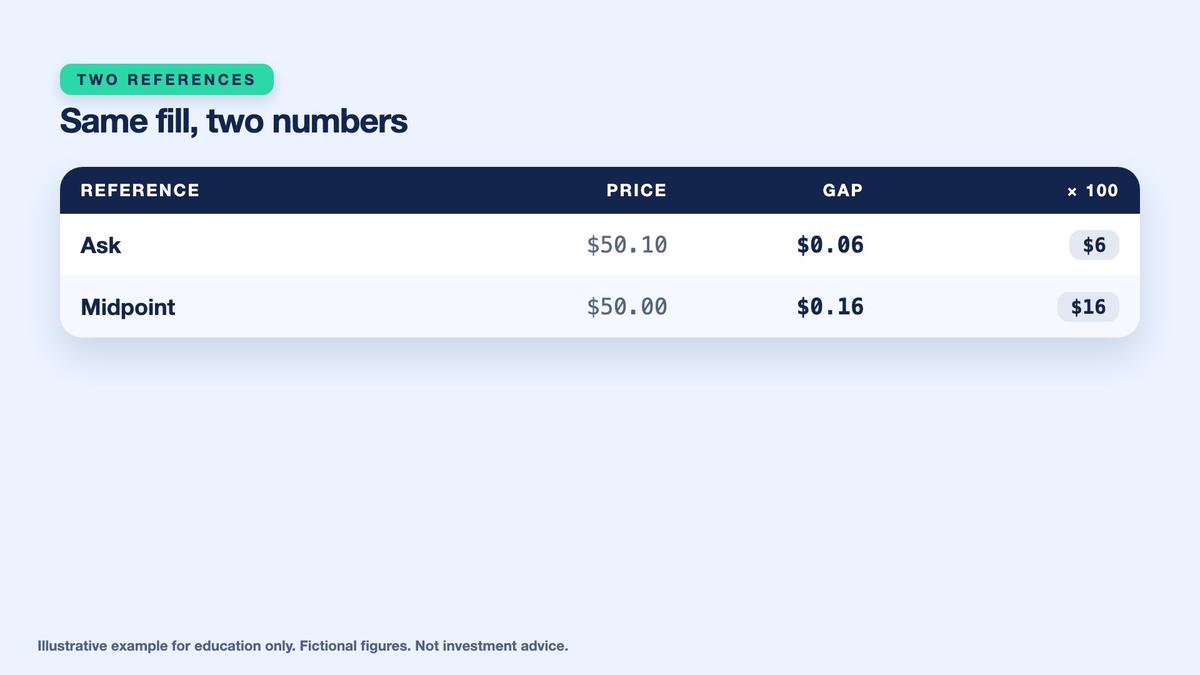
Compare the $50.16 average execution price with two distinct references. Relative to the initial $50.10 ask, additional adverse slippage equals $0.06 per share, or $6 across 100 shares. Relative to the $50.00 midpoint, total execution cost is $0.16 per share, or $16. The latter already includes the midpoint-to-ask component and the additional movement into higher ask levels. Do not add $6 and $16, because they measure overlapping costs using different reference prices. A market order generally offers faster execution but cannot guarantee complete fills or a particular final price.
Simulate a Limit Buy With Three Possible Outcomes
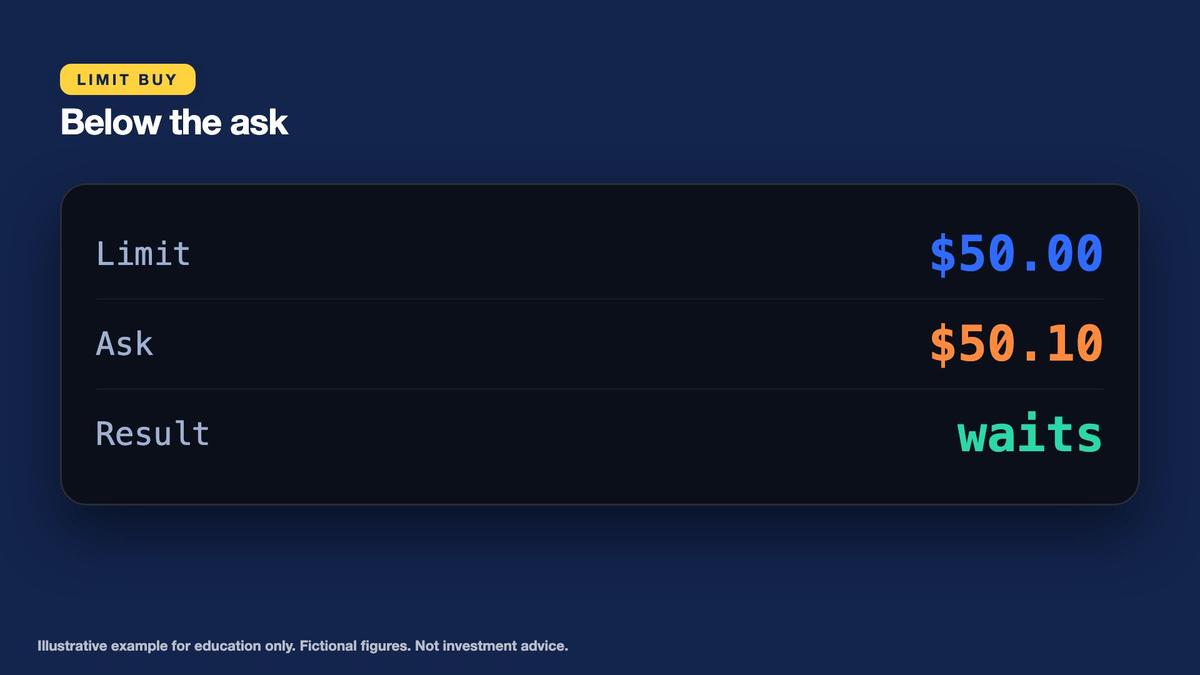
A limit buy defines the maximum price the learner is willing to pay. In our example, the order requests 100 shares at a limit price of $50.00, below the displayed $50.10 ask. Under the stated initial quote, this order would normally remain pending rather than immediately purchase shares from the displayed sellers. Its main advantage is price control: an execution cannot occur above the specified limit under ordinary limit-order mechanics. Its main disadvantage is fill uncertainty. The market can move away, insufficient liquidity can appear, or only some of the desired quantity may execute.
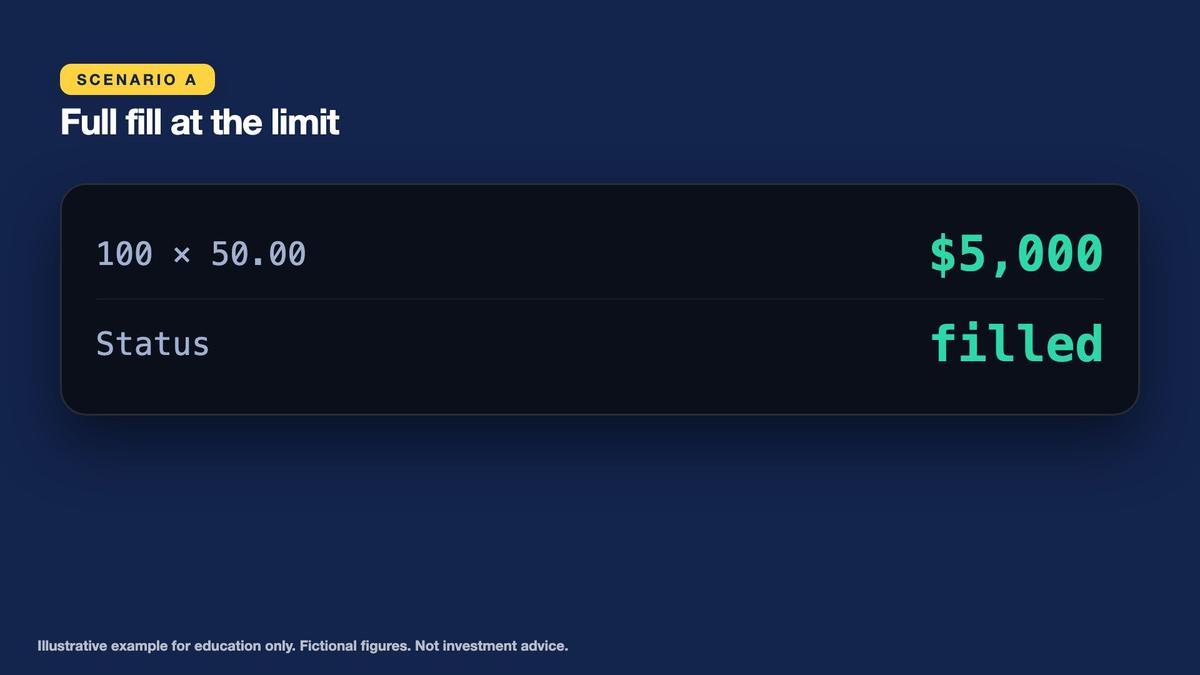
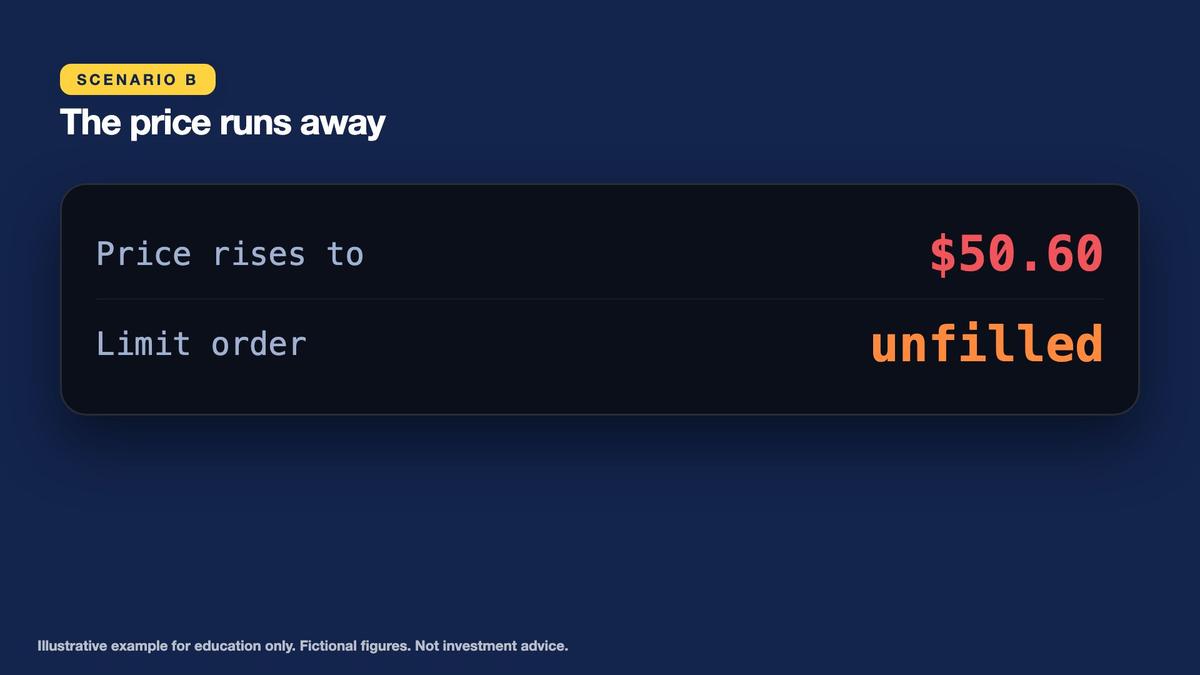
In Scenario A, the market eventually provides enough selling liquidity at $50.00, and all 100 shares fill there. Total purchase cost equals exactly $5,000. Compared with the earlier $5,016 market order, the fully filled limit order costs $16 less. This is a conditional comparison, not proof that limit orders are always better. Scenario B illustrates the opposite outcome. The market price rises to $50.60 without filling the $50.00 limit, leaving zero shares purchased. Compared with the previous market fill at $50.16, a hypothetical 100-share position would show $44 of unrealized gain, calculated as ($50.60 - $50.16) multiplied by 100. The unfilled limit has no realized gain or realized loss from owning shares.
Key points
- Market buy of 100 shares: 60 at $50.10 and 40 at $50.25.
- Total 3,006 + 2,010 = $5,016, average fill $50.16.
- Slippage versus the ask: $6. Cost versus the midpoint: $16. Do not add them.
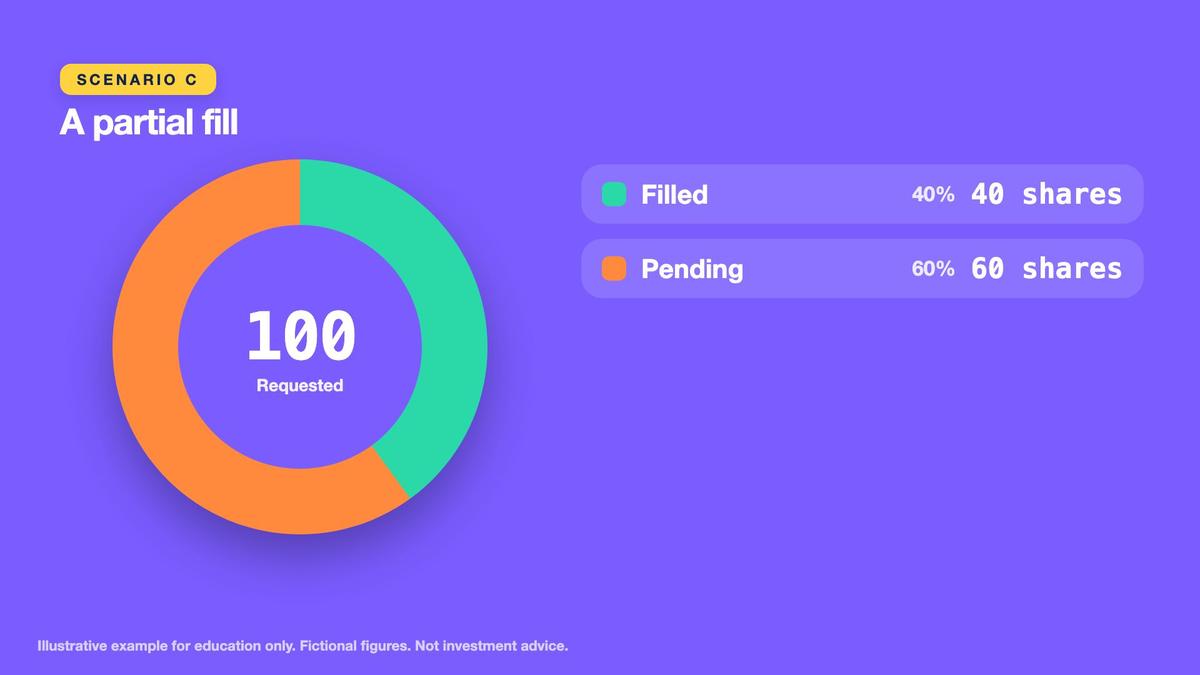
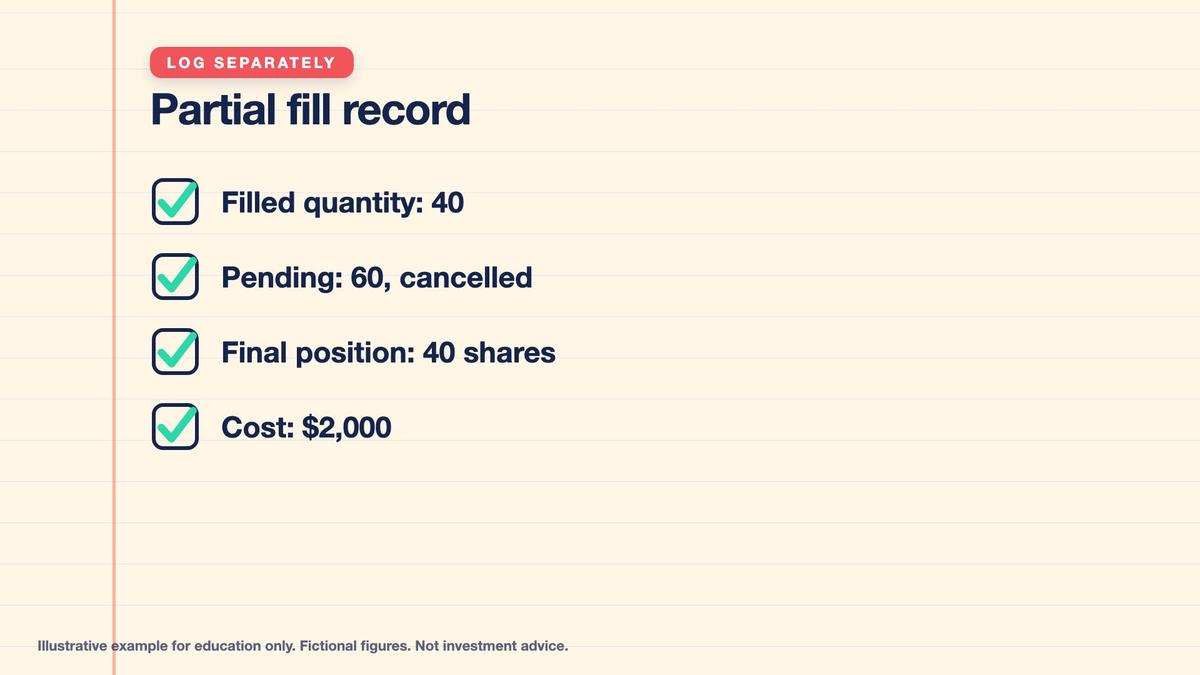
Scenario C illustrates partial execution. Only 40 shares fill at $50.00, costing $2,000, while the remaining 60 shares stay unfilled. The learner subsequently cancels that remainder, leaving the already executed 40-share position intact. Canceling an unfilled quantity does not undo completed purchases. The execution journal must preserve the original requested quantity, executed quantity, average fill price, canceled remainder, and final order status. Treat Scenarios A, B, and C as separate alternatives rather than combining them into one actual account history.
Measure Round-Trip Spread Costs and Slippage
Execution costs can be measured in more than one way. A quoted bid-ask spread is a snapshot of current buying and selling quotations. A midpoint-referenced cost compares the actual execution price with the midpoint visible at a stated time. Slippage compares execution with a chosen reference, such as the initial displayed ask for a market buy or a stop trigger price for a protective exit. Always write down the reference price and direction of the trade. Without that information, an execution-cost figure may be misleading or impossible to reproduce.
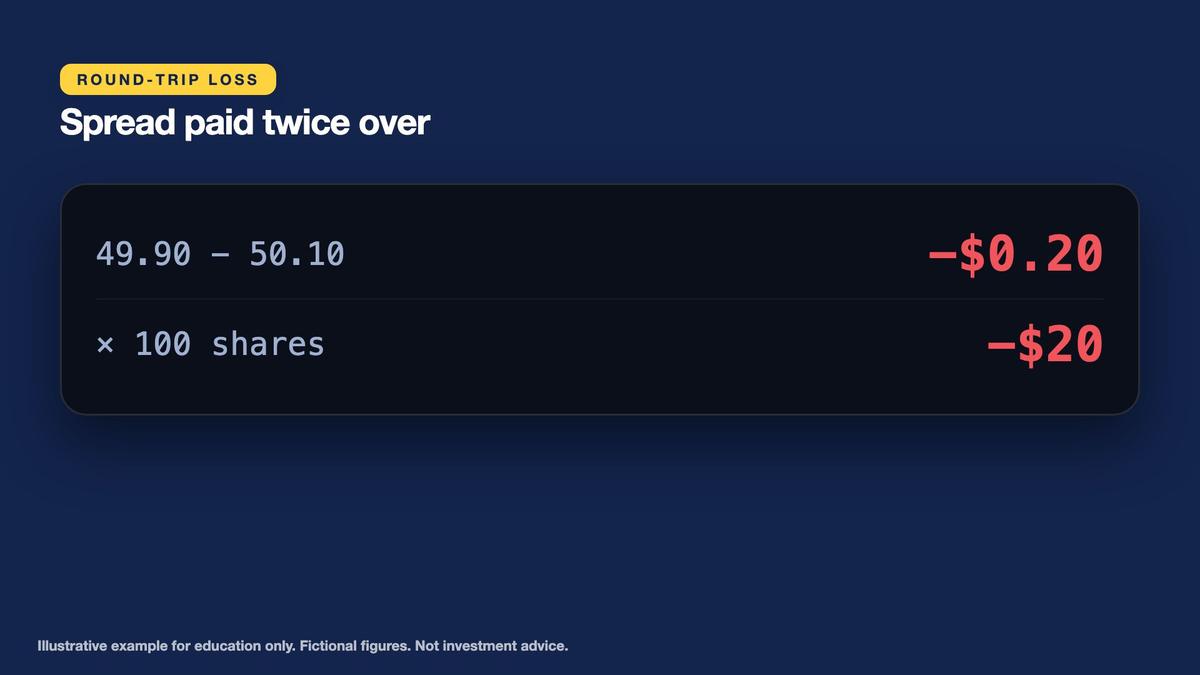
Consider a simple round trip that buys 100 shares at the $50.10 ask and immediately sells them at the $49.90 bid, with unchanged quotations and no other fees. The purchase costs $5,010, while sale proceeds equal $4,990. The result is an immediate $20 loss, representing $0.20 per share. Relative to the $5,010 purchase cost, this equals approximately 0.3992%, rounded to 0.40%. The earlier 0.40% quoted spread used the $50.00 midpoint as its denominator, so the two exact percentages are slightly different even though they round to the same displayed value.
Key points
- A market order promises speed, not a price.
- A limit order promises a price cap, not a fill.
- Compare each order with a stated reference price.
Now return to the market-order example. Buying 100 shares at an average $50.16 rather than the initial $50.10 ask costs an additional $6. Buying at $50.16 instead of the initial $50.00 midpoint costs $16. These are not separate charges to be added together. The midpoint-referenced $16 already includes the $10 difference between midpoint and the initial ask plus $6 of additional execution slippage. Record both measurements separately, along with any other explicitly modeled commissions or fees. In this lab, no additional charges are assumed.
Stop Orders, Market Gaps, and Price Uncertainty
A basic sell stop-market order is designed to activate when a specified price trigger is reached. Once triggered under the applicable platform rules, it becomes an order seeking execution at available market prices. The stop level is a trigger, not a guaranteed exit price. A sell stop may be used in a hypothetical trade plan to define an adverse price condition, but real execution can occur at a worse price when markets move quickly or available liquidity is limited. Learners should distinguish the planned stop level from the actual fill recorded afterward.
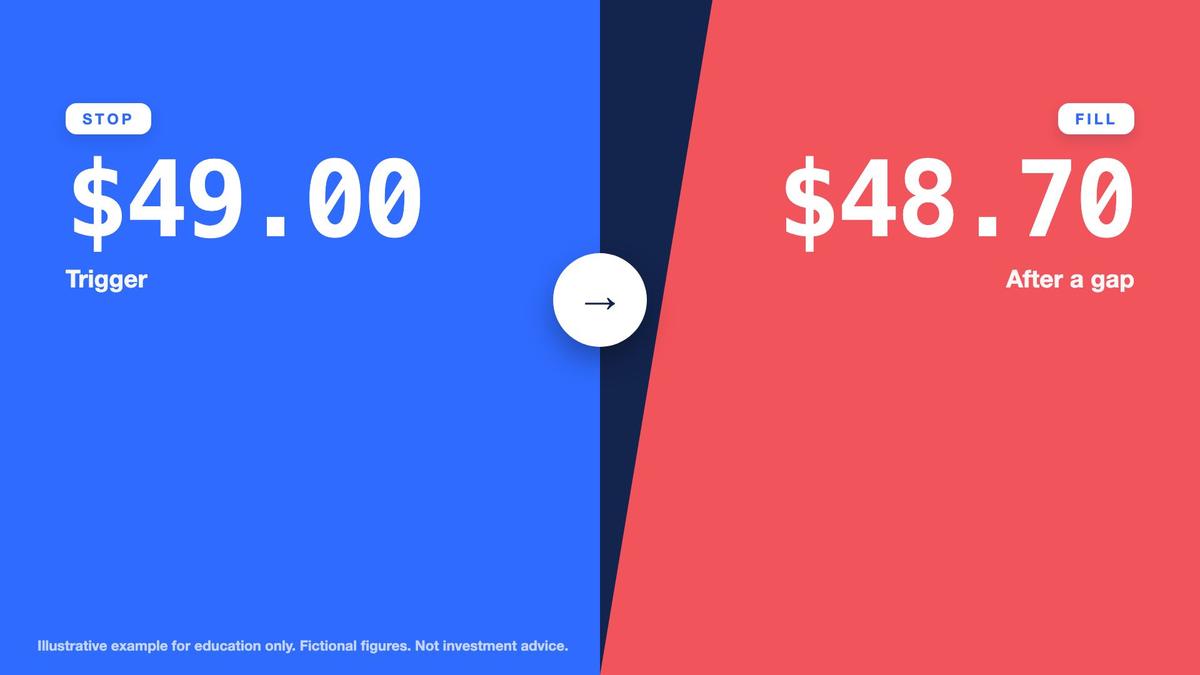
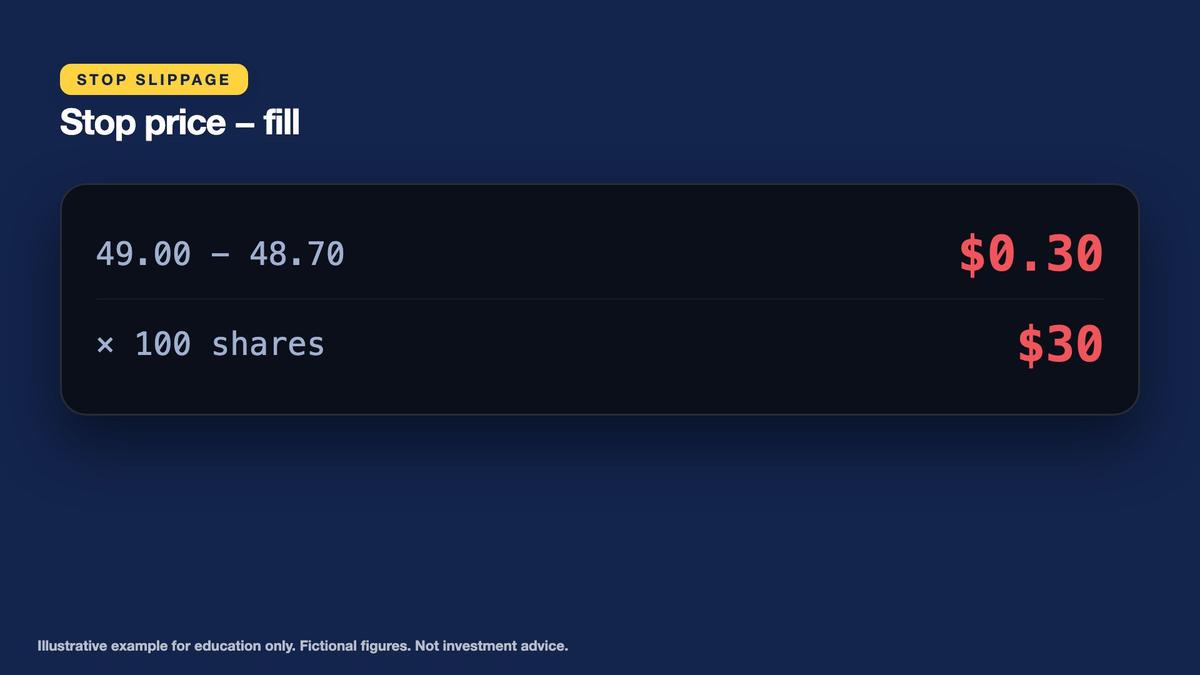
For Example ETF, assume a fictional sell stop is set at $49.00 for 100 shares. A price gap causes the stop-market instruction to execute at $48.70 instead. The adverse difference equals $49.00 minus $48.70, or $0.30 per share. Multiplying by 100 shares gives exactly $30 of additional execution loss relative to the intended stop price. This $30 is stop-referenced slippage, not necessarily the entire loss on the position, because the position's original purchase price would also affect its realized profit or loss.
Key points
- Limit buy at $50.00. Scenario A: all 100 fill at $50.00 = $5,000, which is $16 cheaper but was not guaranteed.
- Scenario B: the price rises to $50.60 and nothing fills. The missed gain versus the market fill is $44, a comparison and not a loss.
- Scenario C: 40 shares fill at $50.00 ($2,000), then the other 60 are cancelled.
A stop order cannot eliminate gap risk or guarantee a maximum realized loss. Liquidity shortages, sudden price movements, order-processing delays, and other market conditions can affect the fill. A stop-limit instruction, where supported, adds a limit price but may fail to execute if acceptable prices are unavailable. The specific triggering and execution behavior depends on the simulator or trading platform. This lesson uses simplified stop-market mechanics to teach the distinction between a planned price condition and an actual execution outcome, not to recommend a specific protective order.
Time in Force and the Order-Ticket Checklist
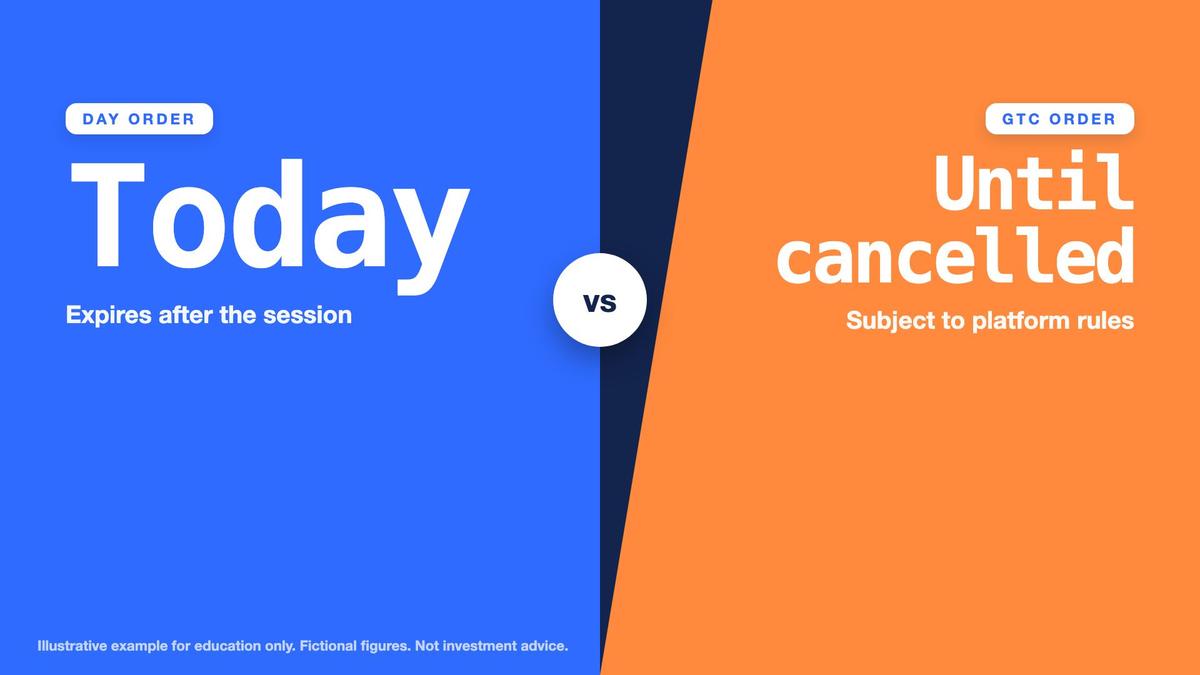
Time in force specifies how long an order remains eligible for execution under the relevant platform rules. A day order generally expires after the applicable trading session if it has not fully executed, although session definitions and partial-fill handling can differ. A good-till-cancelled order, often abbreviated GTC, may remain active beyond one session until it executes, is canceled, or reaches an expiration imposed by the platform. The exact meanings and availability of these instructions must be confirmed in the demo application's documentation rather than assumed from generic labels.
Every order ticket should be checked before submission. Record the fictional symbol Example ETF, the intended buy or sell side, the requested quantity of 100 shares, and whether the order is market, limit, or stop. For a limit order, verify the $50.00 limit. For the separate stop illustration, identify the $49.00 trigger. Confirm time in force and any intended review or cancellation condition. An incorrect order type, direction, quantity, or price can produce an outcome different from the learner's written plan, even if the arithmetic is otherwise accurate.
Key points
- Buying at the ask and selling at the bid at once loses $0.20 a share, $20 for 100 shares, about 0.40% of the $5,010 paid.
- A sell stop at $49.00 becomes a market order once triggered.
- A gap fill at $48.70 means $0.30 x 100 = $30 slippage. A stop does not guarantee its price.
Order status must also be monitored after submission. A pending limit has not yet executed. A partially filled order has an executed portion and a remaining requested portion. A fully filled order has completed the requested quantity, while a canceled order may still have historical fills. Expired or rejected orders should be documented separately. The simulator may support different order states or restrictions, so verify what the application actually records. If Example ETF cannot be represented in the simulator, complete the exercise as a fictional execution worksheet rather than substituting a real ticker.
Run the Demo Comparison and Build an Execution Log
Begin the hands-on workflow by opening a simulated order ticket or an equivalent paper worksheet. Record the quotation before every experiment: bid $49.90, ask $50.10, midpoint $50.00, and quoted spread $0.20 or 0.40% of midpoint. Then complete the market-order case using 60 shares at $50.10 and 40 at $50.25. Calculate total cost of $5,016, average fill of $50.16, ask-referenced slippage of $6, and midpoint-referenced cost of $16. Preserve the original quotation rather than changing it after the example fills.
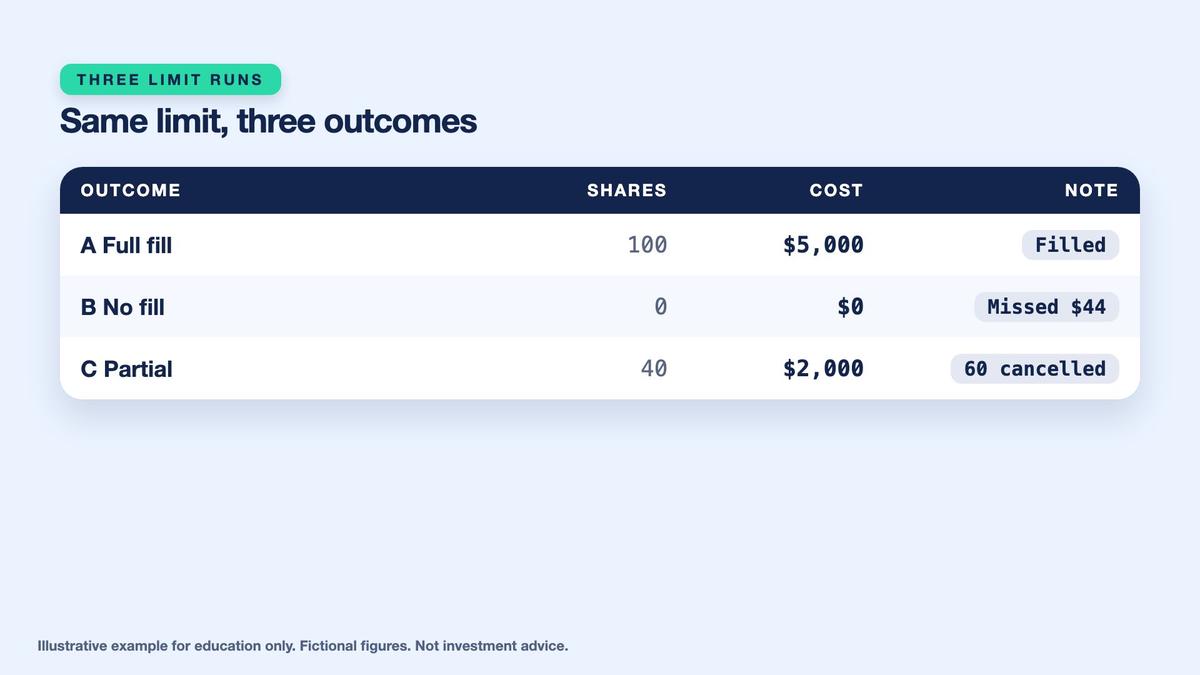
Next, evaluate three alternative limit-order simulations using the same $50.00 buy limit and a requested quantity of 100 shares. Scenario A fills every share for $5,000. Scenario B remains completely unfilled while the hypothetical market rises to $50.60, yielding $44 of missed unrealized gain relative to the completed market purchase. Scenario C fills 40 shares for $2,000 and cancels the remaining 60. Finally, analyze the separate $49.00 sell-stop trigger that fills at $48.70, creating $30 of stop-referenced slippage across 100 shares.
Key points
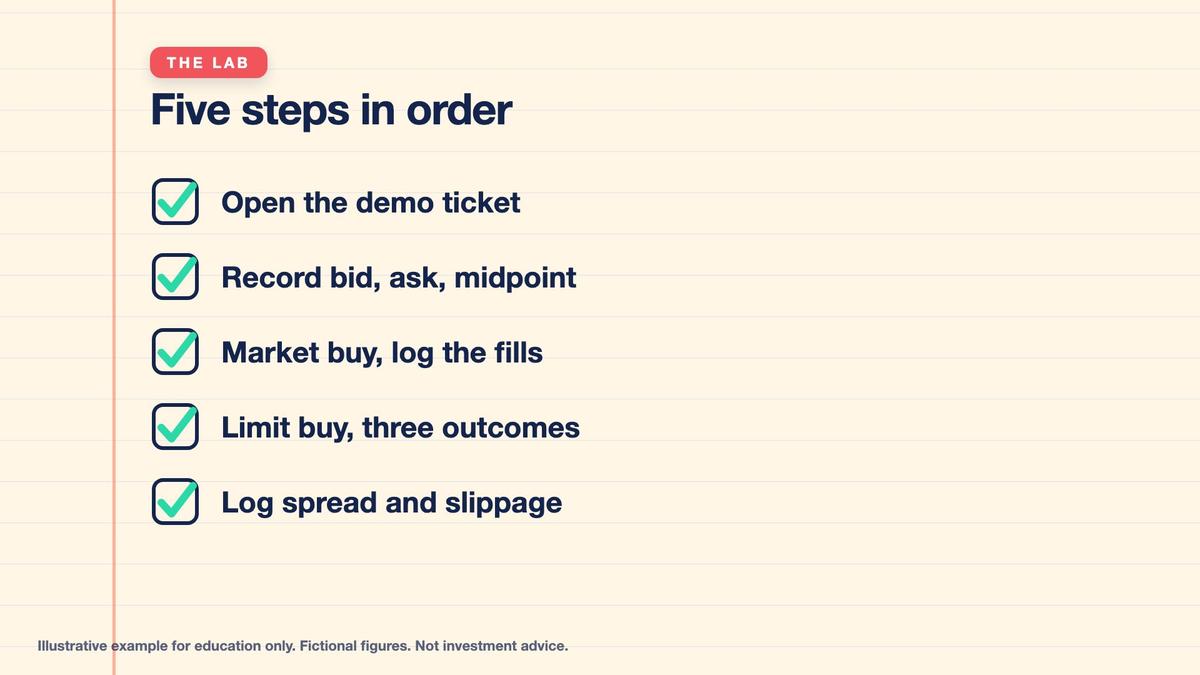
- Run the lab in order: open the ticket, record the quote, market buy, three limit runs, log.
- Verify the symbol, side, quantity, order type, limit price and time in force before submitting.
- Day orders expire after the session; good-till-cancelled orders can persist, subject to platform rules.
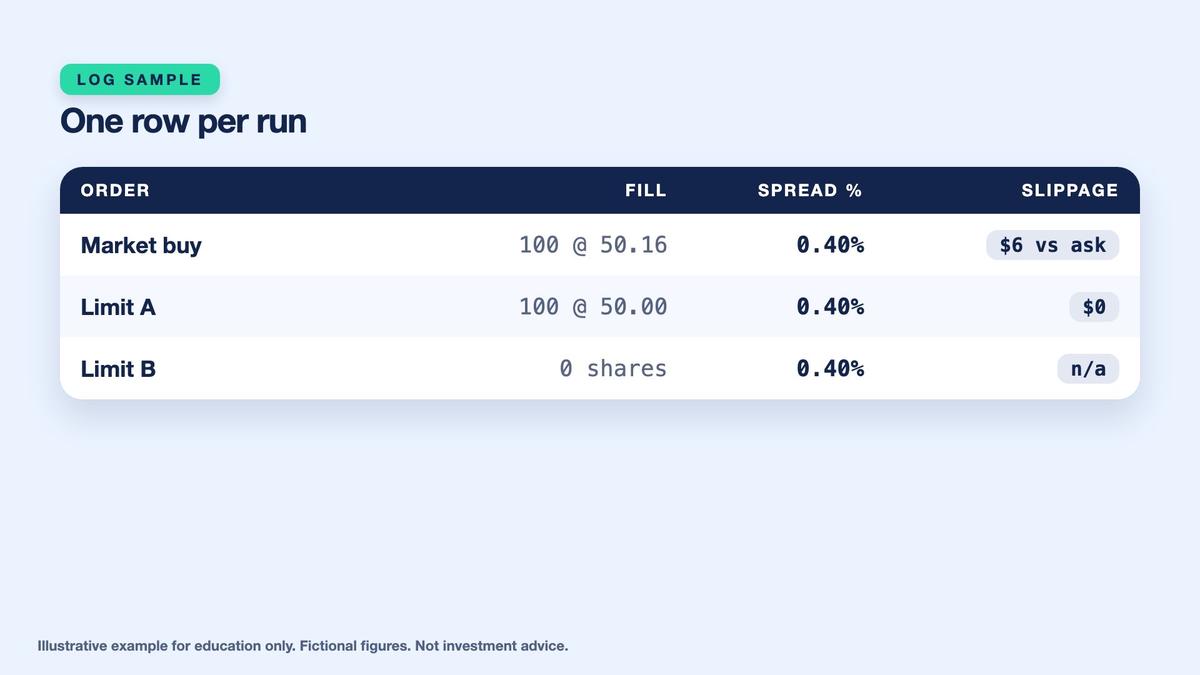
Maintain an execution log containing date, fictional symbol, side, order type, requested quantity, bid, ask, midpoint, limit or stop price, fill price, filled quantity, remaining quantity, spread in dollars, spread percentage, slippage amount, reference price, order status, and notes. For multiple fills, record both the individual executions and weighted average price. Clearly label hypothetical outcomes, because the three limit scenarios cannot all happen to the same 100-share order in one account history. Keep the log dated and retain the original intended plan for comparison.
Final Checkpoint: Compare Execution Quality Without Predicting Returns
The final checkpoint starts with bid-ask mathematics. Example ETF has bid $49.90, ask $50.10, midpoint $50.00, and quoted spread $0.20 or 0.40% of midpoint. The market buy consumes 60 shares at $50.10 and 40 shares at $50.25, costing $5,016 for an average fill of $50.16. Ask-referenced slippage is $6, while the total midpoint-referenced cost is $16. Explain why these two figures overlap rather than represent independent charges. A separate immediate ask-to-bid round trip loses $20 on 100 shares.

Practice Lab: Compare Market and Limit Execution and Log the Spread
Use only fictional Example ETF and an isolated simulated demo account or paper execution worksheet. Begin with a displayed bid of $49.90, ask of $50.10, and a goal of buying 100 shares. Calculate the midpoint and spread. Simulate the market buy using 60 shares at $50.10 and 40 shares at $50.25. Evaluate three mutually exclusive limit-buy scenarios at $50.00: complete fill, no fill while price rises to $50.60, and a partial fill of 40 shares followed by cancellation of the remaining 60. Examine a separate sell-stop illustration with a $49.00 trigger and $48.70 fill. Record all quotations, execution references, fill quantities, prices, slippage, order status, and notes. The numerical examples ignore commissions, taxes, and any additional charges not specified.
- Decision 1: Fictional Example ETF displays a bid of $49.90 and an ask of $50.10, while the learner intends to purchase 100 shares. — Calculate the midpoint, spread per share, spread percentage relative to midpoint, and immediate round-trip loss if buying at the ask and selling at the bid.
- Decision 2: The market buy for 100 shares fills 60 shares at $50.10 and 40 shares at $50.25, using the initial $50.10 ask and $50.00 midpoint as references. — Calculate total execution cost, average fill price, slippage versus the original ask, and execution cost versus midpoint.
- Decision 3: A separate 100-share limit buy at $50.00 has three possible outcomes: full execution, no execution while the market reaches $50.60, or 40 shares executed with the remaining 60 later canceled. — Calculate the purchase value or unfilled quantity in each scenario and compare the full-fill and missed-fill outcomes with the earlier market order.
- Decision 4: A separate fictional 100-share position uses a sell-stop trigger of $49.00, but a price gap causes execution at $48.70. — Calculate the adverse stop slippage per share and total for 100 shares, and explain whether the stop guarantees an exit at $49.00.
- Decision 5: The learner has completed separate market, full-limit, missed-limit, partial-limit, and stop-gap examples and must preserve a reproducible journal without blending alternative outcomes. — Identify the essential execution log fields, choose how to document day versus good-till-cancelled instructions, and explain what to do with a partial fill.
Answer key
For the limit comparison, a fully executed $50.00 limit purchase costs $5,000, which is $16 less than the market order. An unfilled limit during a rise to $50.60 produces zero owned shares and misses a hypothetical $44 unrealized gain relative to the market purchase. A partial limit execution of 40 shares at $50.00 costs $2,000 and leaves 60 unfilled shares that can be canceled. A separate sell stop triggered at $49.00 and filled at $48.70 creates $30 of adverse stop slippage across 100 shares.
Key points
- Log the date, instrument, side, type, quantity, bid, ask, limit, fill price and quantity, spread, slippage, status and note.
- Use one reference price consistently so rows can be compared.
- Educational only, with simulated money. Not investment advice.
Finish by explaining the core trade-off: market orders seek prompt execution but do not guarantee prices, while limit orders control acceptable execution prices but may not fill. Stops define triggering conditions without guaranteeing exit prices. Log all quotation references, individual fills, total costs, pending quantities, time-in-force instructions, and final order statuses. The lab's outcome is an accurate simulated comparison of market and limit execution with a documented spread and slippage calculation. No actual ETF, real-money order, or investment recommendation is involved.
Worked example at a glance
Key terms
- Bid: the highest displayed price a buyer is offering.
- Ask: the lowest displayed price a seller is offering.
- Spread: ask minus bid; a cost of trading.
- Midpoint: the average of bid and ask.
- Market order: an instruction to trade promptly at available prices.
- Limit order: an instruction to trade only at a set price or better.
- Stop order: an instruction that activates when a trigger price is reached.
- Slippage: the difference between the fill price and a stated reference price.
- Average fill: total cost divided by shares, across all fills.
- Partial fill: an order that fills only part of the requested quantity.
- Time in force: how long an order stays active, such as day or good-till-cancelled.
- Execution log: your record of quotes, orders, fills, costs and status.
Multi Asset Trading Lab is an educational course and does not provide personalized investment, trading, financial, accounting, legal, or tax advice. Example ETF is entirely fictional, and every quoted bid, ask, midpoint, order-book level, share quantity, simulated order, fill, gain, loss, spread, stop price, and execution outcome is hypothetical. All activities use simulated money only; no real-money trading, brokerage connection, actual ETF purchase, or financial transaction is required or encouraged. A quoted bid or ask represents displayed market interest at a particular time and does not guarantee unlimited available quantity, immediate execution, or a lasting price. The initial $49.90 bid and $50.10 ask imply a $50.00 midpoint, a $0.20 quoted spread, and a 0.40% midpoint-relative spread. A market order seeks prompt execution at available prices but cannot guarantee its execution price, complete fill, speed, or absence of trading costs. The fictional 100-share market buy assumes 60 shares execute at $50.10 and 40 shares at $50.25, generating exactly $5,016 total purchase cost and a $50.16 average fill. The $6 adverse slippage versus the initial $50.10 ask and the $16 execution cost versus the $50.00 midpoint are overlapping comparisons and must not be added together. A limit order sets an acceptable execution-price boundary but may remain pending, execute partially, or never fill. The three $50.00 limit scenarios are mutually exclusive illustrations, not events that all occur for one order: a fully filled 100-share order costs $5,000; an unfilled order owns zero shares when the hypothetical price reaches $50.60; and a partially filled order purchases 40 shares for $2,000 before the remaining 60 are canceled. The $44 missed gain comparison in the unfilled scenario is hypothetical and unrealized, calculated relative to the earlier $50.16 market fill, and is not an actual account loss or guaranteed opportunity. An immediate buy at the $50.10 ask followed by an immediate sale at the $49.90 bid would lose $20 across 100 shares under unchanged quotation assumptions, approximately 0.40% of the $5,010 initial purchase cost, before any additional fees. A sell stop-market order is triggered by specified conditions but does not guarantee the trigger price as its execution price. The separate fictional stop example assumes a $49.00 trigger and $48.70 fill, creating $0.30 per share or $30 additional adverse execution loss across 100 shares relative to the planned stop. The overall realized loss on such a position also depends on its original entry price and other costs. Actual stops can fill at worse prices because of price gaps, volatility, liquidity shortages, order-processing delays, and other market conditions. Stop-limit instructions, where supported, may restrict the acceptable price but can remain unfilled. Time-in-force descriptions are general educational explanations; exact day-order expiration, good-till-cancelled duration, session eligibility, cancellation behavior, and order status depend on the simulator or platform rules. Canceling unfilled shares does not reverse transactions already executed. The examples exclude commissions, taxes, exchange charges, other liquidity effects, and changing quotations except where explicitly stated. Market execution and order-book examples are simplified and should not be interpreted as predictions of actual exchange behavior. A demo platform may simulate fills using different assumptions or monitoring intervals, so any simulated result must be labeled according to its stated implementation. Learners should verify order symbol, side, quantity, order type, limits, stop conditions, time in force, and review rules before submitting a demo order; they should also preserve timestamps, original quotations, individual fills, average prices, slippage references, order statuses, canceled quantities, and journal notes. If fictional Example ETF is unavailable in the simulator, complete the lab using a paper execution worksheet rather than substituting a real ticker. None of the illustrated orders, execution methods, prices, returns, or risk controls constitutes a recommendation to buy, sell, or hold any real financial instrument. Historical, hypothetical, or simulated execution outcomes do not guarantee future results.
Lesson Checkpoint
Review what you learned and get feedback on your work.