



In this fourteen-minute beginner lesson, learners examine why owning multiple ETFs does not automatically create diversification and learn to identify repeated holdings through portfolio look-through analysis. Using fictional Example Broad ETF and Example Growth ETF, learners calculate disclosed top-holdings overlap, combined company exposures, and concentration across a simulated portfolio. They also explore the distinct purposes and risks of cash, bonds, and equities through a hypothetical stress scenario, bond-duration approximation, and inflation-adjusted cash calculation. The lesson prepares learners to measure portfolio weights and understand defensive assets before practicing spreadsheet rebalancing.
Why Two ETFs Do Not Automatically Mean Diversification
Owning two exchange-traded funds does not necessarily create two independent sets of investments. Each fund is a wrapper containing underlying securities, and those securities can repeat across different funds. Portfolio overlap occurs when the same underlying holding appears in more than one portfolio. Two ETFs can have different names, strategies, or marketing descriptions while still investing in some of the same companies. Counting the number of fund products is therefore not equivalent to measuring the number of independent business exposures or investment risks.

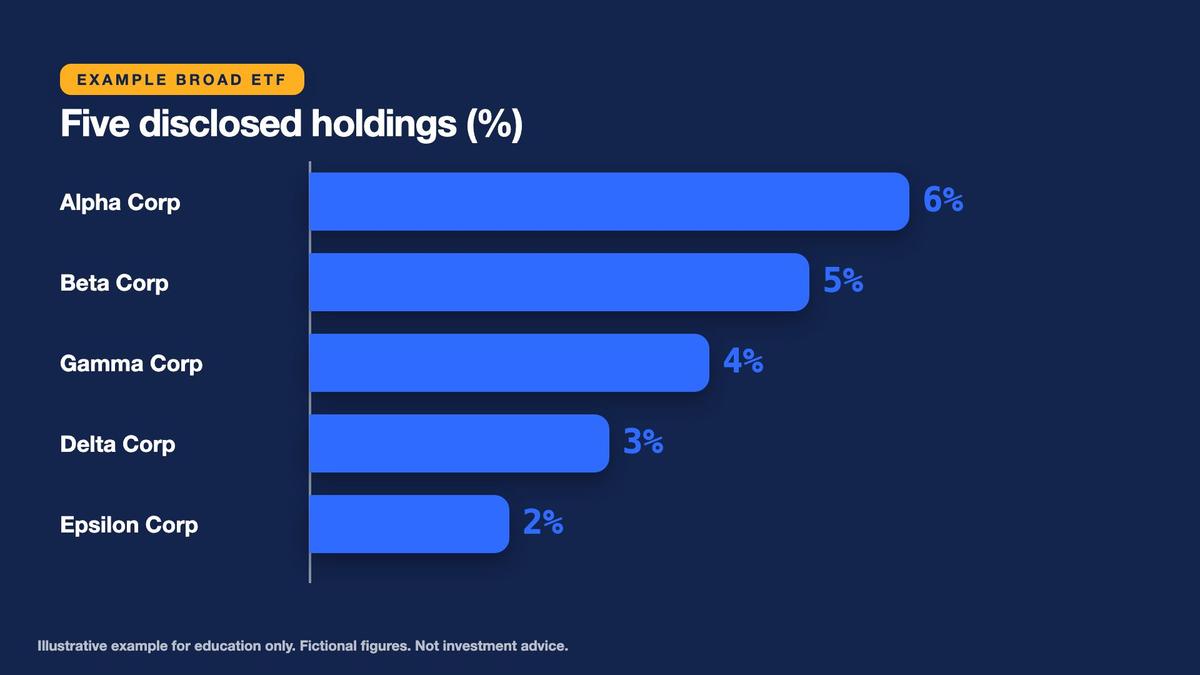
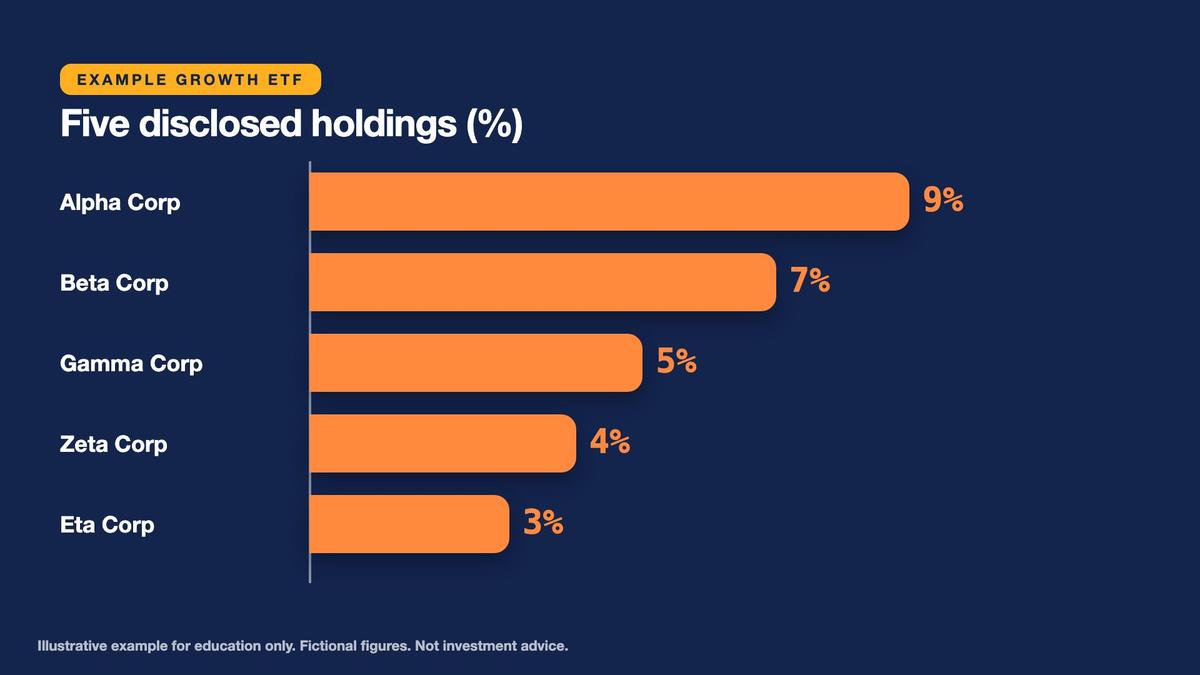
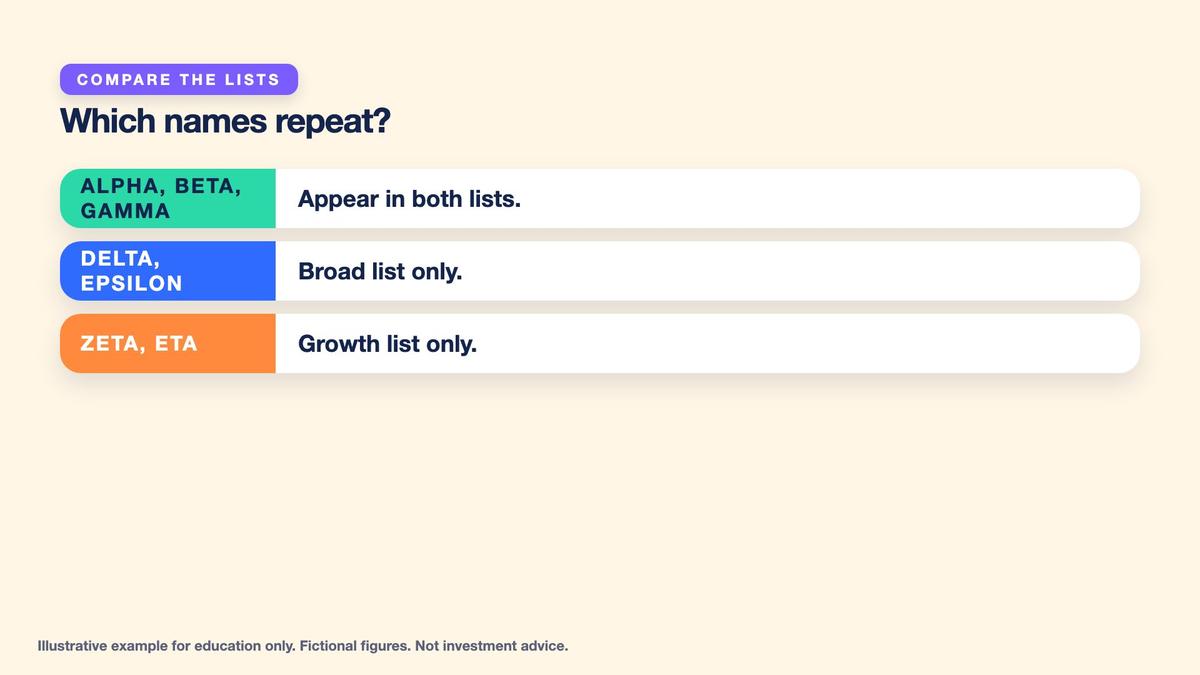
Our hypothetical Example Broad ETF and Example Growth ETF illustrate this issue. Broad includes Alpha Corp, Beta Corp, Gamma Corp, Delta Corp, and Epsilon Corp among its displayed leading holdings. Growth includes Alpha Corp, Beta Corp, Gamma Corp, Zeta Corp, and Eta Corp. Alpha, Beta, and Gamma appear in both disclosed lists. The remaining holdings are grouped under an other category, so we cannot establish complete portfolio overlap from the displayed positions alone. Real research would require sufficiently detailed holdings disclosures from comparable reporting dates.

Key points
- Owning two funds does not guarantee diversification.
- Overlap means the same holding appears in more than one fund.
- Fund names can differ while the holdings repeat.
The purpose of looking through funds is not to eliminate every repeated holding. Some overlap may be intentional because an investor wants additional exposure to a particular type of business or strategy. Low overlap does not automatically make a portfolio safer either. Different companies may share sector, economic, interest-rate, or valuation risks. The educational goal is to identify where exposures repeat, calculate their combined sizes, and decide whether those concentrations match the stated hypothetical portfolio purpose.

Identify Shared Holdings and Calculate Portfolio Overlap
Example Broad ETF's disclosed weights are Alpha Corp 6%, Beta Corp 5%, Gamma Corp 4%, Delta Corp 3%, and Epsilon Corp 2%, with all other holdings representing 80%. These percentages sum to exactly 100%. Example Growth ETF's disclosed weights are Alpha 9%, Beta 7%, Gamma 5%, Zeta 4%, and Eta 3%, with remaining holdings representing 72%. Those percentages also sum to 100%. We will compare the three confirmed shared names rather than assume that the undisclosed holdings are entirely different.
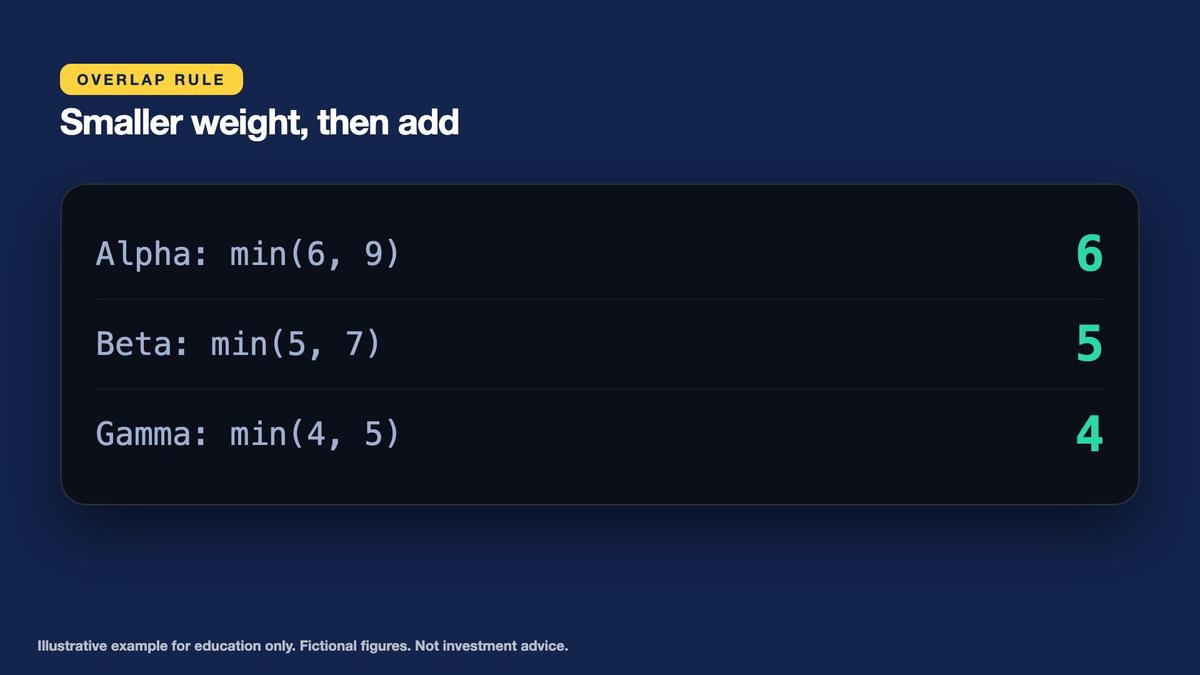
One straightforward overlap measure takes the smaller weight in each shared holding and adds those amounts. Alpha contributes the smaller of 6% and 9%, which is 6 percentage points. Beta contributes the smaller of 5% and 7%, or 5 points. Gamma contributes the smaller of 4% and 5%, or 4 points. Adding these gives exactly 15 percentage points of confirmed overlap among the displayed names. The minimum-weight method measures the common portfolio-weight portion of the two funds under the chosen holdings comparison.
Key points
- Overlap of disclosed top holdings = sum of the smaller weights of shared names.
- Alpha min(6,9)=6, Beta min(5,7)=5, Gamma min(4,5)=4: total 15 points.
- Others are grouped, so 15 points is confirmed overlap, not necessarily the total.
Because the other holdings are not itemized, the 15% figure is not necessarily the full overlap between the funds. The same company may appear in both undisclosed groups, or a displayed company in one fund may appear within the other's undisclosed group. A comprehensive overlap calculation requires comparable full holdings lists and consistent security identification. Researchers should also verify that holding weights come from the same or reasonably comparable dates. Do not present a partial top-holdings calculation as if it proves that every other security is different.
Calculate Combined Exposure Across a Portfolio
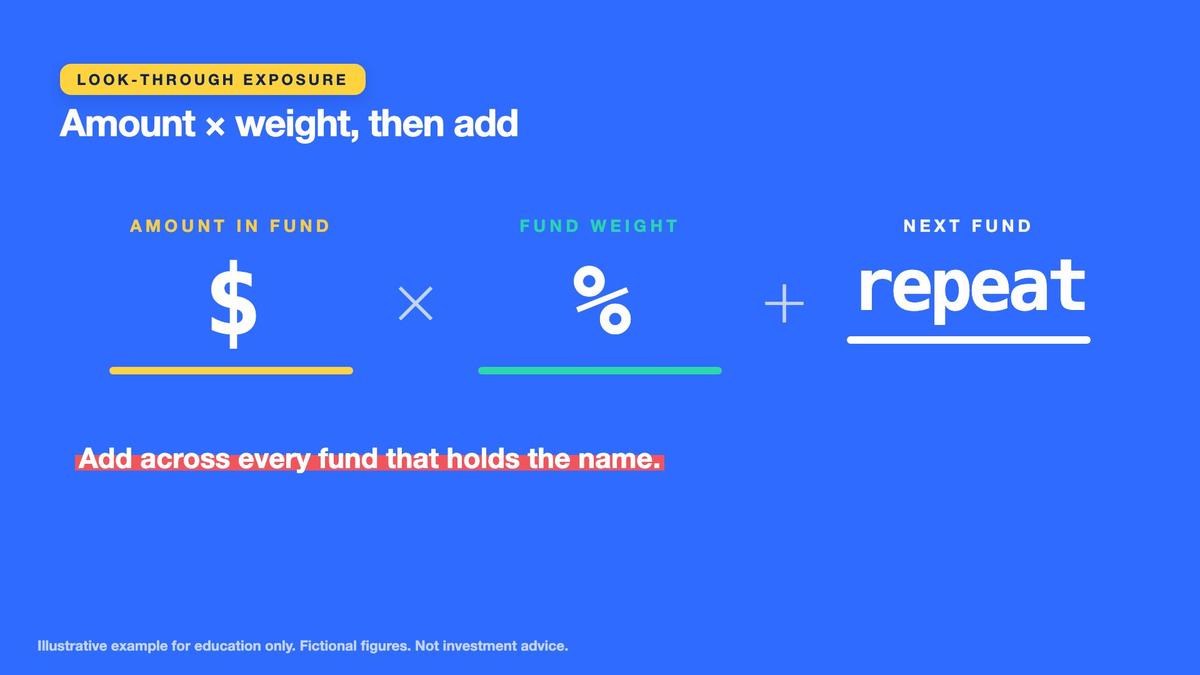
Fund overlap and actual portfolio concentration are related but different measurements. The minimum-weight method compares the composition of two funds, while combined exposure measures how much of the learner's overall portfolio is invested in one company through every fund. Suppose a simulated $10,000 portfolio allocates $6,000, or 60%, to Example Broad ETF and $4,000, or 40%, to Example Growth ETF. For each company, multiply the investment in each fund by its weight in that company and add the resulting dollar amounts.
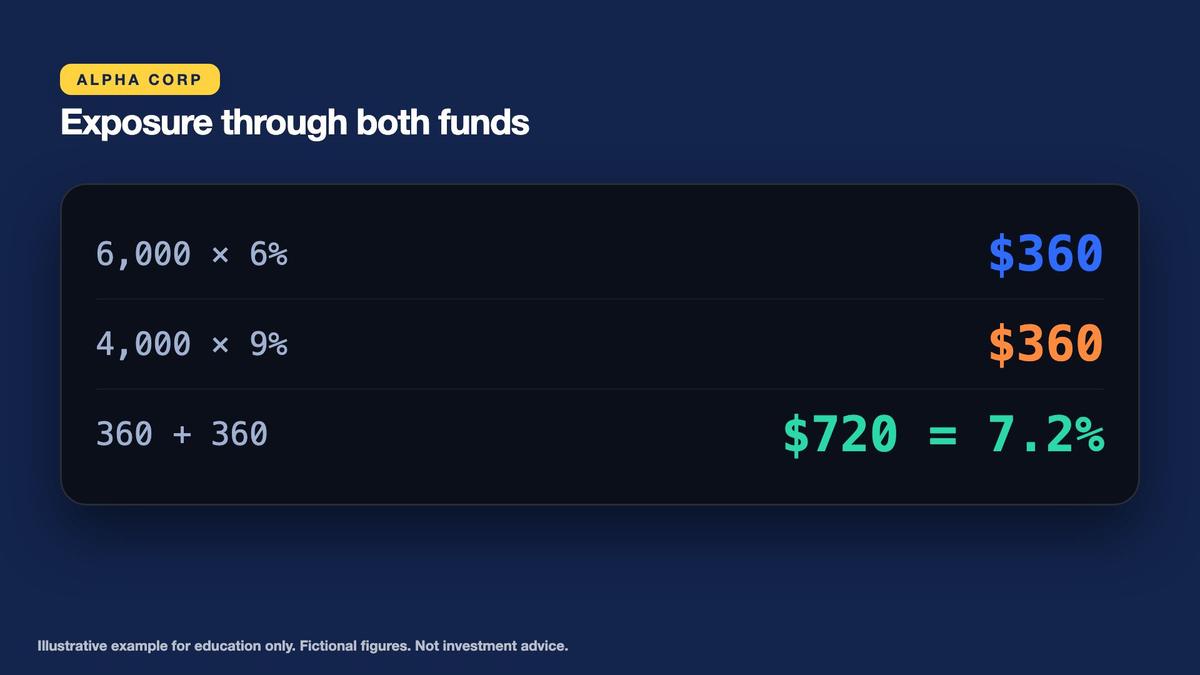
Alpha Corp represents 6% of Broad and 9% of Growth. The Broad allocation contributes $6,000 multiplied by 6%, or $360. Growth contributes $4,000 multiplied by 9%, also $360. Combined Alpha exposure is exactly $720, equal to 7.2% of the full portfolio. Beta Corp contributes $300 from Broad and $280 from Growth, totaling $580 or 5.8%. Gamma contributes $240 from Broad and $200 from Growth, totaling $440 or 4.4%. All calculations use the stated hypothetical investment values.
Key points
- Combined exposure = sum of (amount in each fund × its weight in the company).
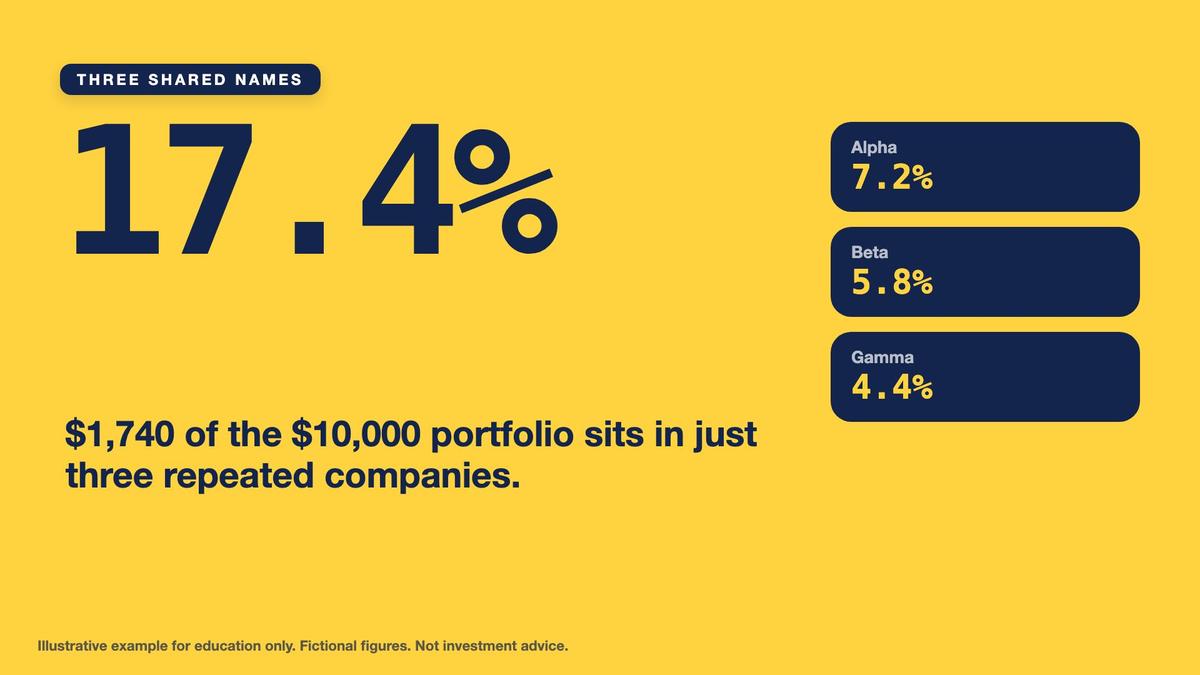
- Alpha $720 (7.2%), Beta $580 (5.8%), Gamma $440 (4.4%).
- The three names together: $1,740, or 17.4% of the $10,000 portfolio.
Together, Alpha, Beta, and Gamma account for $720 plus $580 plus $440, totaling exactly $1,740, or 17.4% of the overall portfolio. A portfolio invested entirely in Example Broad ETF would have 6% exposure to Alpha, whereas the combined allocation has 7.2%. This shows how adding another fund can increase exposure to a repeated company. However, the 17.4% combined exposure and the 15% minimum-weight overlap measure answer different questions and should not be treated as interchangeable statistics.
Defensive Assets: Different Roles for Cash, Bonds, and Equities
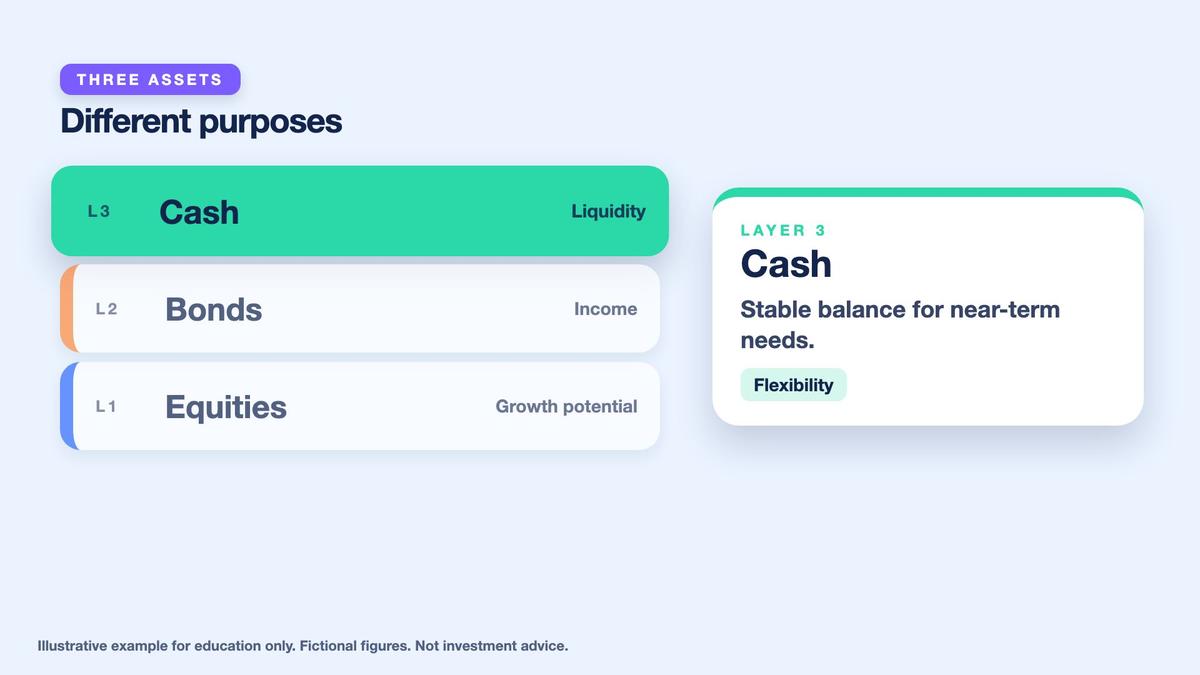
Portfolio allocation involves choosing exposures with different intended roles. Equities represent ownership in businesses and may offer long-term growth, but market prices can move sharply. Cash and cash-like holdings can provide liquidity for near-term spending needs, planned transactions, or unexpected expenses. Bonds generally represent loans to issuers, including hypothetical governments or companies, and may provide interest income and a different pattern of returns. These roles are educational categories rather than universal instructions about how much of any asset a person should own.
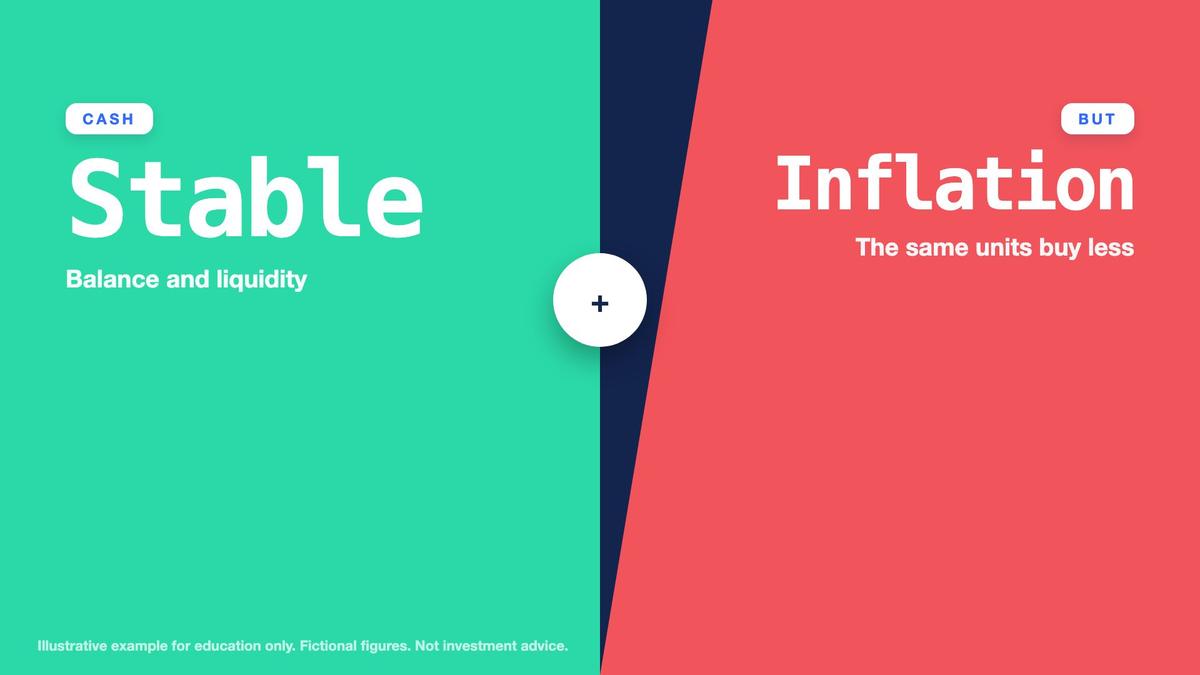
Cash often has relatively stable nominal value when held in a suitable account, but its purchasing power can decline because of inflation. It may also face institution, currency, and other risks depending on how it is held. Bonds and bond funds can help reduce portfolio volatility in some circumstances, but they are not risk-free. Bond prices respond to interest rates, issuers may default, and unexpected inflation can reduce the real value of future payments. Bond funds also fluctuate in price and need not preserve an initial purchase amount.
Key points
- Equities aim for growth, bonds for income and a smoother ride, cash for liquidity.
- Cash can lose purchasing power to inflation.
- Defensive assets reduce swings but do not remove losses.
Defensive assets do not always rise when stocks fall. Equity and bond markets may both experience losses during certain economic conditions, particularly when interest rates or inflation expectations change sharply. Cash can preserve nominal flexibility while failing to maintain real purchasing power. Conversely, cash and bonds may lag during strong equity markets. The appropriate allocation depends on purpose, time horizon, liquidity requirements, risk tolerance, and other personal circumstances. In this course, all allocations are hypothetical examples rather than recommendations.
Bond Duration and Why Bond Funds Can Lose Value
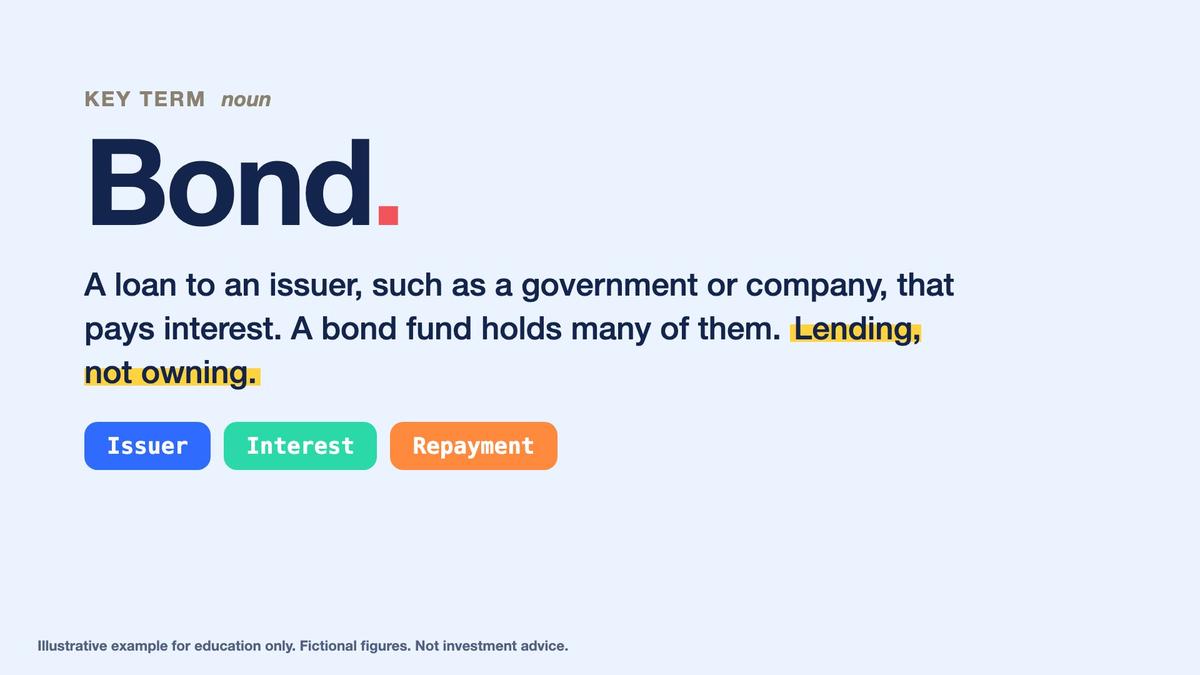
A bond is a contractual debt instrument under which an issuer generally agrees to make specified payments according to its terms. A bond fund holds a portfolio of debt securities rather than a single loan. Bond prices and market yields typically move in opposite directions: when prevailing yields rise, existing fixed-income payments often become less attractive relative to newly available yields, reducing the prices investors are willing to pay. Credit quality, maturity, inflation expectations, and other contractual characteristics also influence bond valuations.
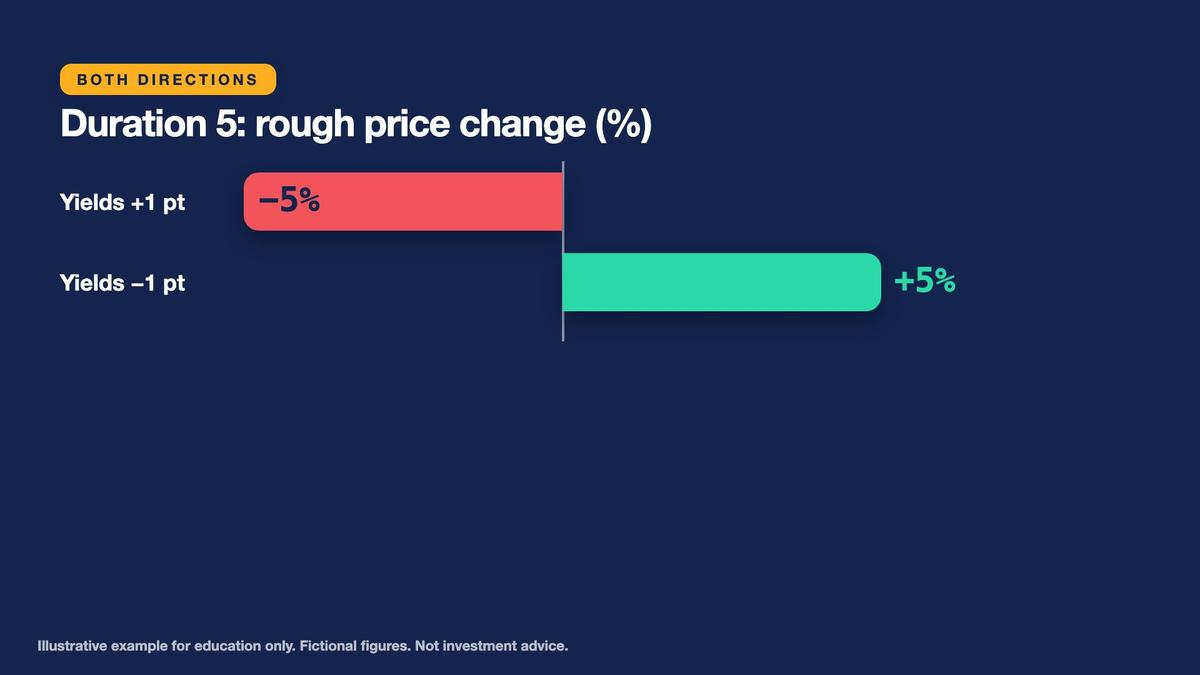
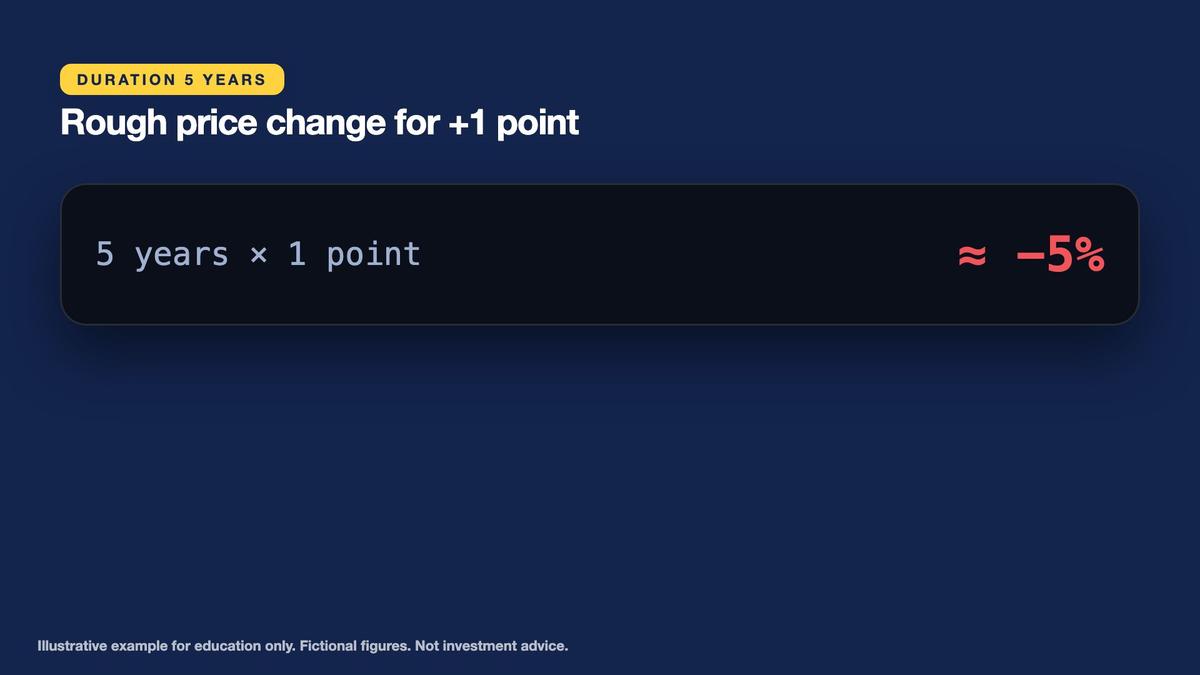
Duration provides a useful approximation of price sensitivity to a small yield change. For a hypothetical Example Bond Fund with modified duration of five years, an increase in market yields of one percentage point, or 0.01, implies an approximate price change of negative five multiplied by 0.01, or negative 0.05. Expressed as a percentage, the estimated price change is negative 5%. If the fund begins at $3,000, this approximation would reduce its value to $2,850, a loss of $150 before other effects.
Key points
- Duration is a rough measure of bond price sensitivity to yields.
- Duration 5 and yields +1 point: about -5% (an approximation).
- Bonds are not risk-free: rates, default and inflation all matter.
The duration calculation is a first-order approximation rather than a complete prediction. Convexity can cause the actual price response to differ from the linear estimate, especially for larger yield changes. Yield-curve movements may not affect every bond equally, and the fund's holdings and duration can change over time. Coupon income, fund distributions, fees, credit-spread movements, and defaults can also influence realized returns. A bond fund's duration helps describe one type of risk, but it does not determine every possible outcome.
Stress-Test a Mixed Equity, Bond, and Cash Portfolio
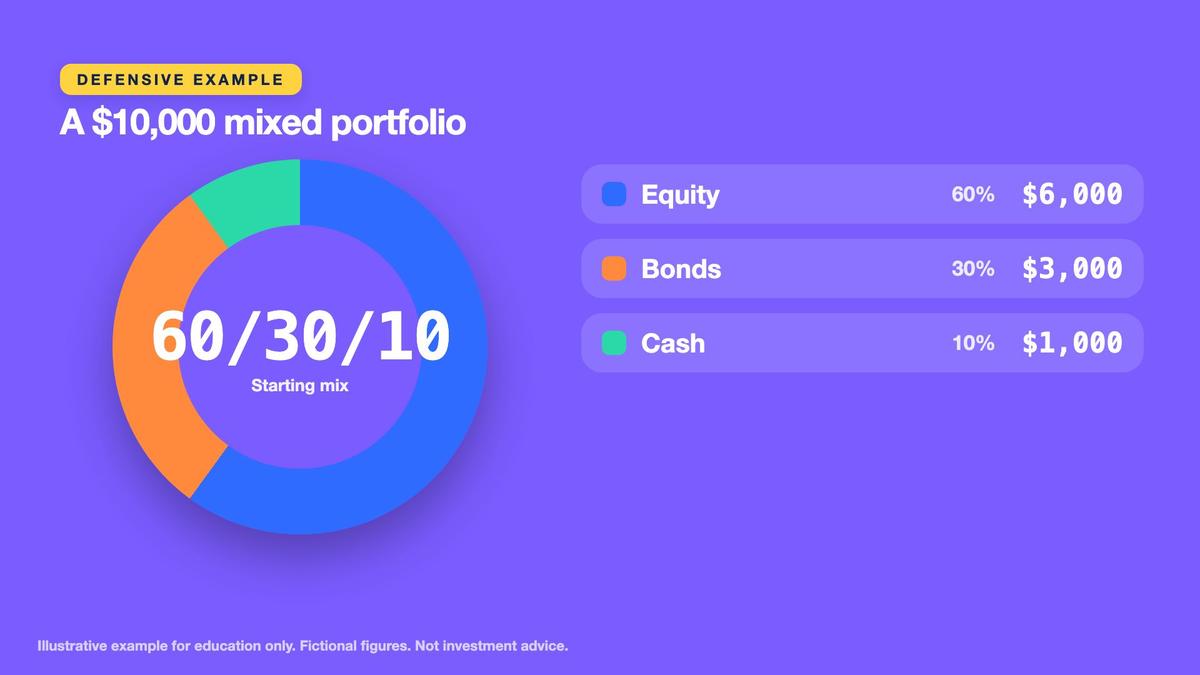
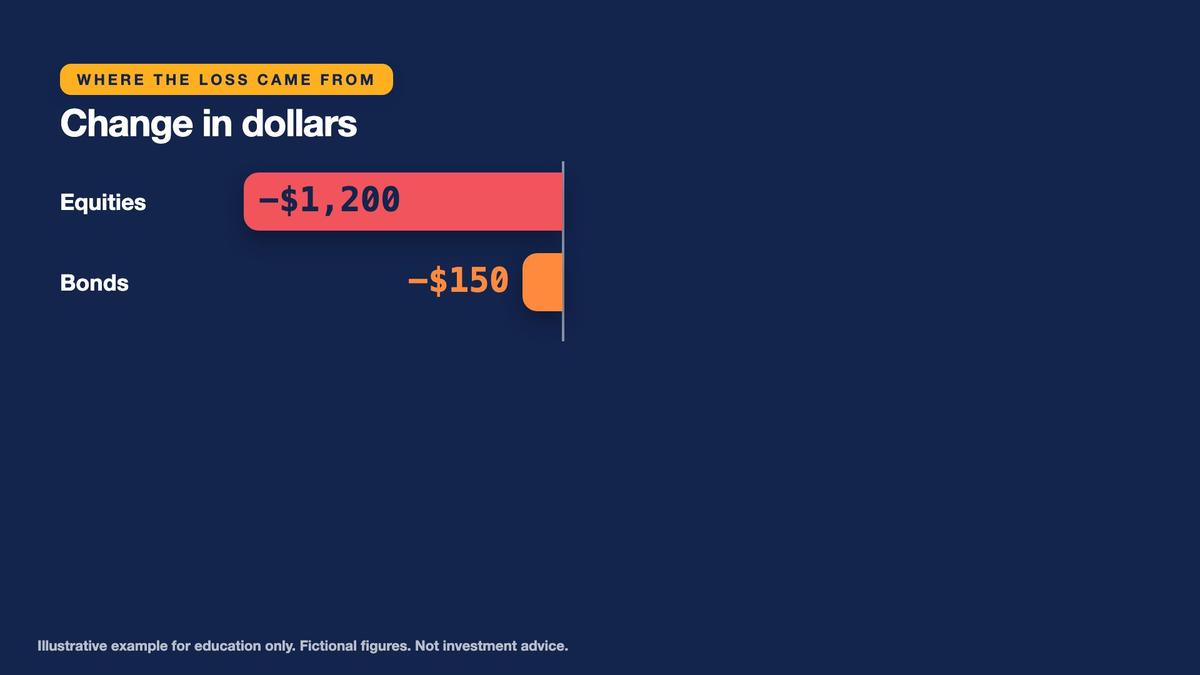
Consider a separate hypothetical $10,000 portfolio divided into $6,000 of equity exposure, $3,000 in Example Bond Fund, and $1,000 in cash. The initial allocation is therefore 60% equities, 30% bonds, and 10% cash. This is a simulated stress-testing example, not an allocation recommendation. Assume equities decline 20% during the period. The equity portion loses $1,200 and ends at $4,800. Also assume the bond fund experiences the approximate 5% price decline described by the five-year duration illustration.
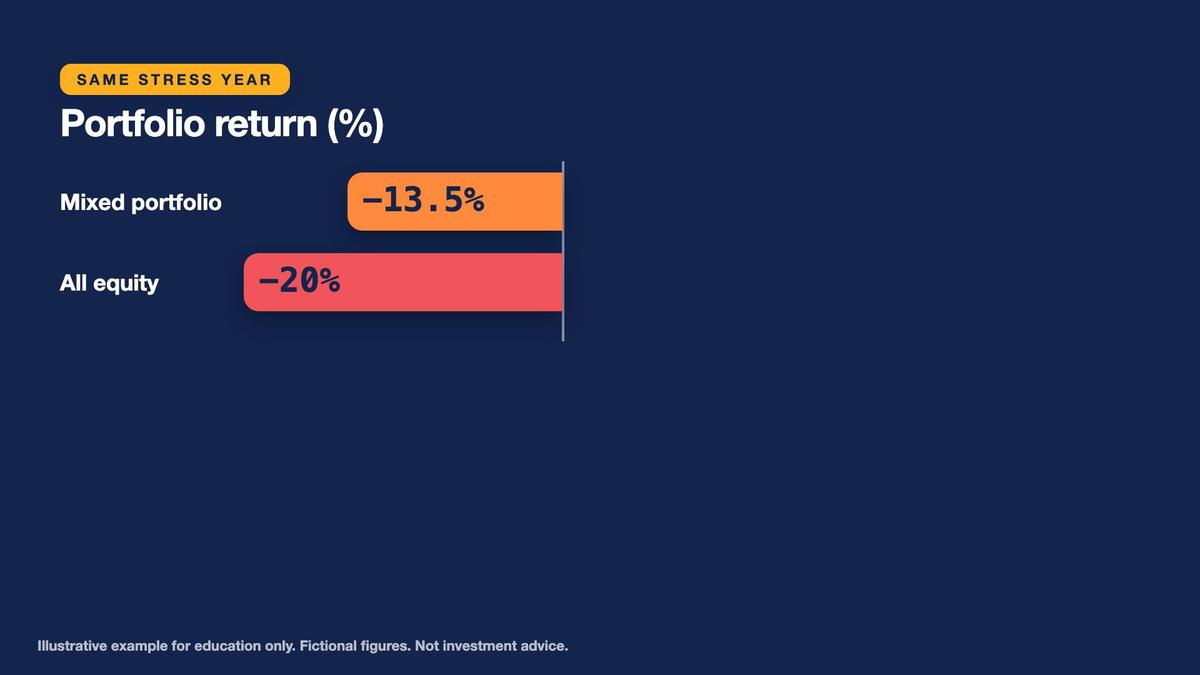
The $3,000 bond allocation declines by $150 to $2,850. Assume cash remains unchanged at $1,000, with no interest, fees, or inflation adjustment included in this stress calculation. Adding the ending amounts gives $4,800 plus $2,850 plus $1,000, or exactly $8,650. The portfolio loses $1,350, corresponding to negative 13.5% of the initial $10,000. For comparison, a hypothetical $10,000 portfolio invested entirely in equities and experiencing the same 20% equity decline would finish at $8,000, a $2,000 loss.
Key points
- Equities -20%: 6,000 to 4,800. Bonds -5%: 3,000 to 2,850. Cash stays 1,000.
- Total 8,650: a loss of 1,350, or -13.5%, versus -20% all equity.
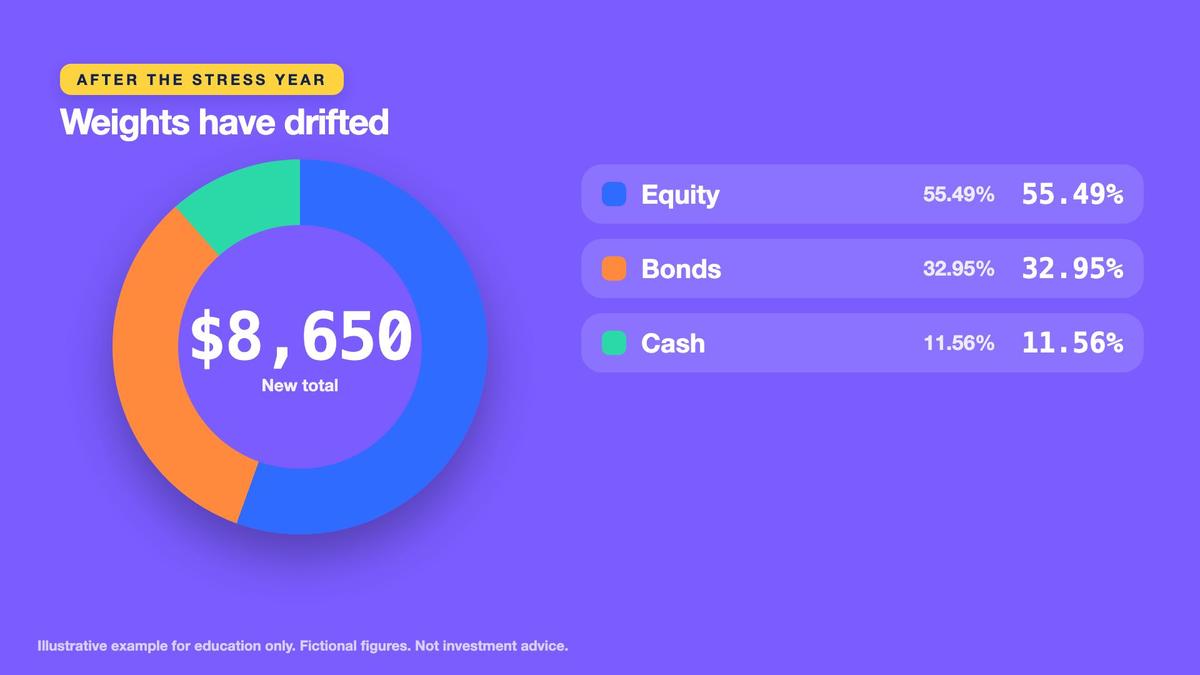
- New weights: 55.49% equity, 32.95% bonds, 11.56% cash.
In this particular scenario, the mixed allocation loses 6.5 percentage points less than the all-equity comparison, but neither portfolio avoids losses. Asset weights also drift because the holdings change by different amounts. Equities represent $4,800 divided by $8,650, approximately 55.49% of the ending portfolio. Bonds represent $2,850 divided by $8,650, approximately 32.95%. Cash represents $1,000 divided by $8,650, approximately 11.56%. These changes prepare learners for the next lesson's spreadsheet rebalancing calculations.
Cash, Inflation, and the Trade-Offs of Defensive Assets
Cash may be useful for maintaining liquidity and meeting upcoming expenses, but an increase in its nominal balance does not necessarily preserve purchasing power. Consider a separate hypothetical example in which $1,000 earns 2% interest over one year. The ending cash balance becomes $1,020. Suppose consumer prices rise 3% over the same period. To measure the ending amount in starting-period purchasing-power terms, divide $1,020 by 1.03, producing approximately $990.29.
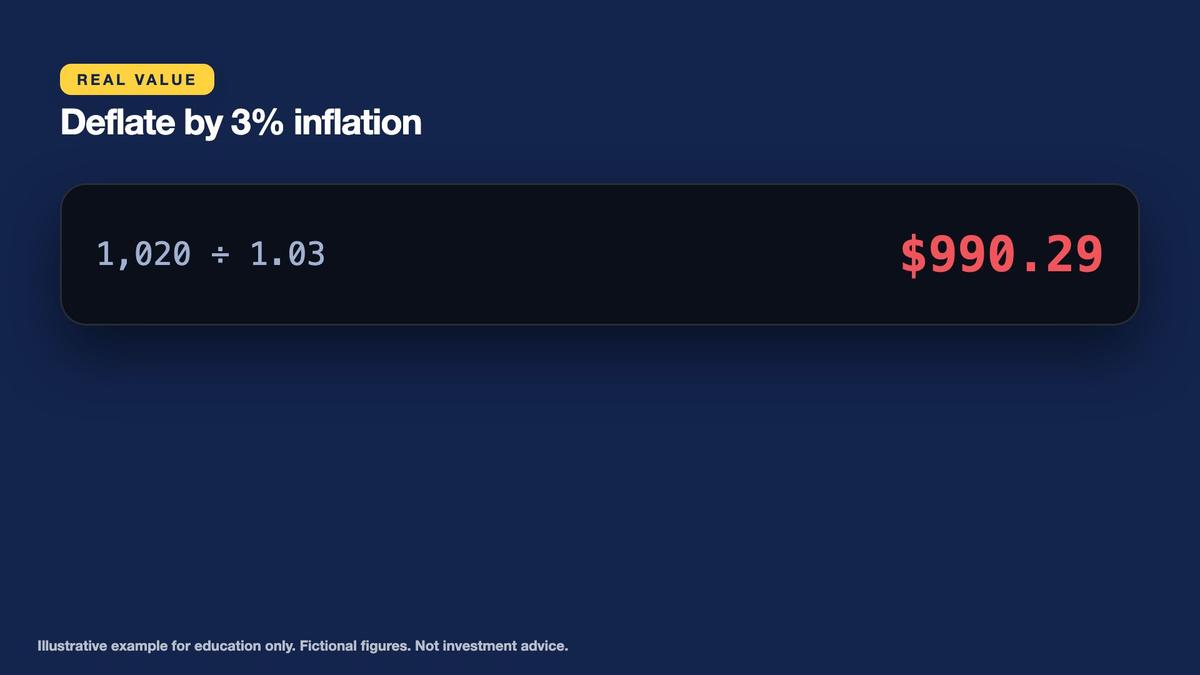
The inflation-adjusted value is approximately $9.71 below the original $1,000 of purchasing power. The exact real return formula is 1.02 divided by 1.03 minus one, equal to approximately negative 0.9709%, or negative 0.97% when rounded to two decimal places. This demonstrates why nominal cash stability and real purchasing-power preservation are not the same objective. The calculation ignores taxes, account fees, and other possible influences for simplicity.
Key points
- Cash earning 2%: 1,000 becomes 1,020.
- With 3% inflation: 1,020 / 1.03 = 990.29 of today's money, about -0.97%.
- Defensive assets can lag in strong markets: that is the trade-off.
Defensive assets involve trade-offs rather than universal protection. Cash can remain readily accessible but may underperform inflation. Bonds may deliver income and sometimes offset equity volatility, yet can decline as yields rise or issuer credit quality worsens. Equities may offer greater growth potential but expose the investor to business and market risks. The correct mix cannot be inferred from a generic illustration. The purpose of this lesson is to identify each asset's function and understand how the combination behaves under explicitly stated hypothetical conditions.
Final Practice: Look Through Funds and Explain Defensive Allocations
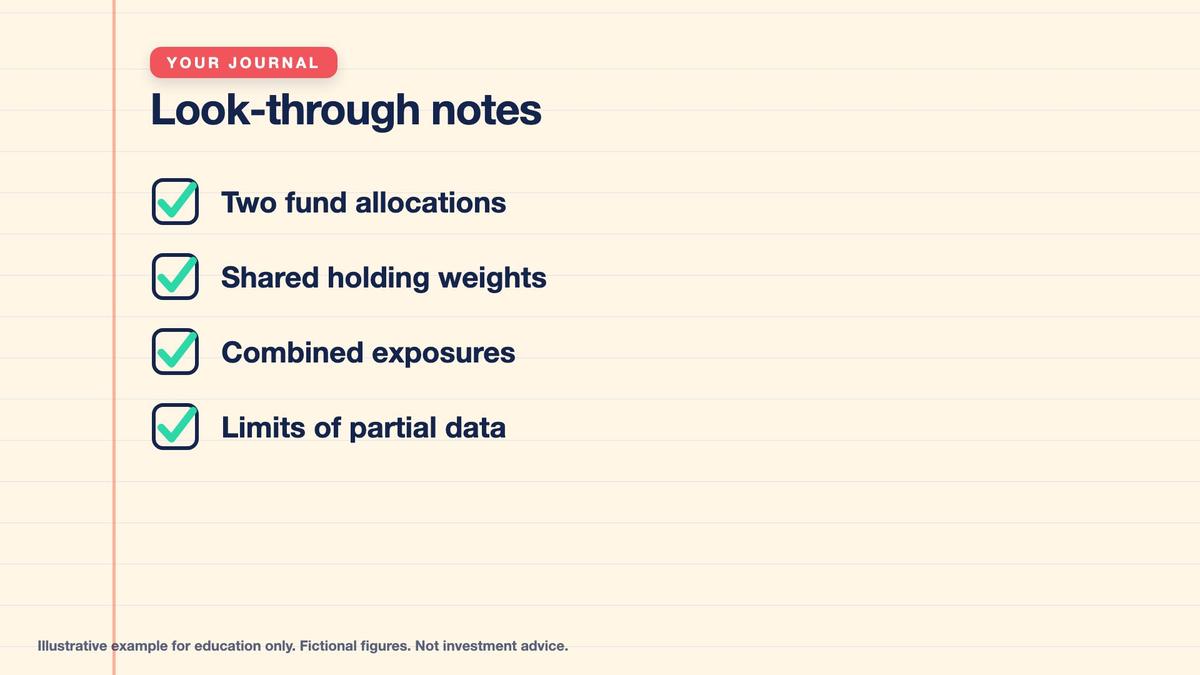
Your final checkpoint begins with Example Broad ETF and Example Growth ETF. Record each disclosed company weight and identify Alpha, Beta, and Gamma as confirmed shared holdings. Apply the smaller-weight formula to calculate 6 plus 5 plus 4, giving 15 percentage points of disclosed overlap. Clearly identify the limitation created by undisclosed other holdings. Then calculate look-through exposure for the $6,000 Broad and $4,000 Growth allocations. The results are $720 for Alpha, $580 for Beta, and $440 for Gamma, totaling $1,740 or 17.4% of the simulated portfolio.
Practice Lab: Identify Repeated Holdings and Test Defensive Assets
Use only fictional Example Broad ETF, Example Growth ETF, Alpha Corp, Beta Corp, Gamma Corp, Delta Corp, Epsilon Corp, Zeta Corp, Eta Corp, and Example Bond Fund. First, calculate confirmed top-holdings overlap using the smaller disclosed weight for each shared security. Then calculate combined company exposure in a simulated $10,000 portfolio containing $6,000 Broad and $4,000 Growth. Treat the undisclosed other holdings as unknown, not necessarily unique. Separately, test a $10,000 portfolio of 60% equities, 30% bonds, and 10% cash under the stated market shock. Round percentages as requested and explain why historical or hypothetical diversification cannot guarantee protection. All calculations are educational and involve simulated money only.
- Decision 1: Example Broad ETF reports Alpha 6%, Beta 5%, Gamma 4%, Delta 3%, Epsilon 2%, and others 80%. Example Growth ETF reports Alpha 9%, Beta 7%, Gamma 5%, Zeta 4%, Eta 3%, and others 72%. — Identify confirmed shared holdings and calculate their minimum-weight overlap, explaining the limitation of the other holdings categories.
- Decision 2: A simulated $10,000 portfolio invests $6,000 in Example Broad ETF and $4,000 in Example Growth ETF. Alpha weights are 6% and 9%, Beta weights are 5% and 7%, and Gamma weights are 4% and 5%. — Calculate the combined dollar and portfolio-percentage exposure to Alpha, Beta, Gamma, and the three holdings together.
- Decision 3: A hypothetical portfolio holds $6,000 equity exposure, $3,000 Example Bond Fund, and $1,000 cash. Equities fall 20%, the bond fund declines approximately 5%, and cash remains unchanged. — Calculate the final value and percentage return of each asset and the entire portfolio, comparing the mixed portfolio with an all-equity alternative.
- Decision 4: The stress-year ending values are $4,800 equities, $2,850 bonds, and $1,000 cash, totaling $8,650. Separately, Example Bond Fund has hypothetical modified duration of five years and yields rise one percentage point. — Calculate the post-shock portfolio weights and explain how duration approximates the bond fund's price change.
- Decision 5: A separate hypothetical cash holding begins at $1,000, earns 2% nominal interest over one year, and experiences 3% consumer-price inflation. — Calculate the ending nominal cash balance, the inflation-adjusted purchasing power, and the real return, then explain why cash is not automatically inflation-proof.
Answer key
Next, explain the purposes of equities, bonds, and cash. Use the separate $10,000 stress example containing $6,000 equities, $3,000 Example Bond Fund, and $1,000 cash. Under the stated 20% equity decline and approximate 5% bond decline, the ending value is $8,650, representing a 13.5% loss. Compare that with the hypothetical $8,000 ending value of an all-equity portfolio. Calculate the new asset weights as approximately 55.49% equities, 32.95% bonds, and 11.56% cash.
Key points
- Record both allocations, shared weights, overlap and combined exposures.
- Record the stress scenario, final value, loss percentage and new weights.
- Educational only, with simulated money. Not investment advice.
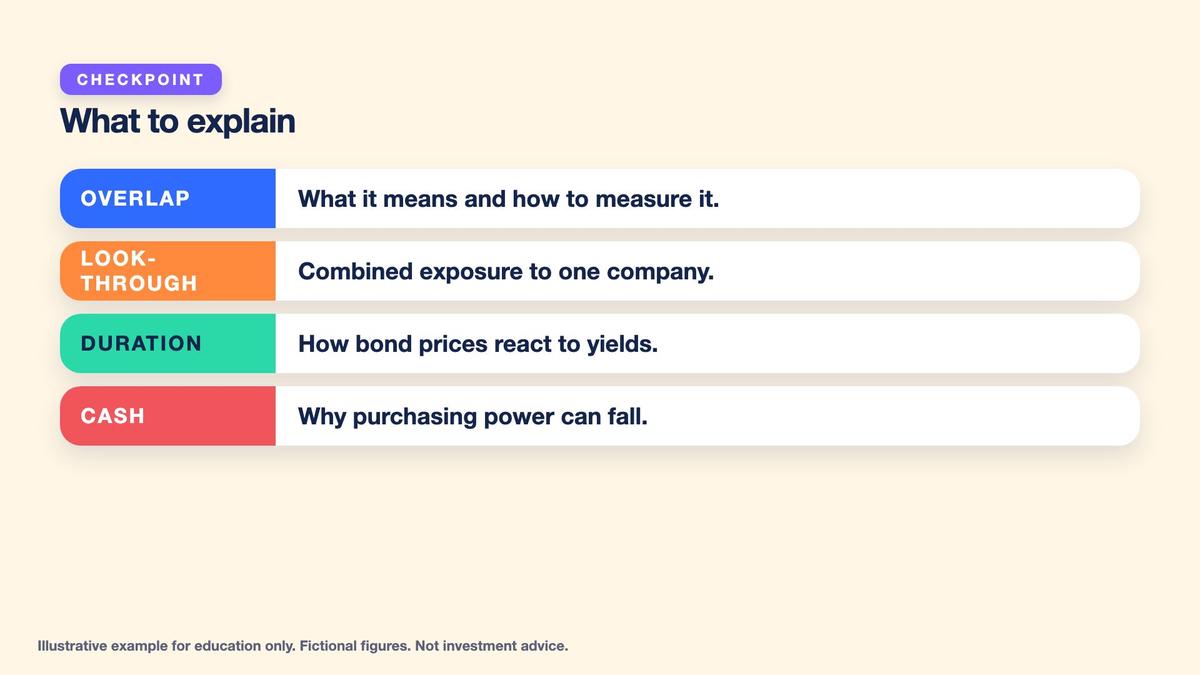
Finish by explaining that duration is an approximation of bond-price sensitivity and that cash can lose purchasing power even while earning nominal interest. A $1,000 cash amount earning 2% becomes $1,020 but is worth approximately $990.29 in starting-period money after 3% inflation. Link the fund-overlap analysis to Lesson Thirteen's holdings disclosures and Lesson Fourteen's distinction between labels and underlying exposures. The next lesson uses a spreadsheet to examine allocation drift and rebalancing. All work remains fictional and educational.
Worked example at a glance
Key terms
- Portfolio overlap: the same underlying holding appearing in more than one fund.
- Look-through: reading what each fund actually owns and combining the holdings.
- Combined exposure: the total amount or share of the portfolio in one company across all funds.
- Concentration: a large share of a portfolio in a few holdings or risks.
- Defensive assets: holdings such as cash and bonds that may reduce portfolio swings.
- Bond: a loan to a government or company that pays interest.
- Bond fund: a fund that holds many bonds.
- Duration: a rough measure of how sensitive a bond price is to yield changes.
- Yield: the return a bond offers, which moves opposite to its price.
- Purchasing power: what a sum of money can buy after inflation.
Multi Asset Trading Lab provides educational information only and does not constitute personalized investment, trading, financial, accounting, legal, or tax advice. Example Broad ETF, Example Growth ETF, Example Bond Fund, Alpha Corp, Beta Corp, Gamma Corp, Delta Corp, Epsilon Corp, Zeta Corp, and Eta Corp are entirely fictional, and all fund holdings, allocations, portfolio values, returns, interest rates, inflation rates, duration measures, and comparisons are hypothetical. No real companies, funds, tickers, countries, or investment recommendations are provided. All activities use simulated money only; no real-money investment, trading, or brokerage activity is required or encouraged. Portfolio overlap calculations depend on the completeness, identification, and reporting dates of underlying holdings disclosures. The stated 15-percentage-point overlap includes only Alpha, Beta, and Gamma, the three identified shared holdings, and does not establish complete overlap because other holdings are not individually disclosed. The minimum-weight overlap calculation measures common fund composition, while combined company exposure depends on the amounts invested in each fund and the weight of the company within each fund. The $1,740 or 17.4% combined exposure to Alpha, Beta, and Gamma is specific to the stated fictional $6,000 and $4,000 allocations. Overlap does not necessarily mean a portfolio is unsuitable, and lower overlap does not guarantee better diversification or lower risk. Different securities may share sector, economic, valuation, liquidity, or market risk factors even when their names do not repeat. Equities can experience substantial losses, while cash and bonds do not guarantee capital preservation, positive real returns, or protection during equity market declines. Bonds and bond funds are exposed to interest-rate risk, credit risk, issuer default, inflation risk, and other market factors. The five-year modified-duration illustration uses a first-order approximation that a one-percentage-point parallel increase in yields produces approximately a five-percent price decline, before convexity, distributions, fees, credit changes, and other effects. Real bond funds may experience different outcomes, and the simplified duration result is not a guaranteed return. The separate defensive-asset stress example assumes a $10,000 portfolio initially invested 60% in equities, 30% in Example Bond Fund, and 10% in cash. It assumes equities fall 20%, the bond fund falls 5%, and cash remains nominally unchanged. Under these specific assumptions, the mixed portfolio declines to $8,650, or negative 13.5%, compared with $8,000, or negative 20%, for the all-equity alternative. These results do not predict future portfolio returns or demonstrate that any allocation will consistently outperform, reduce losses, or satisfy an individual investor's needs. Asset correlations can change, and both equities and bonds may decline simultaneously. The post-shock weights of approximately 55.49% equities, 32.95% bonds, and 11.56% cash reflect only the specified simulated price movements. The separate inflation illustration assumes $1,000 cash, 2% nominal interest, and 3% inflation, resulting in approximately $990.29 of starting-period purchasing power and a real return of approximately negative 0.97%; taxes, account costs, and other factors are excluded. Holding cash can involve inflation, institution, and currency risks depending on the arrangement. Equity, bond, and cash allocations should not be inferred from a universal rule, as financial circumstances, time horizons, liquidity requirements, and risk tolerance vary. Historical or simulated results do not guarantee future outcomes. Learners should use dated fund disclosures, document partial data and assumptions, verify calculations, and treat all portfolio allocations as educational examples rather than instructions to buy, sell, or hold any real financial instrument.
Lesson Checkpoint
Review what you learned and get feedback on your work.