



In this fourteen-minute beginner lesson, learners compare two fictional ETF factsheets using a consistent research framework covering investment objectives, benchmarks, holdings, concentration, costs, tracking performance, fund size, history, distributions, and risks. Through Example Broad ETF and Example Tilt ETF, learners calculate expense costs, bid-ask spread costs, NAV premiums and discounts, tracking differences, and concentration gaps. The lesson emphasizes that a lower expense ratio or higher historical return does not automatically make a fund more suitable, and that fund selection begins with understanding whether its objective matches the learner's educational allocation purpose.
Start With the Factsheet and Investment Objective
A fund factsheet is a concise document summarizing an investment product's objective, benchmark, holdings, costs, performance, and selected risks. It helps readers understand what the fund is designed to do, but it is not an investment recommendation or a guarantee of future performance. In this lesson, we compare two completely fictional products: Example Broad ETF and Example Tilt ETF. Both use hypothetical benchmarks and invented financial statistics. The objective is to develop a consistent reading method that begins with purpose rather than historical returns.

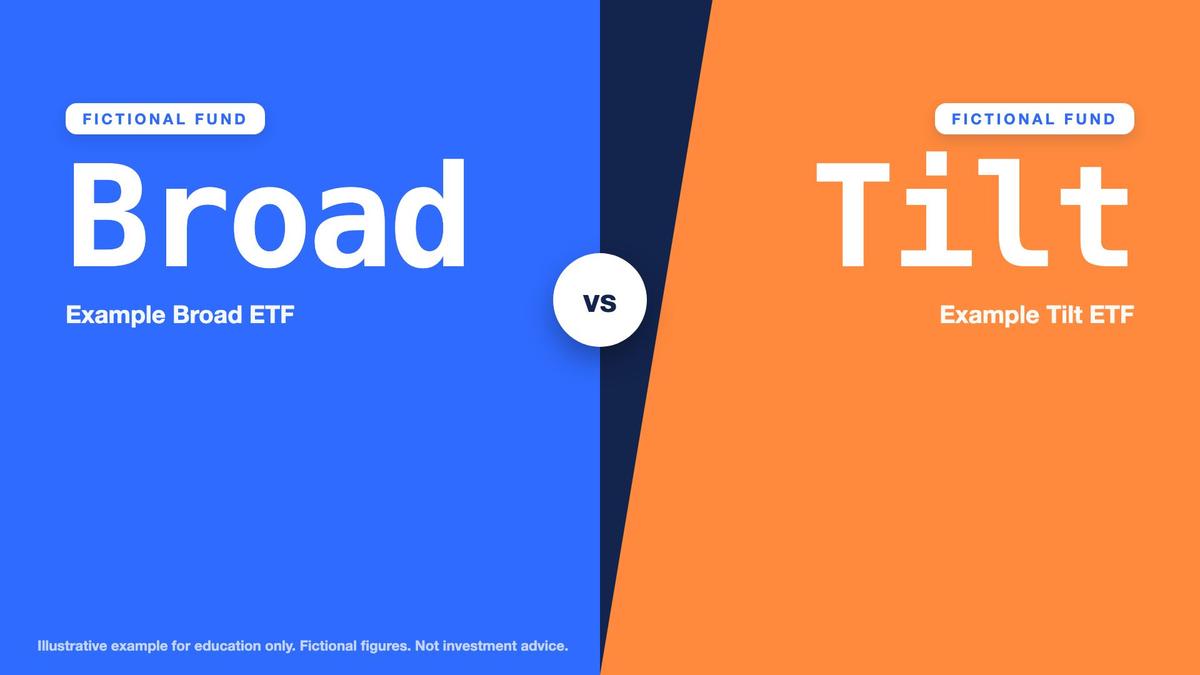
Example Broad ETF seeks broad exposure to the fictional Example 500 Index, which contains 500 companies and uses market-cap weighting. Example Tilt ETF seeks exposure to the fictional Example Quality 100 Index, which applies a rules-based quality screen and contains 100 companies. These objectives differ. Broad seeks to represent a wider market basket, while Tilt deliberately emphasizes a narrower set of companies meeting its benchmark methodology. Neither structure is automatically better, and the quality screen is not a guarantee of superior performance.

Key points
- A factsheet describes a fund; it does not recommend one.
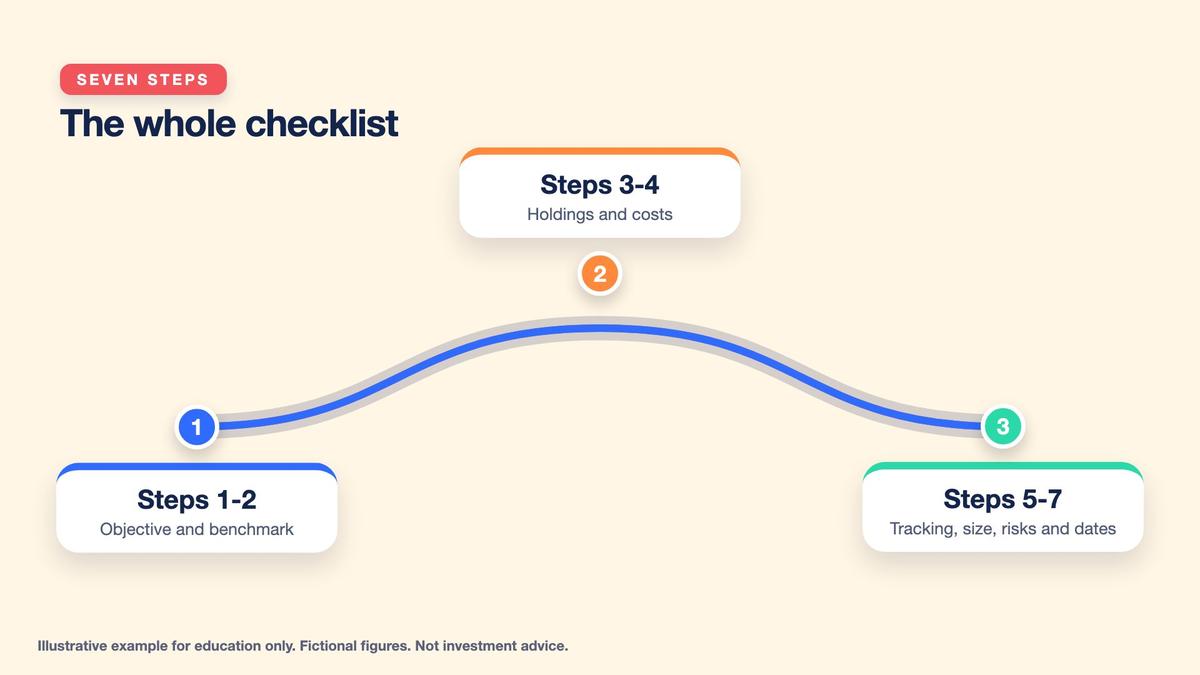
- Compare in a fixed order: objective, benchmark, holdings, costs, tracking, size, risks.
- Purpose comes before fees or returns.
The first comparison question is whether the fund's objective matches the learner's hypothetical allocation purpose. If the purpose is studying broad market exposure, a selective strategy may introduce exposures that were not intended. If the purpose is understanding a quality-screened benchmark, a broad market fund may not provide the same representation. This lesson does not choose a fund for any individual. Instead, it teaches learners to identify what each product claims to track and what economic exposures its methodology may create.

Compare Benchmarks and Index Construction Rules
A benchmark is a measurement standard used to evaluate a fund's investment objective and performance. Recall Lesson Twelve: an index is a methodology and calculated measurement, whereas an ETF is a separate fund product. The Example 500 Index uses market-cap weighting, meaning companies with larger market capitalizations generally carry greater index weights. Its broad membership provides exposure across 500 hypothetical companies, but does not automatically guarantee equal sector representation, equal company influence, or complete diversification.
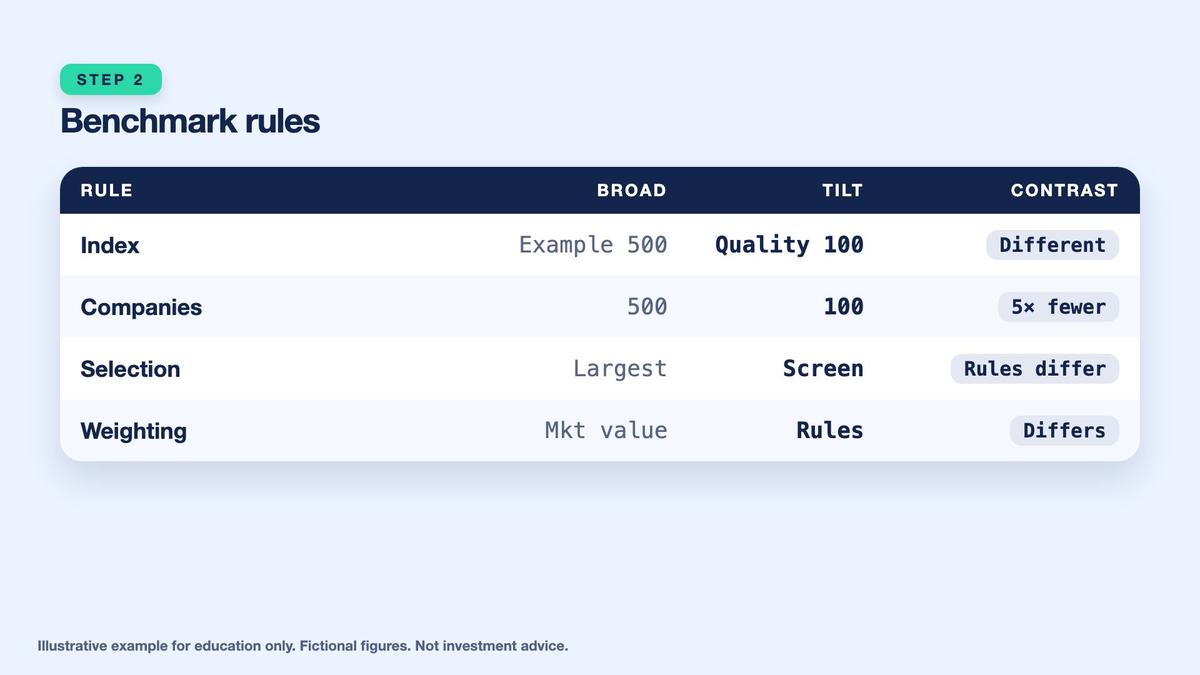
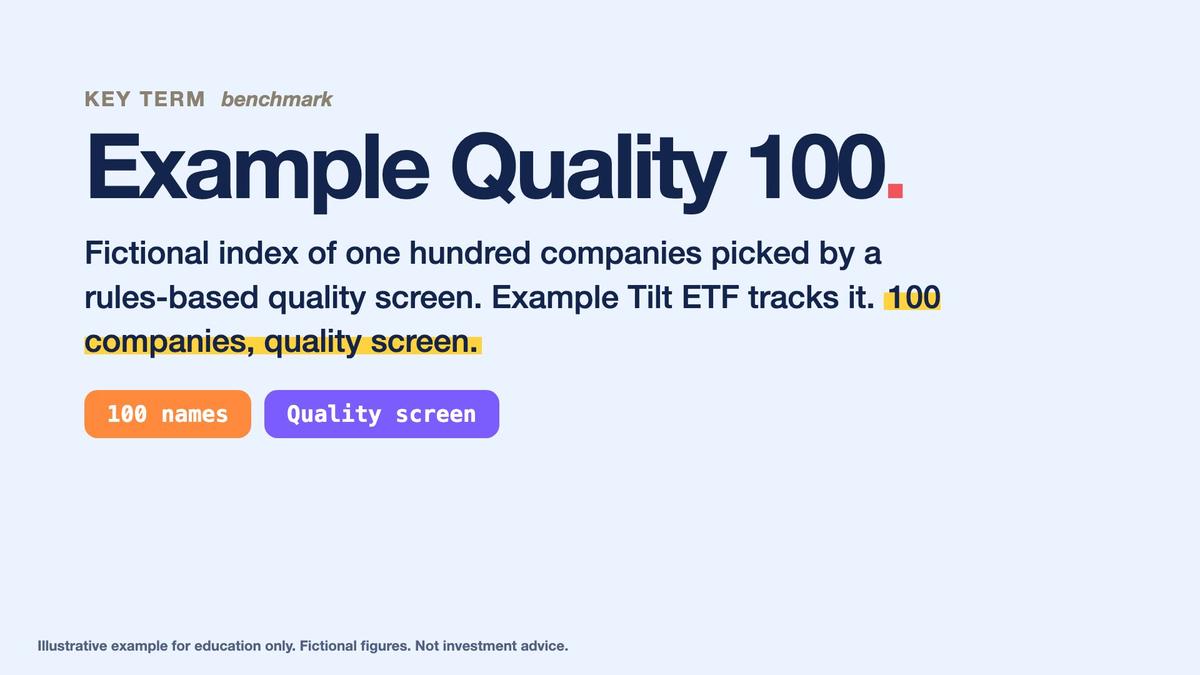
The Example Quality 100 Index follows a rules-based quality screen and contains 100 hypothetical companies. A quality screen might assess financial characteristics under predefined selection rules, but the exact criteria must be documented rather than assumed from the word quality. Such screening can lead to higher concentration in particular industries, company sizes, or financial characteristics. The Example Tilt ETF therefore tracks a different benchmark with different constituent selection rules, not simply a more expensive version of Example Broad ETF.
Key points
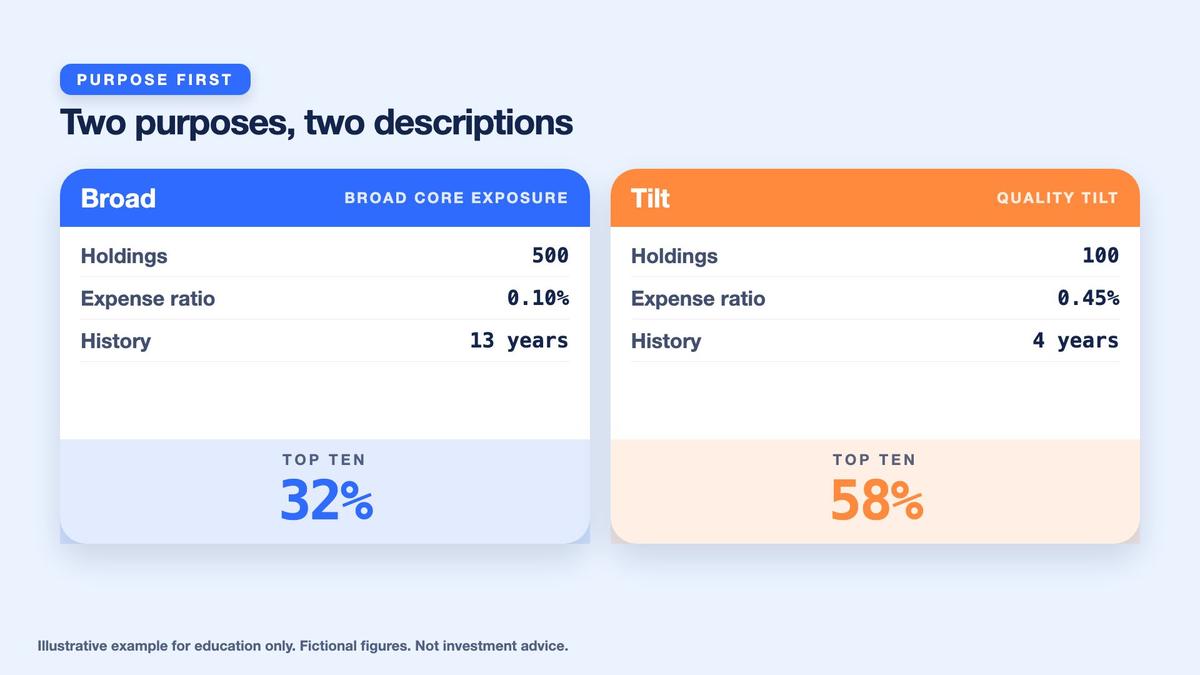
- Broad tracks the Example 500 Index: 500 companies, market-cap weighted.
- Tilt tracks the Example Quality 100 Index: 100 companies, quality screen.
- An ETF is a separate product from its index.
When comparing benchmarks, record the number of companies, selection screens, weighting approach, rebalancing rules, and stated return methodology. Different benchmarks can produce different historical performance even when fund managers follow their respective rules successfully. A higher benchmark return does not prove that one ETF tracks better than another. First determine what each benchmark measures, then evaluate whether the actual fund follows that benchmark efficiently and whether the resulting exposure serves the intended educational purpose.
Holdings, Top-Ten Concentration, and Largest Sector
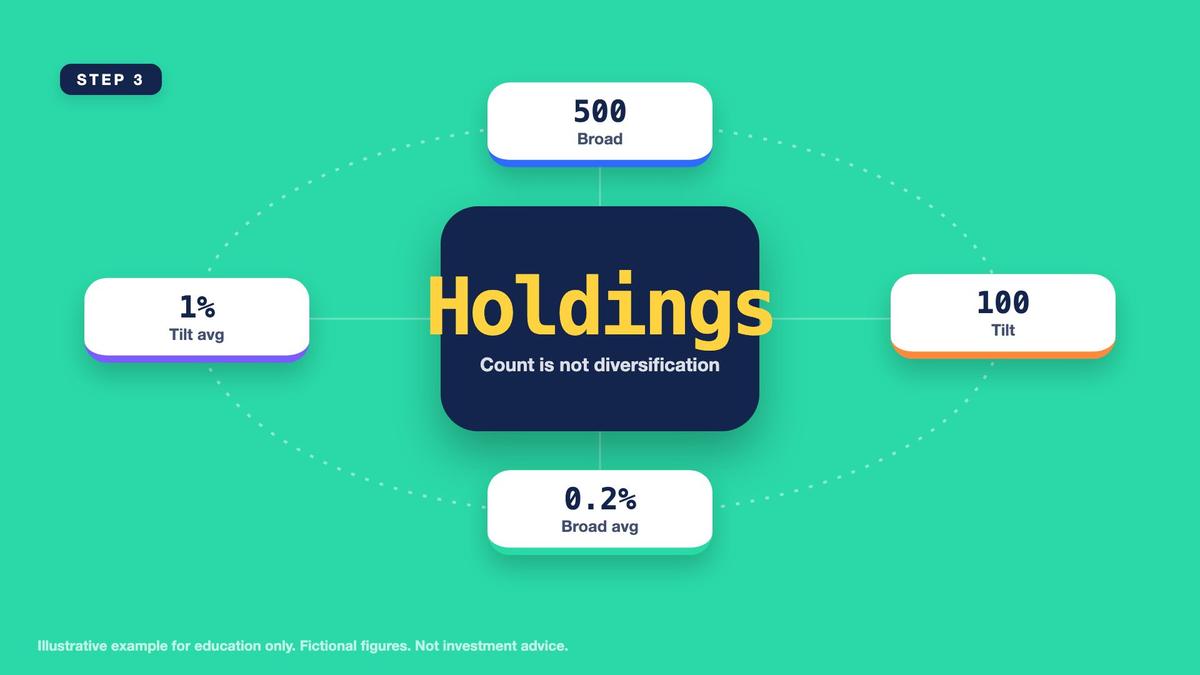
The holdings section identifies what the fund actually owns and how its assets are distributed. Example Broad ETF contains 500 hypothetical holdings, while Example Tilt ETF contains 100. Dividing 100% by the number of holdings gives an average mathematical weight of 0.2% for Broad and 1% for Tilt. These averages are not the actual weights of every holding. Real portfolios may assign unequal weights based on benchmark rules, replication techniques, and other portfolio-management considerations.
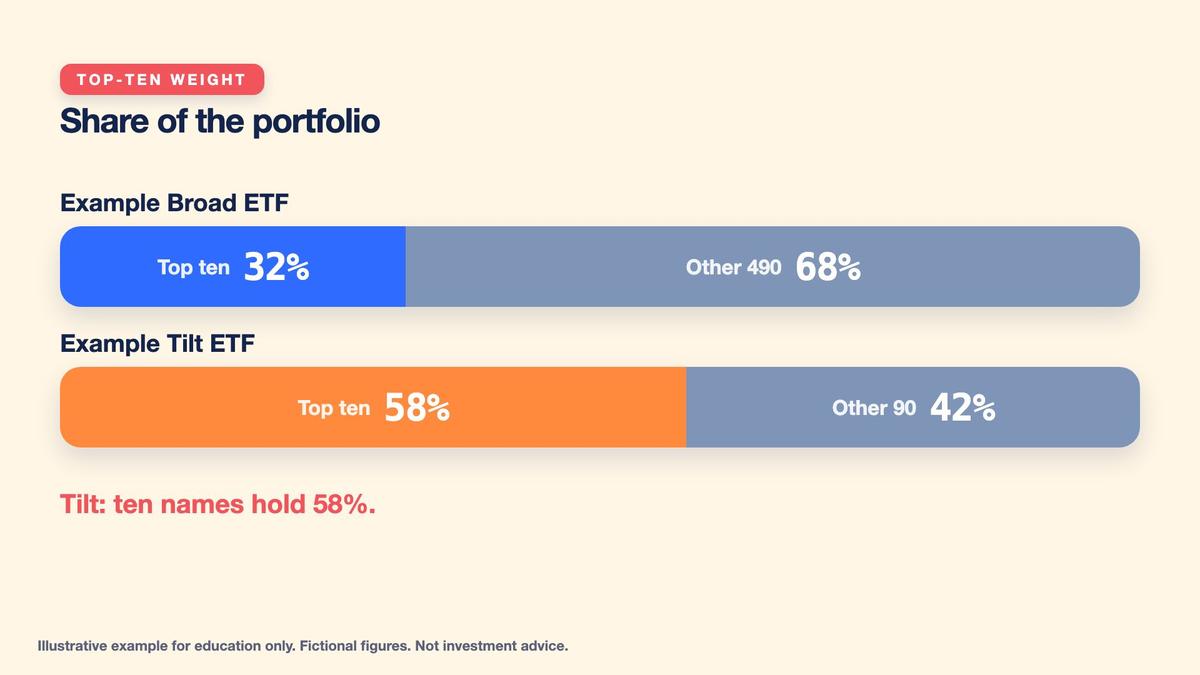
Top-ten holdings concentration is a useful summary of how much exposure is allocated to the largest positions. Example Broad ETF assigns 32% to its ten largest holdings, while Example Tilt ETF assigns 58%. The difference is exactly 26 percentage points. This means Tilt's largest holdings occupy a much greater share of the portfolio. However, top-ten weight does not explain everything about diversification. Investors must also consider whether those holdings belong to related industries, share common risk factors, or behave similarly during market stress.
Key points
- Holdings: 500 versus 100; average weight 0.2% versus 1%.
- Top-ten weight: 32% versus 58%, a 26-point gap.
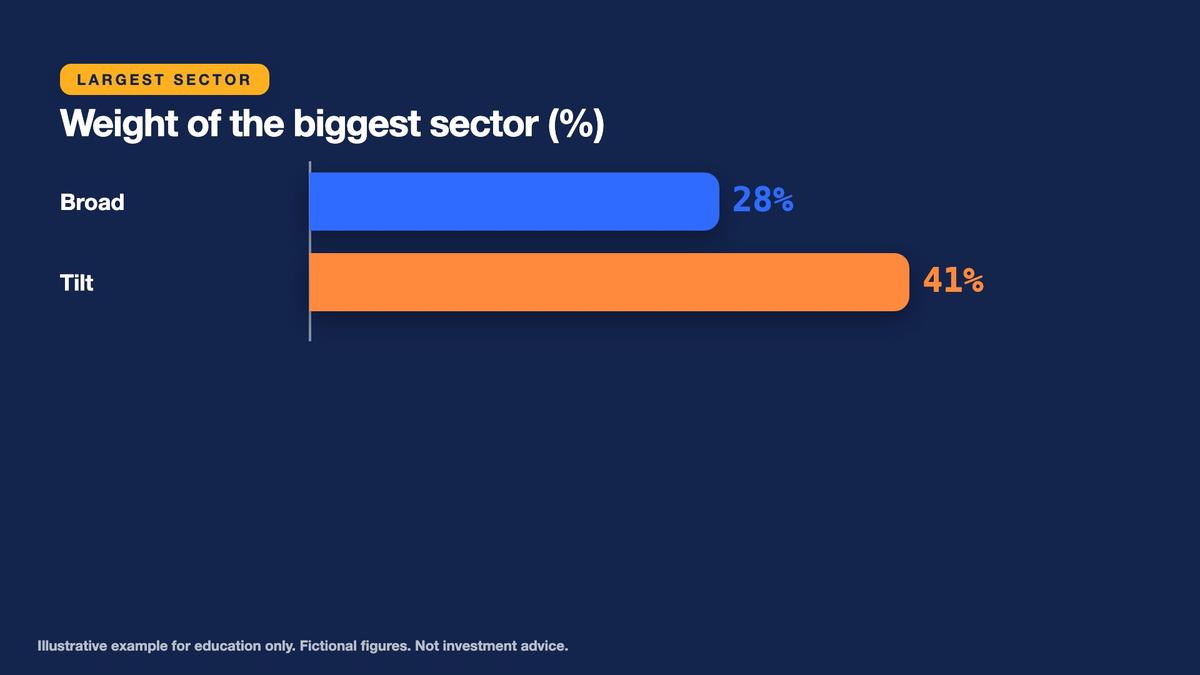
- Largest sector: 28% versus 41%, a 13-point gap.
Sector concentration adds another perspective. Broad's largest sector accounts for 28% of the portfolio, compared with 41% for Tilt. The gap is exactly 13 percentage points. A fund can own numerous companies but still be dominated by one industry or economic theme. The factsheet should also be checked for holdings dates because sector allocations and company weights can change over time. In this hypothetical comparison, Tilt has fewer holdings, a larger top-ten allocation, and a larger dominant sector.
Understand Expense Ratios, Spreads, and NAV Differences
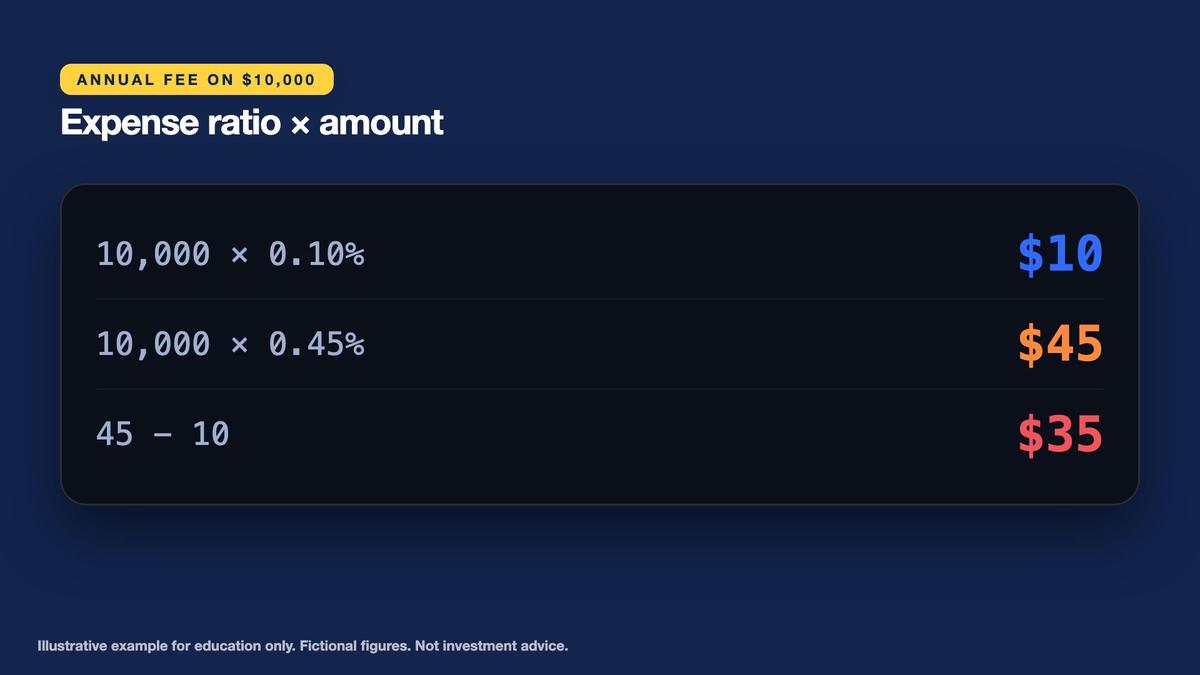
The annual expense ratio represents recurring fund operating expenses relative to fund assets. Example Broad ETF has a hypothetical annual expense ratio of 0.10%, while Example Tilt ETF charges 0.45%. On a constant $10,000 investment over one year, the simplified expense calculation is $10 for Broad and $45 for Tilt. The difference is $35. Such expenses are generally reflected through fund operations and asset value rather than appearing as a separate annual bill. They also do not represent the entire cost of trading or holding an ETF.
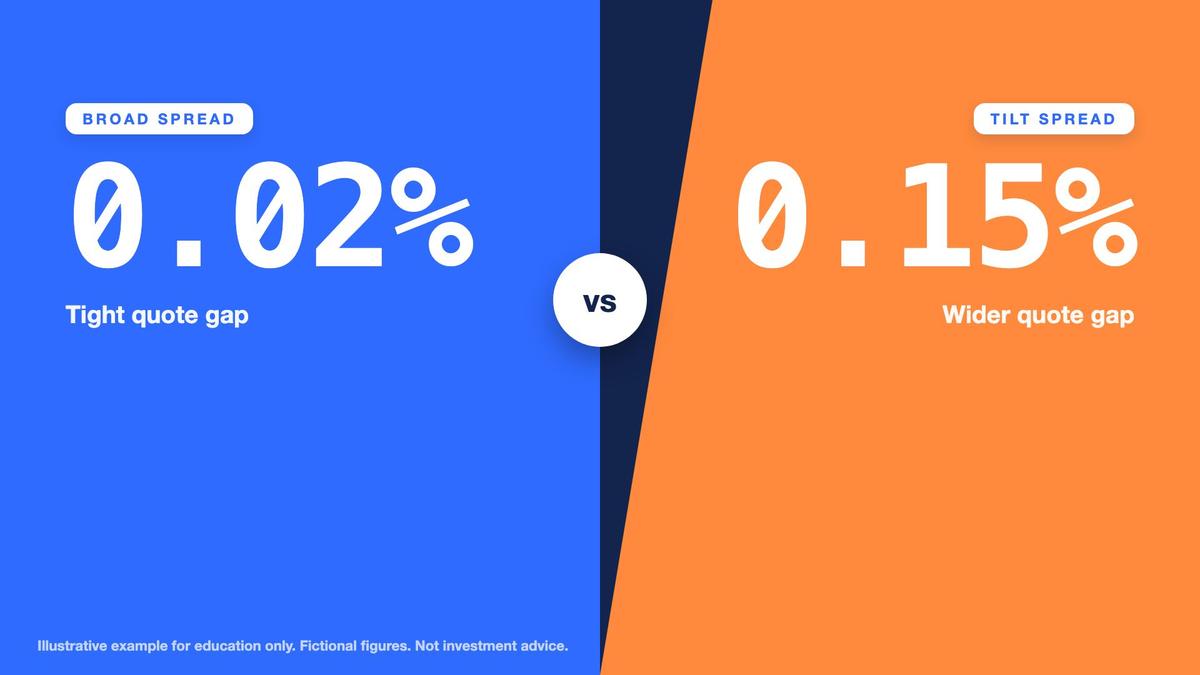
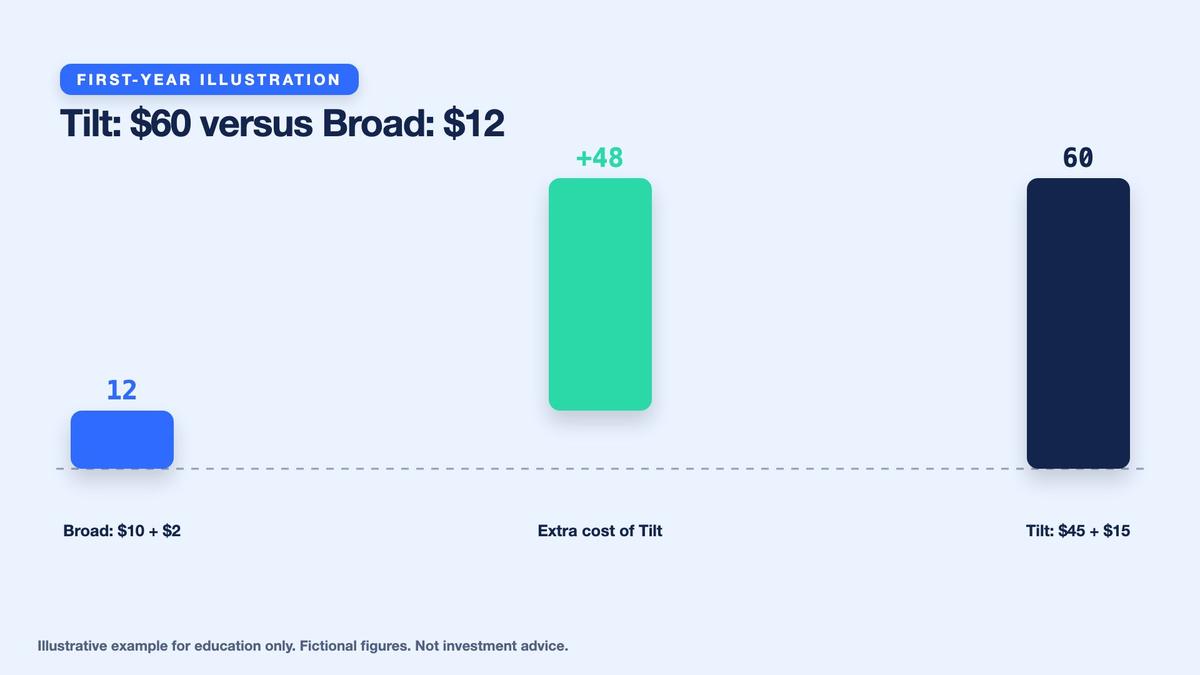
Bid-ask spreads are a separate transaction cost. Broad has a hypothetical spread of 0.02%, while Tilt has a spread of 0.15%. Assuming one complete buy-and-sell round trip crossing the full quoted spread on an unchanged $10,000 position, the simplified spread cost is $2 for Broad and $15 for Tilt. Adding one year of expense-ratio cost gives $12 for Broad and $60 for Tilt, a $48 difference. These estimates omit commissions, taxes, market movement, and additional execution frictions. The actual spread cost depends on how and when orders execute.
Key points
- Expense ratio: 0.10% versus 0.45%, or $10 versus $45 per $10,000.
- Spread: 0.02% versus 0.15%, or $2 versus $15 per round trip.
- First-year cost: $12 versus $60. Premium: +0.05% versus -0.30%.
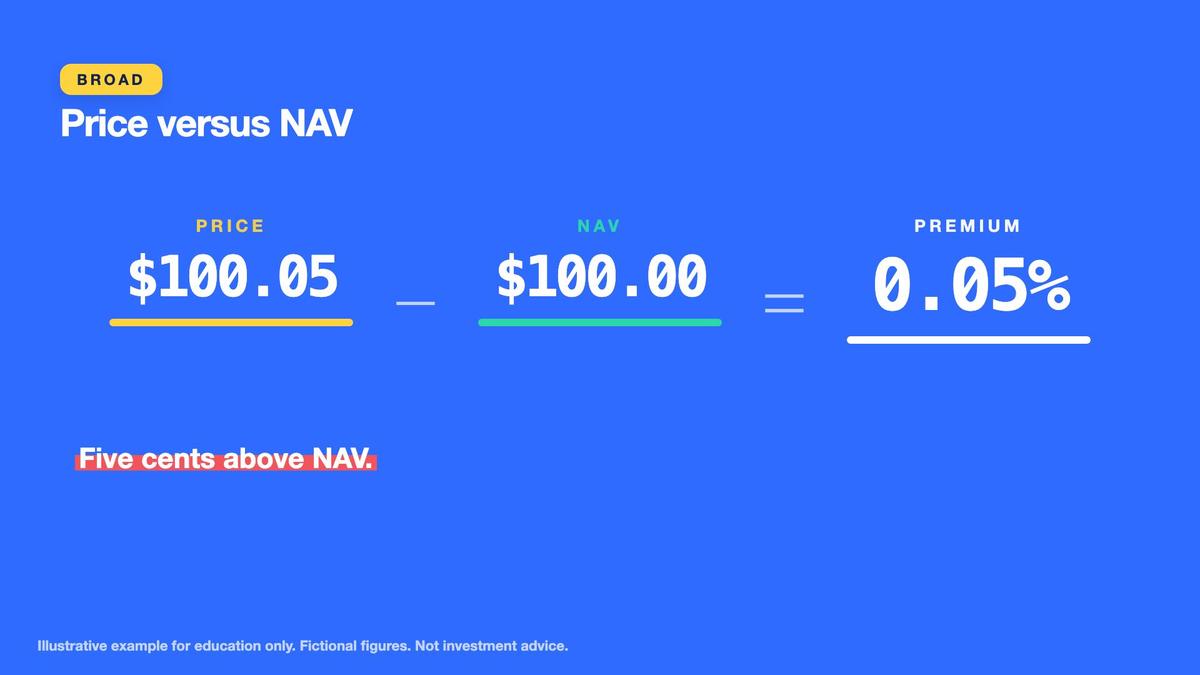
Compare exchange market price with net asset value per share. Broad reports NAV of $100.00 and market price of $100.05, producing a premium of exactly 0.05%. Tilt reports NAV of $40.00 and market price of $39.88, producing a discount of exactly 0.30%, or a signed premium of negative 0.30%. These are snapshots, not guaranteed ongoing conditions. A premium or discount can change with trading activity, underlying market liquidity, valuation methods, and the timing of available quotations.
Compare Tracking Difference and Understand Tracking Error
Tracking difference measures the signed difference between a fund's return and its benchmark return over the same measurement period and using comparable return definitions. It is calculated as fund return minus index return. Example Broad ETF's hypothetical one-year benchmark return is 9.00%, while its fund return is 8.88%. The tracking difference is therefore negative 0.12 percentage points. This negative result indicates that the fund underperformed its benchmark by 0.12 percentage points over the stated period, not necessarily that the fund's management failed.
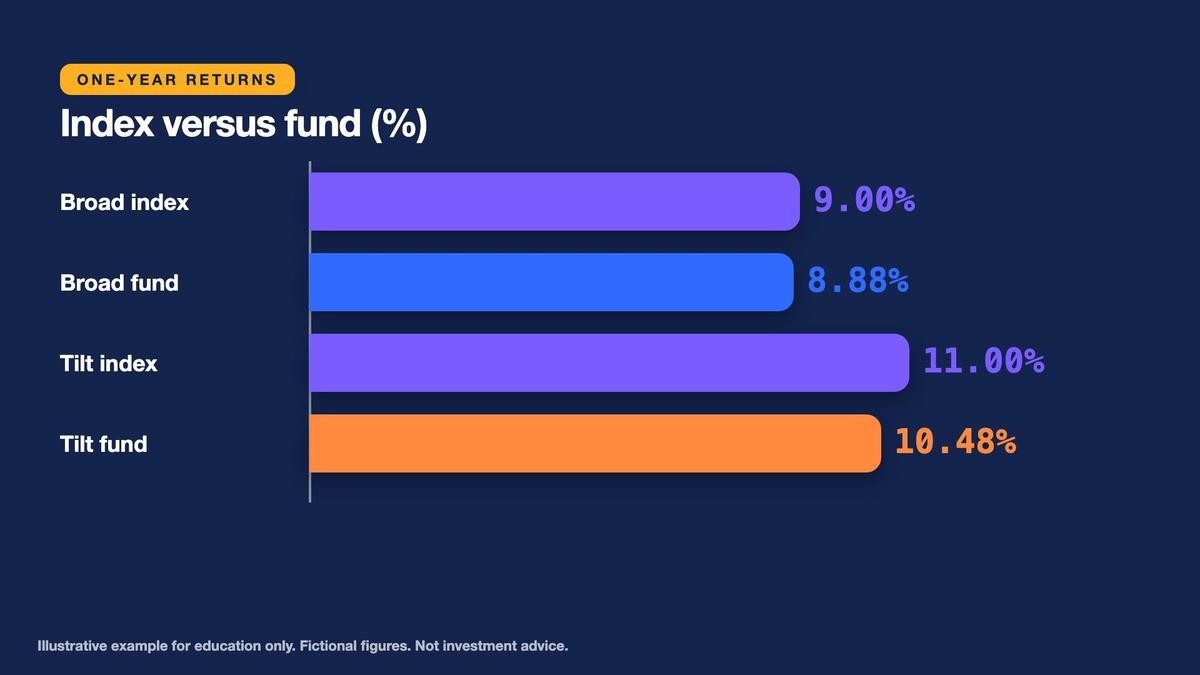
Example Tilt ETF's one-year benchmark return is 11.00%, while the ETF returns 10.48%. Its tracking difference equals negative 0.52 percentage points. Tilt's annual expense ratio is 0.45%, so the magnitude of the tracking shortfall exceeds the stated fee rate by 0.07 percentage points. This residual may reflect other frictions or implementation effects, but the factsheet figures alone do not establish a unique causal explanation. Actual tracking differences can arise from transaction costs, cash holdings, portfolio adjustments, distributions, and other operational factors.
Key points
- Tracking difference = fund return minus index return over the same period.
- Broad -0.12 points; Tilt -0.52 points.
- Tracking error describes how that gap varies over time.
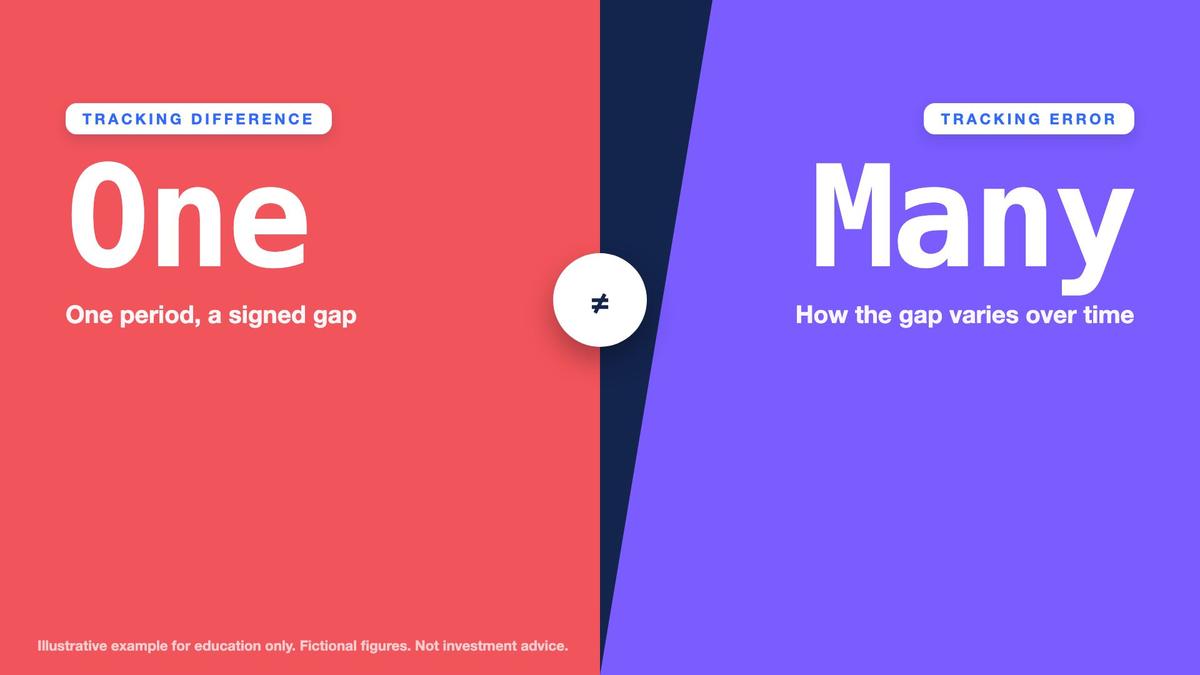
Tracking error differs from tracking difference. Tracking error commonly describes the variability of relative fund returns around benchmark returns across multiple observations, often using the standard deviation of those differences. A single one-year signed tracking difference is not sufficient to calculate statistical tracking error. Therefore, record both metrics separately whenever a factsheet provides them. Comparing funds also requires matching measurement dates, return periods, and price-return or total-return conventions. Otherwise, apparently different tracking results may reflect incompatible definitions.
Fund Size, Age, Distribution Yield, and Reporting Dates
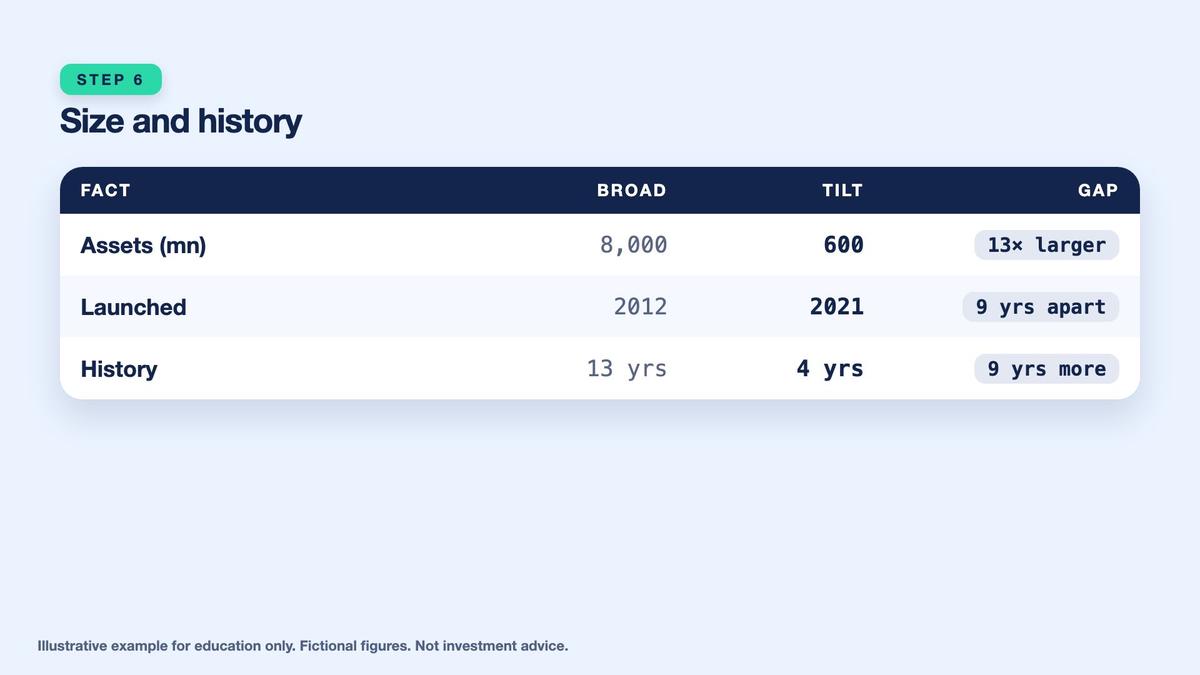
Fund assets and operating history provide context about the product but are not direct guarantees of quality. Example Broad ETF has hypothetical assets of $8,000 million and a 2012 launch year, while Example Tilt ETF has $600 million and a 2021 launch year. Using the hypothetical 2025 factsheet snapshot, the course describes these products as having 13 and 4 years of history by year count. Precise elapsed anniversary periods require actual launch dates. Size and history may influence the questions researchers ask about liquidity, operations, and track record.
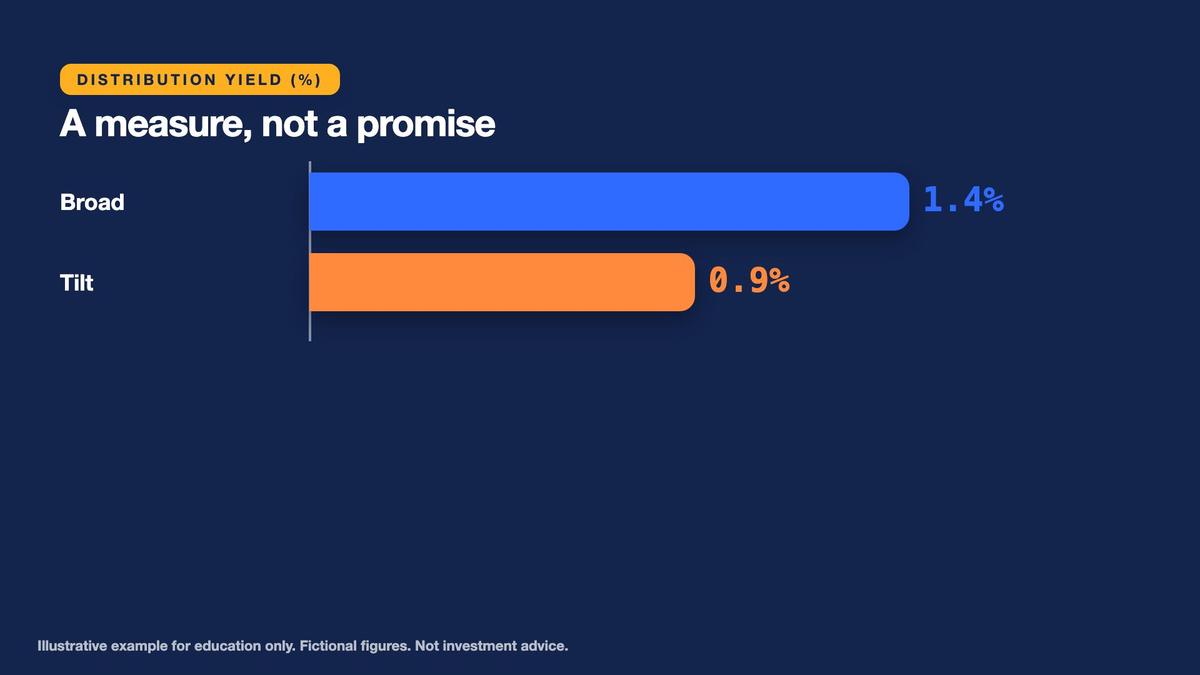
Example Broad ETF reports a hypothetical distribution yield of 1.4%, compared with 0.9% for Tilt. A distribution yield summarizes cash distributions relative to a specified price or value under a stated calculation convention. It is not a guaranteed future payment rate, and it is not the same as total return. Funds may differ in their distribution policies and the composition of payments. Compare reported yields only when their calculation periods and methodologies are consistent, and do not treat a higher yield as automatic evidence of higher investment quality.
Key points
- Assets: 8,000 million versus 600 million; history: 13 versus 4 years.
- Yield: 1.4% versus 0.9%, a measure and not a promise.
- Match reporting dates before comparing.
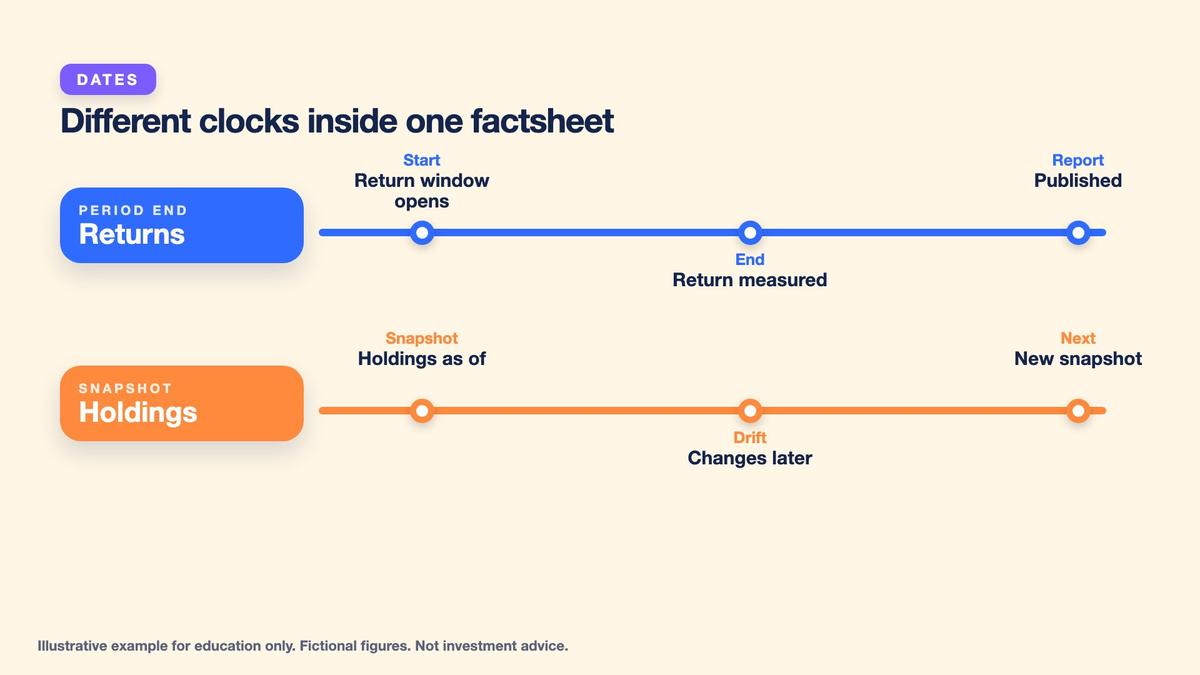
The date of each factsheet is essential. Holdings may be measured at month-end, performance may cover a different ending date, and fund assets or NAV can change frequently. For this exercise, treat the supplied data as a consistent hypothetical year-end 2025 comparison, with the specified one-year returns covering equivalent periods. In actual research practice, verify each field's reporting date. If two factsheets use different dates, label the difference instead of silently combining figures into an apparently synchronized comparison.
Evaluate Risks and Avoid Misleading Comparisons
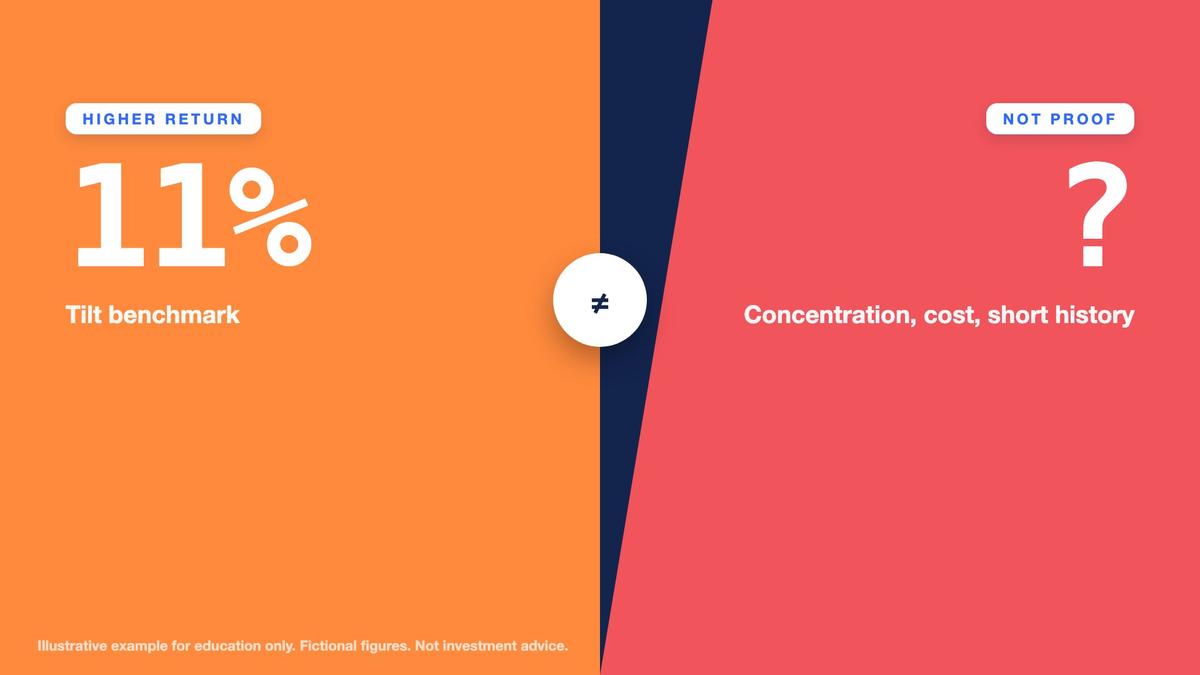
Factsheets disclose information rather than telling every learner what to select. Example Tilt ETF's underlying benchmark earns 11.00% in the hypothetical one-year period, exceeding Example Broad ETF's 9.00% benchmark result. However, this does not establish that Tilt is superior. Tilt's top-ten concentration is 58% compared with Broad's 32%, its largest sector allocation is 41% compared with 28%, and its expense ratio is higher. Its recorded history is also shorter. These characteristics create different exposure, cost, and uncertainty profiles.
A lower expense ratio does not automatically make a fund better either. A fund tracking the wrong benchmark for a particular educational purpose may be less relevant regardless of its fee. Different benchmarks can hold different companies and sectors, produce different returns, and experience different risks. Trading spreads, NAV deviations, replication methods, fund size, and tracking difference all add relevant information. A suitable comparison identifies the intended exposure first and then evaluates the fund's implementation characteristics.
Key points
- A higher index return (11% versus 9%) does not prove a better fund.
- Tilt adds concentration, cost and a shorter history.
- A lower fee does not decide suitability either.
Do not treat historical returns as forecasts. A higher return over one measured period may reflect favorable sector performance, market conditions, or a specific factor exposure that could reverse. Also avoid assuming that a larger fund guarantees tighter spreads or better future performance. The next lesson examines domicile and currency considerations, while Lesson Fifteen examines overlap between funds. Those dimensions can materially affect how multiple ETFs fit into a broader allocation, even when their individual factsheets appear attractive.
Final Practice: Build a Side-by-Side Factsheet Comparison
Your final task is to prepare a fixed-order, side-by-side factsheet comparison for fictional Example Broad ETF and Example Tilt ETF. Start by recording each fund's objective and benchmark rules. Then compare holding counts, top-ten concentration, and largest sector weights. Broad has 500 holdings, 32% top-ten concentration, and 28% in its largest sector. Tilt has 100 holdings, 58% top-ten concentration, and 41% in its largest sector. Explain why these differences matter without assuming that holding count alone proves diversification.
Practice Lab: Compare Two Hypothetical ETF Factsheets
Use only Example Broad ETF, Example Tilt ETF, Example 500 Index, and Example Quality 100 Index. Assume a hypothetical year-end 2025 factsheet snapshot and comparable one-year return periods. Compare the funds in the fixed order: objective, benchmark rules, holdings and concentration, costs and NAV pricing, tracking difference, fund size and history, distributions, risks, and dates. For simplified cost calculations, use a constant $10,000 position for one full year and one complete buy-and-sell round trip crossing the full quoted spread. Exclude commissions, taxes, price changes, and other unstated costs. Show formulas, retain correct units, and avoid treating the results as investment recommendations.
- Decision 1: Example Broad ETF tracks the market-cap-weighted Example 500 Index and holds 500 companies. Example Tilt ETF tracks the quality-screened Example Quality 100 Index and holds 100 companies. — Explain why comparing benchmark objectives and selection rules should come before comparing expense ratios or historical returns.
- Decision 2: Example Broad ETF has 500 holdings, top-ten weight of 32%, and largest sector weight of 28%. Example Tilt ETF has 100 holdings, top-ten weight of 58%, and largest sector weight of 41%. — Calculate average mathematical weight per holding, the top-ten concentration gap, and the largest-sector gap.
- Decision 3: Broad has a 0.10% annual expense ratio and a 0.02% bid-ask spread. Tilt has a 0.45% annual expense ratio and a 0.15% spread, with a constant hypothetical $10,000 position. — Calculate annual expenses, the approximate full-spread round-trip cost, and the combined first-year simplified cost for each fund.
- Decision 4: Broad's NAV is $100.00 and market price $100.05. Tilt's NAV is $40.00 and market price $39.88. Broad's benchmark and fund returns are 9.00% and 8.88%, while Tilt's are 11.00% and 10.48%. — Calculate both NAV premiums or discounts and both tracking differences.
- Decision 5: Broad has $8,000 million assets, a 2012 launch year, 13 years of hypothetical history, and 1.4% distribution yield. Tilt has $600 million assets, a 2021 launch year, four years of history, 0.9% yield, and higher benchmark returns. — Write a balanced comparison that considers fund purpose, concentration, expenses, track record, and risks without choosing an investment for a real person.
Answer key
Next, calculate the fund costs and tracking outcomes. Broad's 0.10% expense ratio equals $10 annually on a constant $10,000 holding, while Tilt's 0.45% equals $45. Under the specified full-spread round-trip assumption, trading friction adds $2 and $15 respectively. The combined simplified first-year figures are $12 and $60, a $48 difference. Record the 0.05% Broad NAV premium, the 0.30% Tilt discount, and one-year tracking differences of negative 0.12 and negative 0.52 percentage points.
Key points
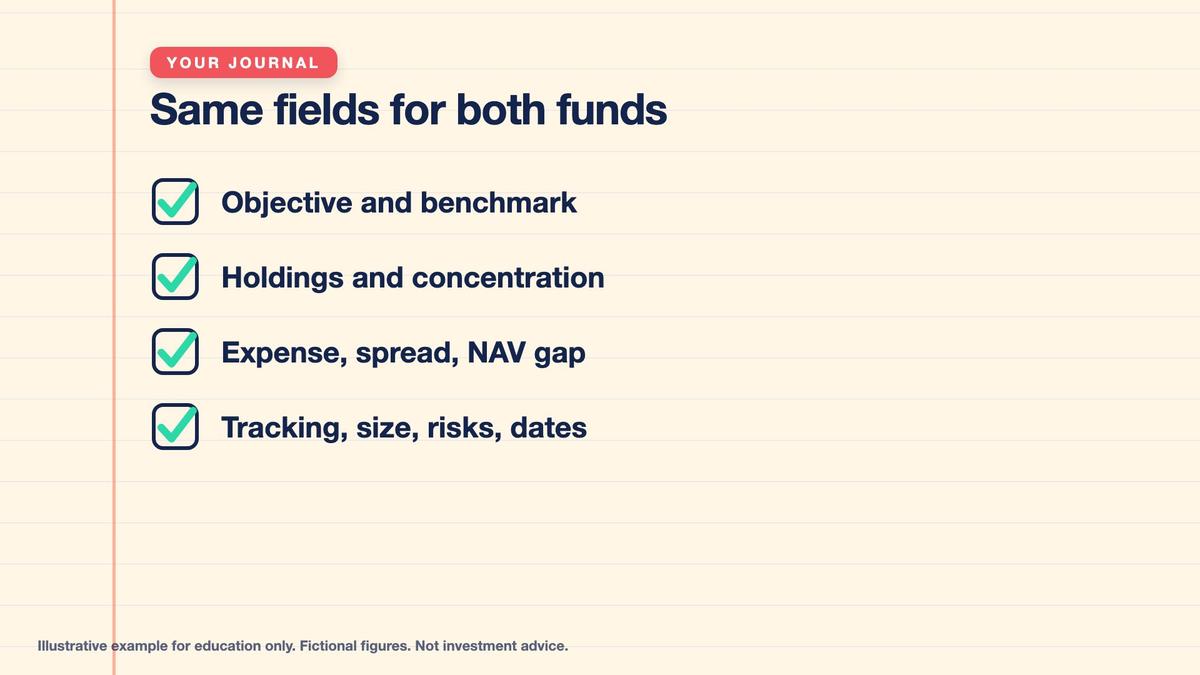
- Record every field for both funds, with dates.
- Explain trade-offs in words, not with a single number.
- Educational only, not advice.
Finish by recording fund assets, launch years, distribution yields, risks, and factsheet dates. State that Broad has $8,000 million in assets and Tilt has $600 million; the hypothetical history lengths are 13 and 4 years, with distribution yields of 1.4% and 0.9%. Explain why Tilt's higher historical benchmark return does not prove that the product is better. The outcome is an accurate, reproducible comparison of purpose, holdings, benchmark design, costs, and risks—not a recommendation to purchase a real fund.
Worked example at a glance
Key terms
- Factsheet: a short report on a fund: objective, benchmark, holdings, costs, performance and risks.
- Benchmark: the index a fund aims to track or compare itself with.
- Top-ten weight: the combined share of a fund held in its ten largest holdings.
- Concentration: how much of a portfolio sits in a few holdings or one sector.
- Expense ratio: the yearly operating cost of a fund, as a percentage of assets.
- Bid-ask spread: the gap between the price to buy and the price to sell.
- NAV: net asset value per share of a fund.
- Premium or discount: the percentage by which market price is above or below NAV.
- Tracking difference: fund return minus index return over the same period.
- Tracking error: how much the gap between fund and index returns varies over time.
- Distribution yield: a measure of recent payouts relative to price; not a promise.
Multi Asset Trading Lab is an educational course and does not provide personalized investment, trading, financial, accounting, legal, or tax advice. Example Broad ETF, Example Tilt ETF, Example 500 Index, and Example Quality 100 Index are entirely fictional, and all holdings, index methodologies, returns, fund assets, launch histories, expenses, trading spreads, NAV figures, distribution yields, tracking differences, and comparative observations are hypothetical. No real funds, tickers, securities, or investment recommendations are presented. All research and calculations use simulated money only, and no real-money investment or trading activity is required or encouraged. Fund factsheets describe selected fund characteristics at specified dates; they do not provide a guarantee of future performance, capital preservation, liquidity, diversification, or suitability. A fund's objective and underlying benchmark should be understood before comparing fees or historical returns. Different index methodologies can produce different holdings, sector allocations, concentrations, risks, and performance. A greater number of holdings does not guarantee complete diversification, and a fund with fewer holdings is not necessarily inferior for every hypothetical educational purpose. The top-ten holdings percentage and largest sector weight are incomplete measures of portfolio concentration and may change between reporting dates. Expense ratios describe recurring fund operating expenses but do not include every investor transaction cost. Bid-ask spreads, brokerage charges, market impact, premiums or discounts to NAV, taxes, and other implementation effects may affect actual outcomes. The simplified $10,000 cost comparison assumes an unchanged investment value for one full year and a single complete round trip crossing one quoted full spread, with no commissions, taxes, price changes, additional spreads, or other expenses. The resulting $12 and $60 examples are not forecasts of actual ownership costs. A quoted spread is a market observation and may change with liquidity or volatility. ETF market prices can differ from NAV, and a temporary premium or discount does not guarantee a future trading advantage. Tracking difference is defined here as fund return minus comparable benchmark return over the same period; tracking error refers to variability of relative returns across observations and cannot be determined from a single one-year tracking difference. The hypothetical excess of Tilt's 0.52-percentage-point tracking shortfall over its 0.45% expense ratio is 0.07 percentage points, but the figures alone do not identify the specific cause of that difference. Past performance does not predict future results, and a higher past benchmark return does not prove that the associated fund is better, safer, or more suitable. Distribution yields are not guaranteed future income or equivalent to total investment return. Fund size and launch history provide context but do not guarantee liquidity, operational continuity, tracking accuracy, or future financial outcomes. All supplied data are treated as a consistent hypothetical year-end 2025 comparison; actual factsheets may use different holdings dates, valuation timestamps, performance periods, and return methodologies. Learners should verify dates and definitions, compare equivalent periods, document assumptions, and distinguish a fund's benchmark from the fund product itself. The following lessons separately address fund domicile, currency, and portfolio overlap. Nothing in this lesson constitutes a recommendation to buy, sell, or hold any financial instrument, and learners should consult appropriate official disclosures and qualified professionals before making actual financial decisions.
Lesson Checkpoint
Review what you learned and get feedback on your work.