



In this ten-minute beginner lesson, learners distinguish individual company shares, share classes, financial indices, and exchange-traded funds. Using only fictional Example Corp, Example 5 Index, and Example 5 ETF, learners calculate voting control, market-cap-weighted and equal-weighted index returns, ETF net asset value, trading premiums, bid-ask spreads, expenses, and tracking differences. By the end, learners can explain what each financial layer represents, how the layers connect, and why an ETF does not guarantee diversification, index-matching returns, or protection against losses.
Identify the Four Layers: Share, Share Class, Index, and ETF
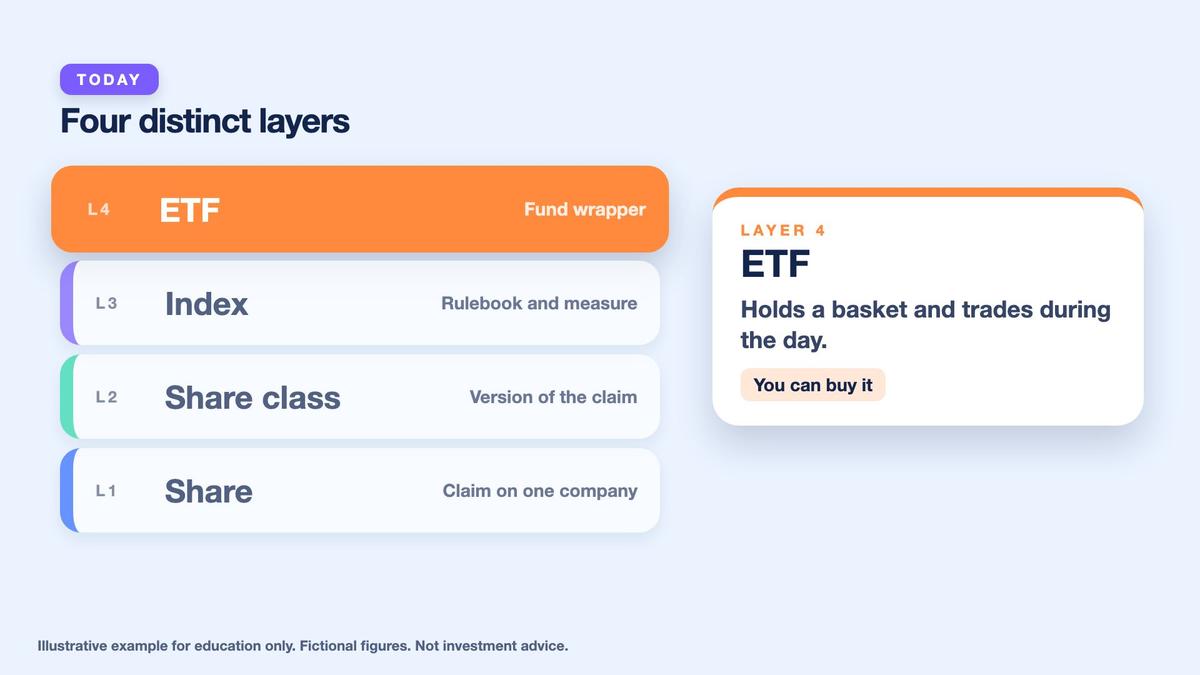
The stock market contains several financial concepts that are often discussed together but represent different things. An individual share is an ownership claim in a company. A share class defines the particular rights attached to a version of that ownership claim. An index is a measurement constructed according to a methodology describing which securities are included, how they are weighted, and how performance is calculated. An exchange-traded fund, or ETF, is a separate investment product holding a portfolio of assets and trading on an exchange. Distinguishing these layers is the foundation of this lesson.

Consider fictional Example Corp. A share in Example Corp represents an ownership interest in that company, subject to the applicable security rights. A hypothetical Example 5 Index measures a group of five fictional companies using specified rules. A hypothetical Example 5 ETF is a fund intended to track that index. Buying a share of the ETF would mean owning a share in the fund, rather than directly buying the mathematical index or automatically acquiring direct shareholder voting rights in each underlying company.
Key points
- Four layers: share, share class, index, ETF.
- A share is ownership; a class sets its rights.
- An index measures; an ETF packages assets for trading.
The differences matter because company shares, share classes, indices, and ETFs have different legal rights, economic exposures, costs, and risks. An index can be used as a benchmark without being available for direct purchase. A fund may attempt to follow a benchmark while charging operating expenses and experiencing trading differences. Share classes may provide unequal voting rights. By the end of the lesson, learners should be able to identify each layer accurately before evaluating prices or investment performance.
Individual Shares and Share-Class Voting Rights
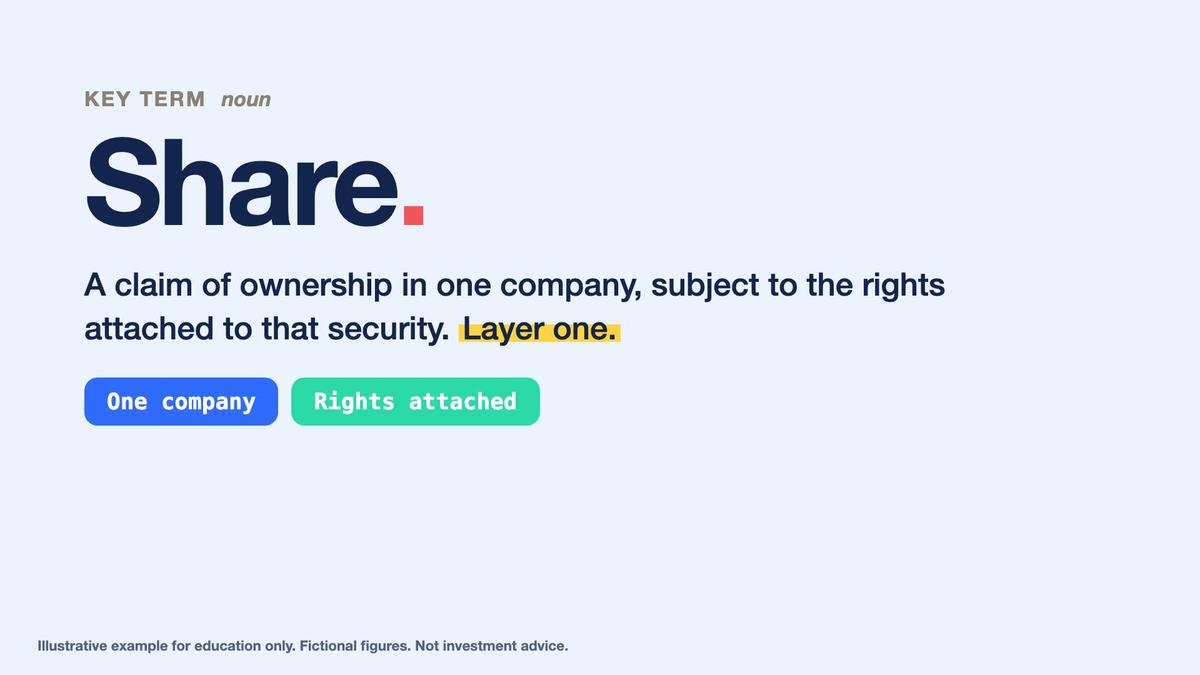
A company's share structure determines which ownership interests exist and what rights they carry. Different share classes can have different voting powers, dividend arrangements, economic rights, or other features. These rights must be checked in the relevant corporate disclosures rather than assumed from the share-class name. In our fictional example, Example Corp has two classes of ordinary equity: 20 million Class A shares carrying one vote each, and 10 million Class B shares carrying ten votes each. The combined total is 30 million shares, consistent with the simplified share count used in earlier lessons.
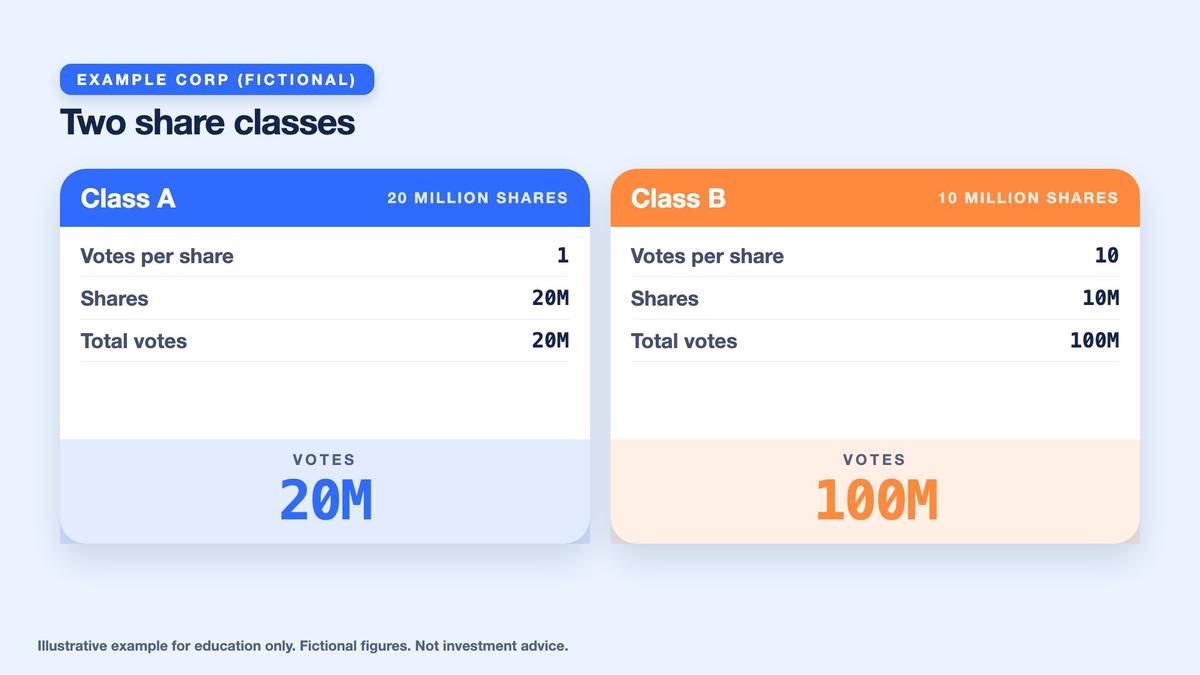
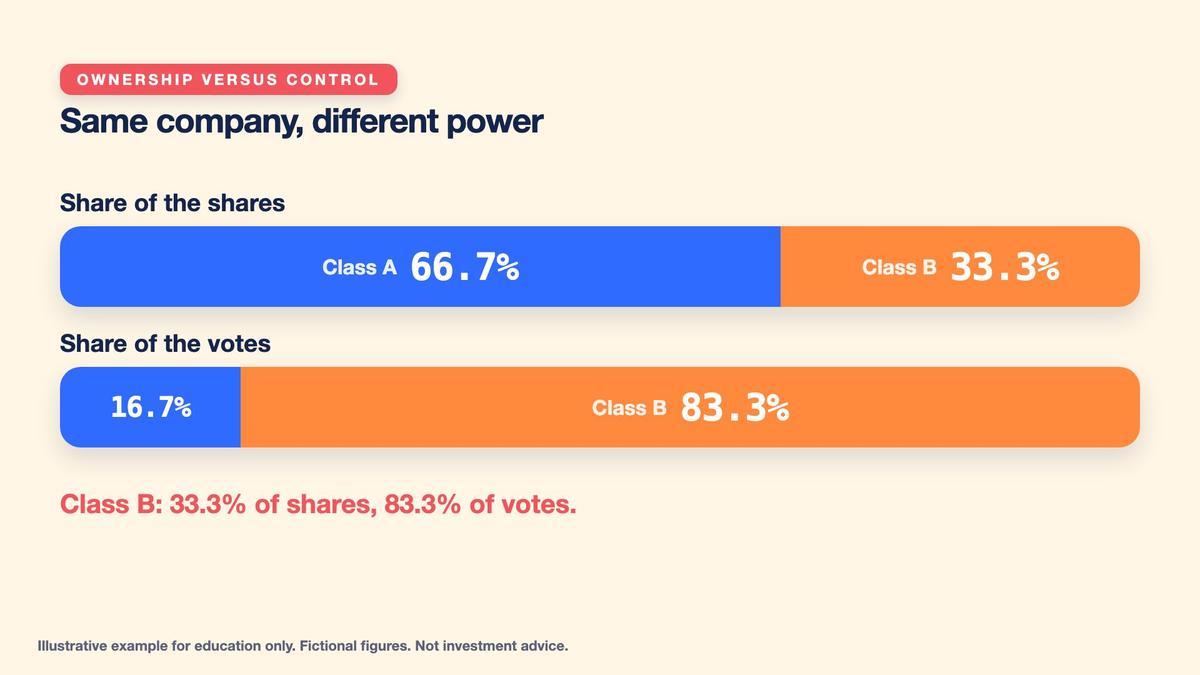
Class A shareholders collectively control 20 million votes, while Class B shareholders collectively control 100 million votes. Total voting power is therefore 120 million votes. Class B represents 10 million divided by 30 million shares, exactly one-third, or approximately 33.3% of ownership units. However, Class B controls 100 million divided by 120 million votes, exactly five-sixths, or approximately 83.3% of votes. Class A represents approximately 66.7% of shares but only approximately 16.7% of votes.
Key points
- Example Corp: 20M Class A (1 vote) and 10M Class B (10 votes).
- Total 120M votes: Class B holds 33.3% of shares but 83.3% of votes.
- Read class rights before buying.
This difference demonstrates why percentage ownership and percentage voting control are not interchangeable. A smaller class can hold more voting power when each share carries additional votes. Voting control can affect decisions such as electing directors or approving specified corporate actions, subject to relevant corporate rules. It does not automatically determine the current price, dividend entitlement, or economic value of a share class. A careful researcher should examine the company's filing and governing documents to understand those separate rights.
What an Index Measures and How Weighting Works
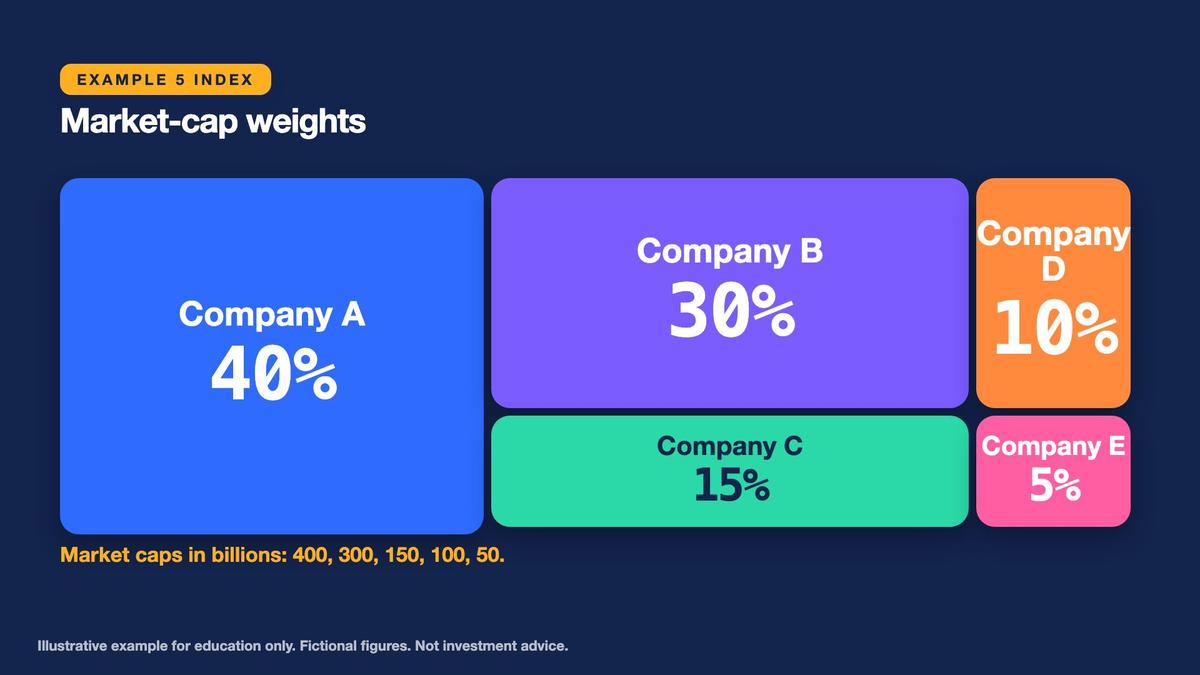
A financial index is a rulebook and a measurement, not a directly purchasable security. Its methodology specifies which companies qualify, when membership changes, how weights are determined, and how index values and returns are calculated. Our fictional Example 5 Index contains five companies labeled A through E. Their hypothetical market capitalizations are $400 billion, $300 billion, $150 billion, $100 billion, and $50 billion, respectively. The total market capitalization is $1,000 billion, or $1 trillion.

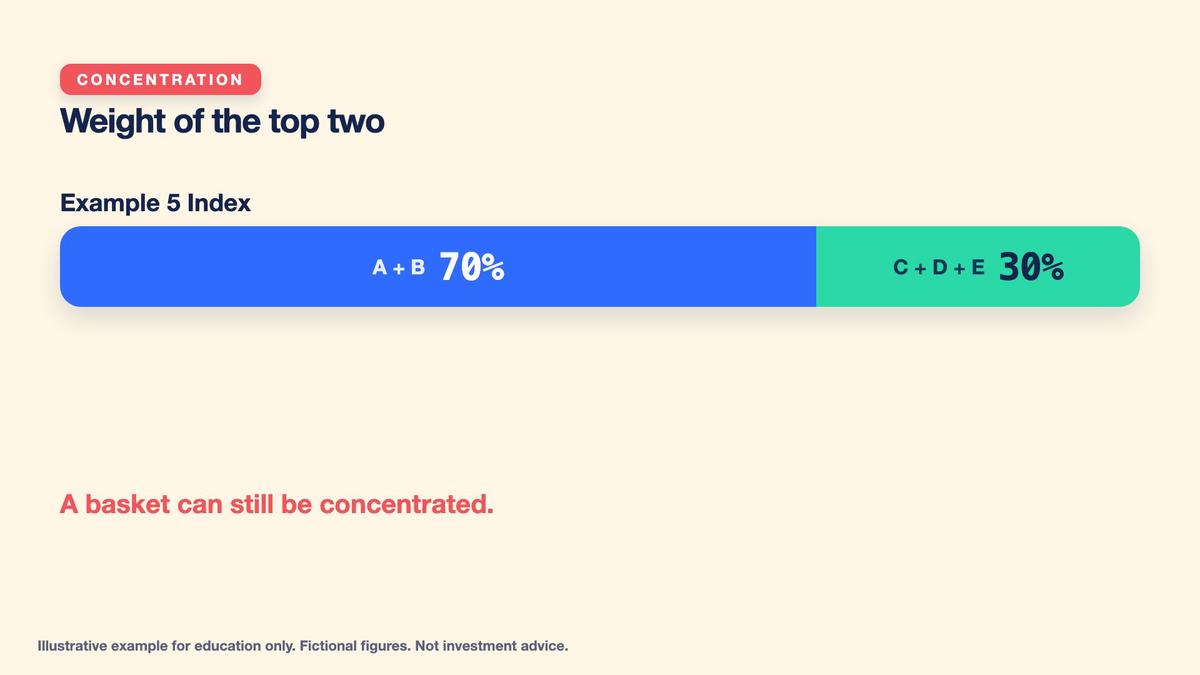
Under the simplified market-cap-weighted methodology, a company's weight equals its market capitalization divided by the total capitalization of the index constituents. The resulting weights are 40% for Company A, 30% for B, 15% for C, 10% for D, and 5% for E. Company A and Company B together represent 70% of the index. Consequently, their performance contributes much more to the combined result than the performance of a smaller constituent. An index containing several companies does not necessarily distribute risk equally.
Key points
- An index is a rulebook: list, weights and a calculation.
- Example 5 Index weights: 40%, 30%, 15%, 10%, 5%.
- You cannot buy an index directly.
An equal-weighted version instead assigns one-fifth of the portfolio to each company at the calculation's starting point. For five companies, this equals 20% each. The selection of market-cap weighting versus equal weighting changes the resulting portfolio exposure and index performance. Index methods may also differ in rebalancing schedules, treatment of corporate actions, dividend calculations, and eligibility requirements. Therefore, the name or number of constituents alone cannot fully describe how an index behaves.
Calculate Index Returns and Understand Concentration
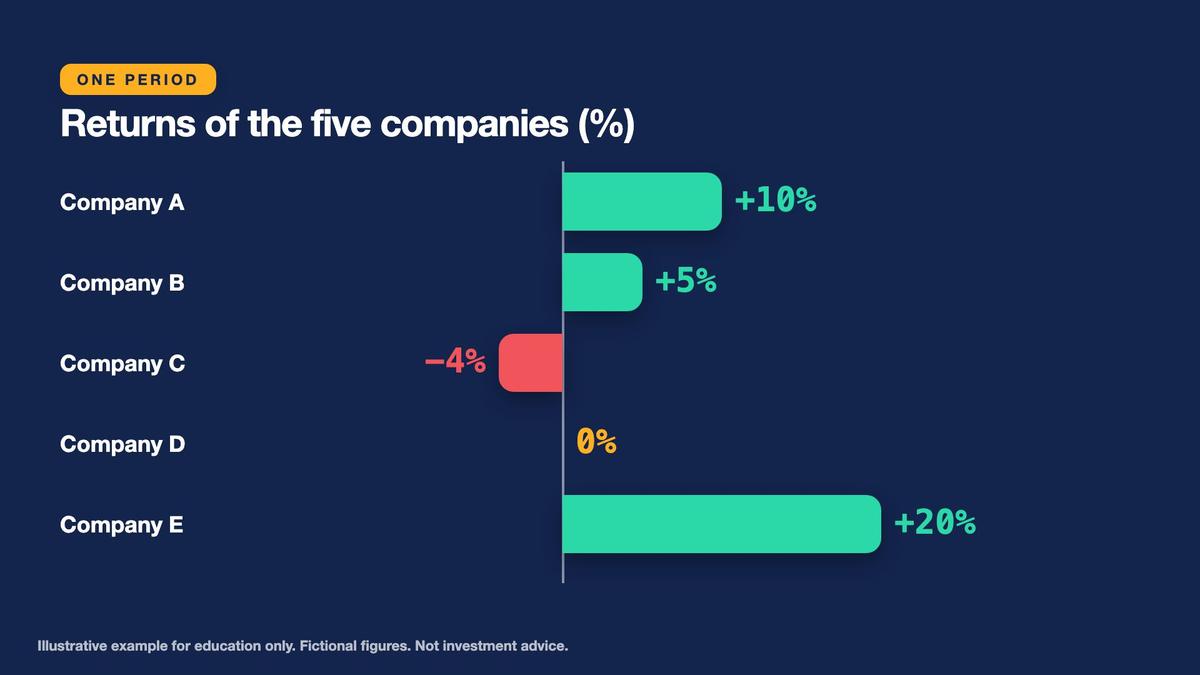
Suppose the five fictional companies generate the following one-period stock-price returns: A gains 10%, B gains 5%, C loses 4%, D has no price change, and E gains 20%. Under the simplified market-cap-weighted method, multiply every company's return by its starting index weight. The contributions are 0.40 × 10% = 4.0 percentage points, 0.30 × 5% = 1.5 points, 0.15 × negative 4% = negative 0.6 points, 0.10 × 0% = zero, and 0.05 × 20% = 1.0 point.
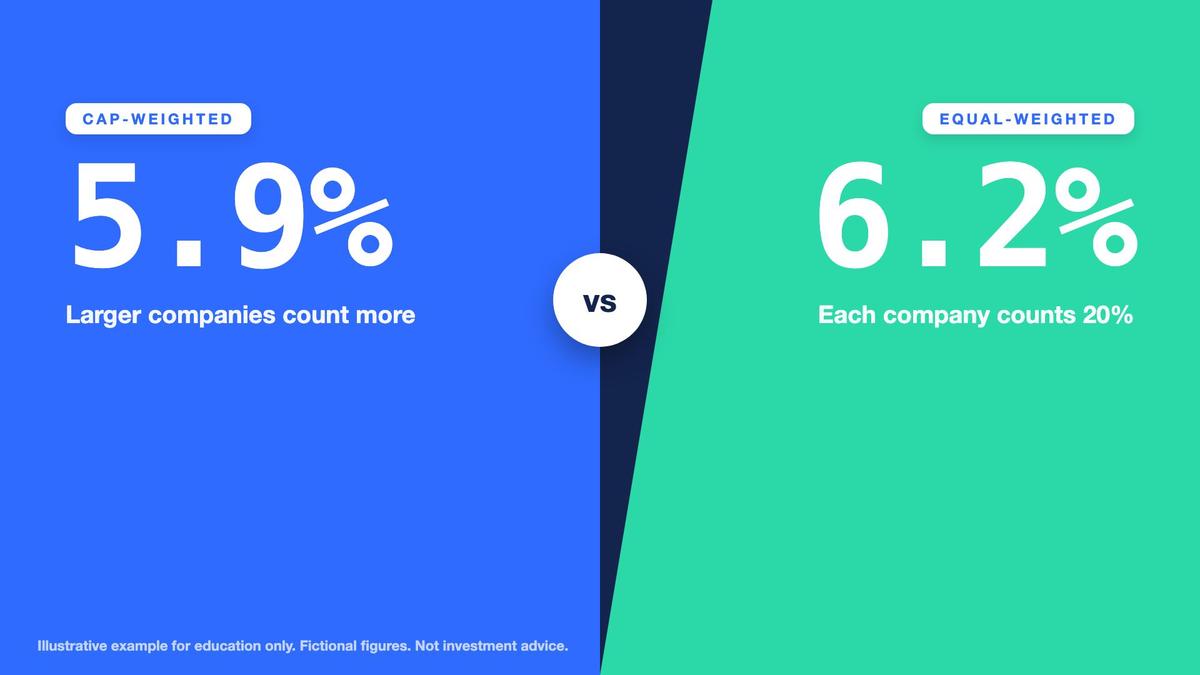
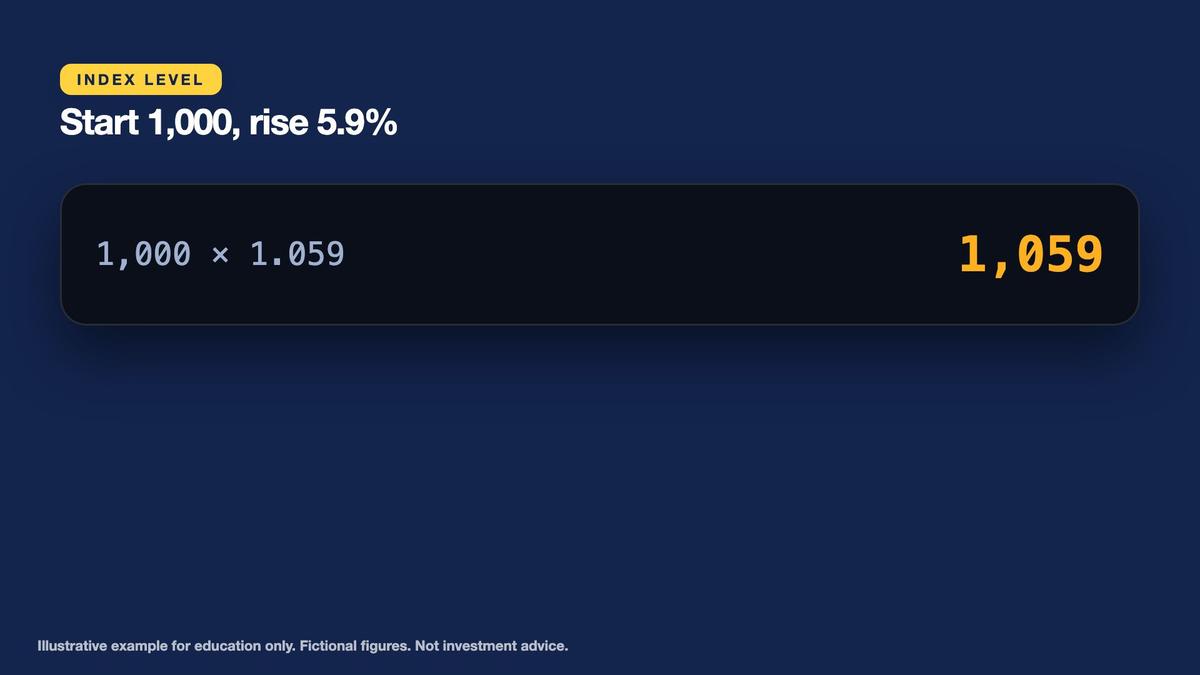
Adding those contributions produces 4.0 + 1.5 - 0.6 + 0 + 1.0 = exactly 5.9% for the period. An equal-weighted calculation averages the five returns: (10 + 5 - 4 + 0 + 20) divided by five equals 31 divided by five, or 6.2%. The difference of 0.3 percentage points arises from the weighting methods in this example. If the market-cap-weighted Example 5 Index begins at level 1,000, a 5.9% increase raises it to exactly 1,059.
Key points
- Cap-weighted return: 0.40×10 + 0.30×5 + 0.15×(−4) + 0.05×20 = 5.9%.
- Equal-weighted return: 31 ÷ 5 = 6.2%. Index level: 1,000 to 1,059.
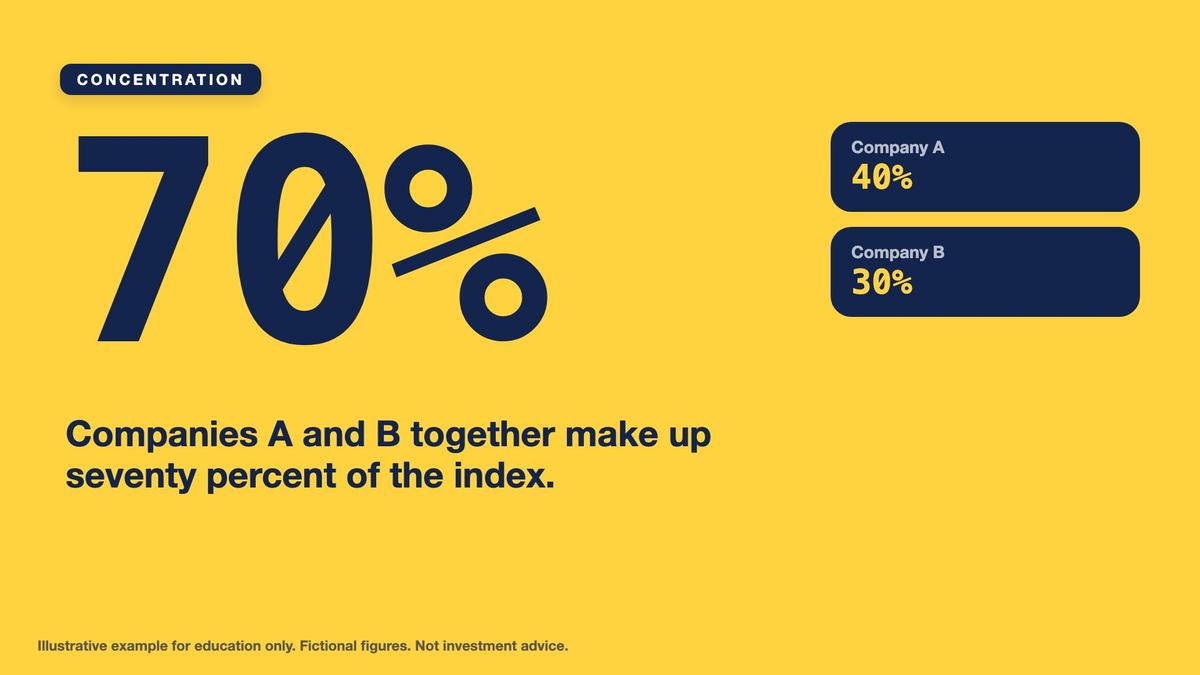
- Companies A and B make up 70% of the index.
An index level is a calculated measurement rather than an account balance. The return interpretation also depends on whether the methodology reports price returns or total returns. A price-return series generally focuses on price changes, while a total-return series accounts for distributions and prescribed reinvestment assumptions. Index calculations can also include changes in divisor, membership, and corporate actions. Our simplified example assumes unchanged starting constituents and weights during the measurement period and excludes dividends from the stated stock returns.
ETF Structure, Net Asset Value, and Trading Premiums
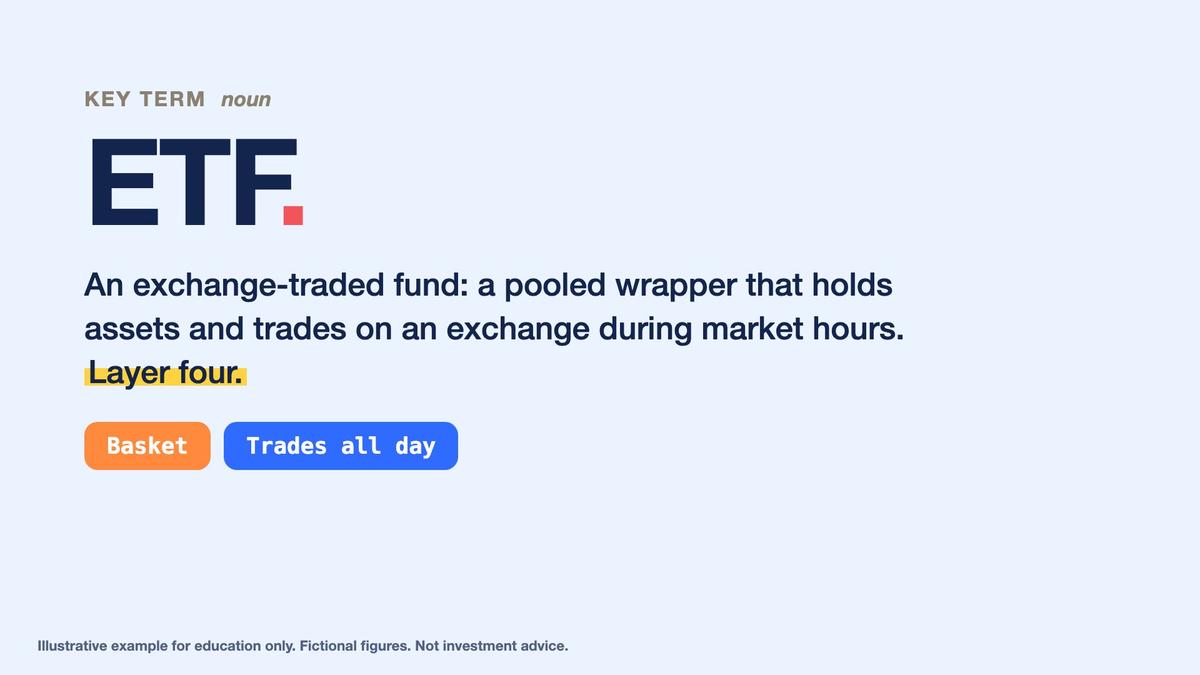
An exchange-traded fund is an investment fund whose shares trade on an exchange. The fund holds a portfolio of underlying assets and may use an index as its tracking benchmark. Our hypothetical Example 5 ETF seeks to track Example 5 Index, but the fund and index are not the same object. The index defines a measurement methodology. The ETF is an investment vehicle with assets, liabilities, expenses, shares outstanding, trading mechanics, and investor disclosures. Its actual holdings or weighting can differ from the benchmark under certain conditions.
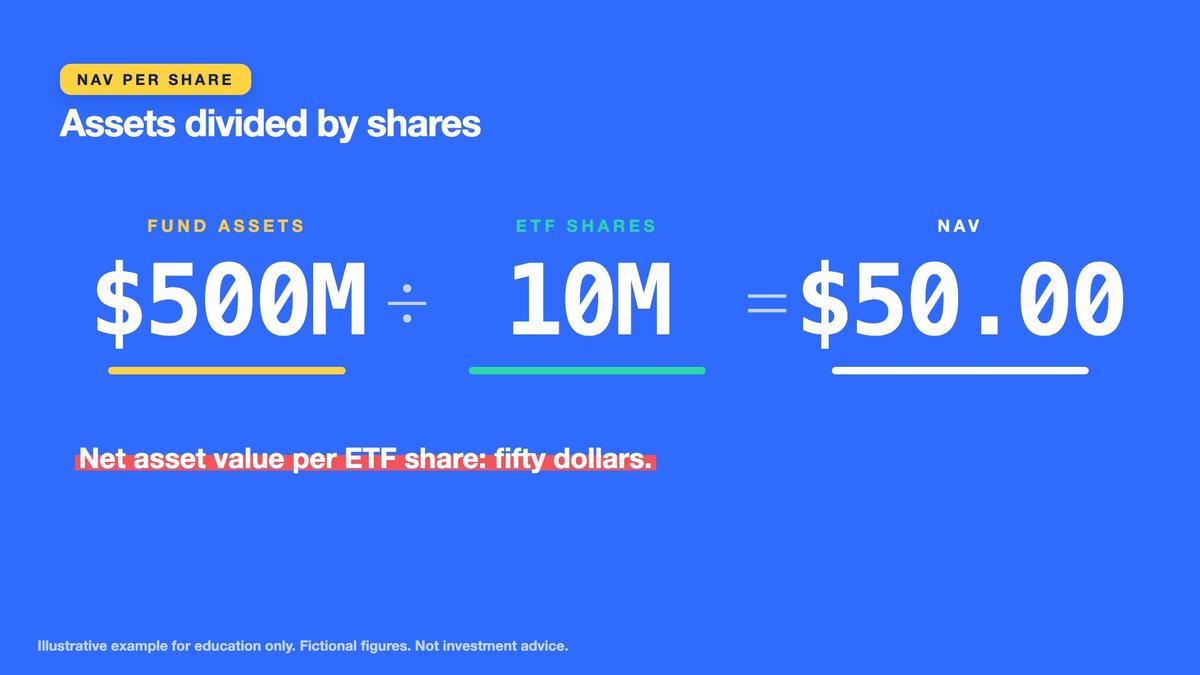
Net asset value per share, or NAV, is the value of fund assets minus fund liabilities divided by outstanding fund shares. Assume Example 5 ETF has $500 million in net assets and 10 million ETF shares outstanding. Its NAV per share is exactly $50.00. For simplicity, the numerical example treats gross assets and net assets as equal because fund liabilities are assumed negligible. Real NAV calculations follow the fund's valuation methodology and may reflect other assets, liabilities, accrued expenses, and valuation adjustments.

Key points
- An ETF holds a basket and trades on an exchange all day.
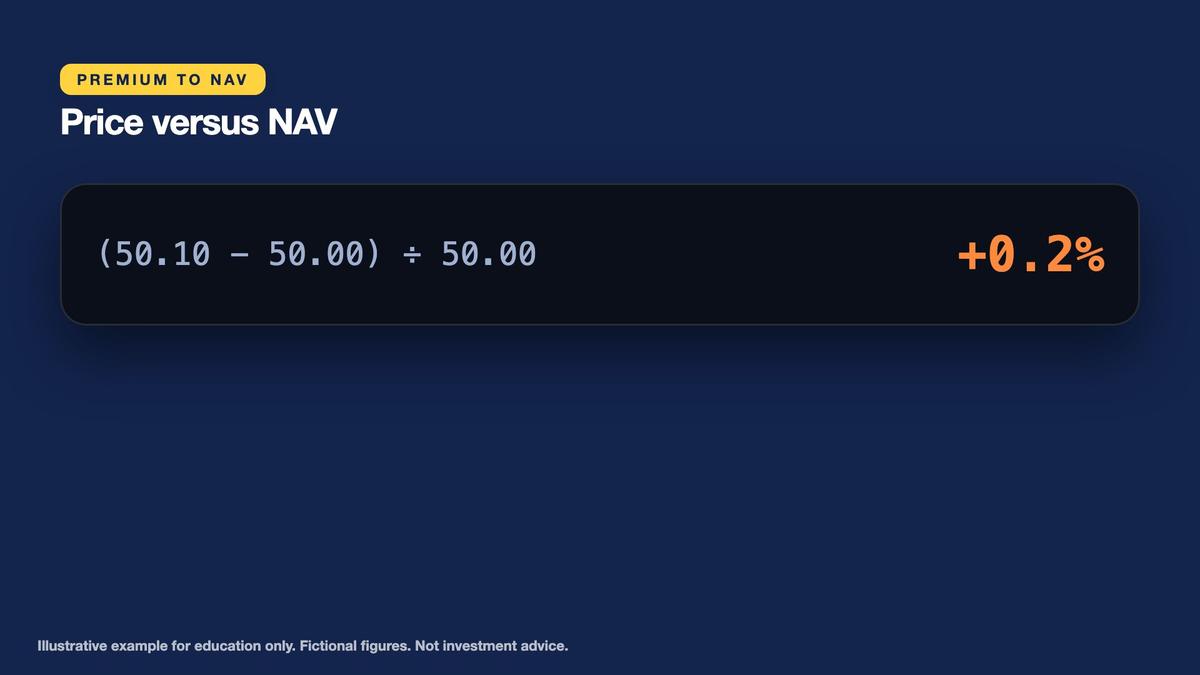
- NAV = $500M ÷ 10M = $50.00; price $50.10 is a 0.2% premium.
- An ETF tracks an index but is a separate product.
An ETF's exchange market price can differ from its NAV. Suppose Example 5 ETF trades at $50.10 while NAV is $50.00. The premium is ($50.10 - $50.00) divided by $50.00, producing exactly 0.2%. If the exchange price were below NAV, the difference would instead be described as a discount. Real funds often have creation and redemption mechanisms that can help limit discrepancies, but these do not guarantee perfect alignment, especially during volatile or illiquid markets.
Bid-Ask Spreads, Expense Ratios, and Tracking Differences
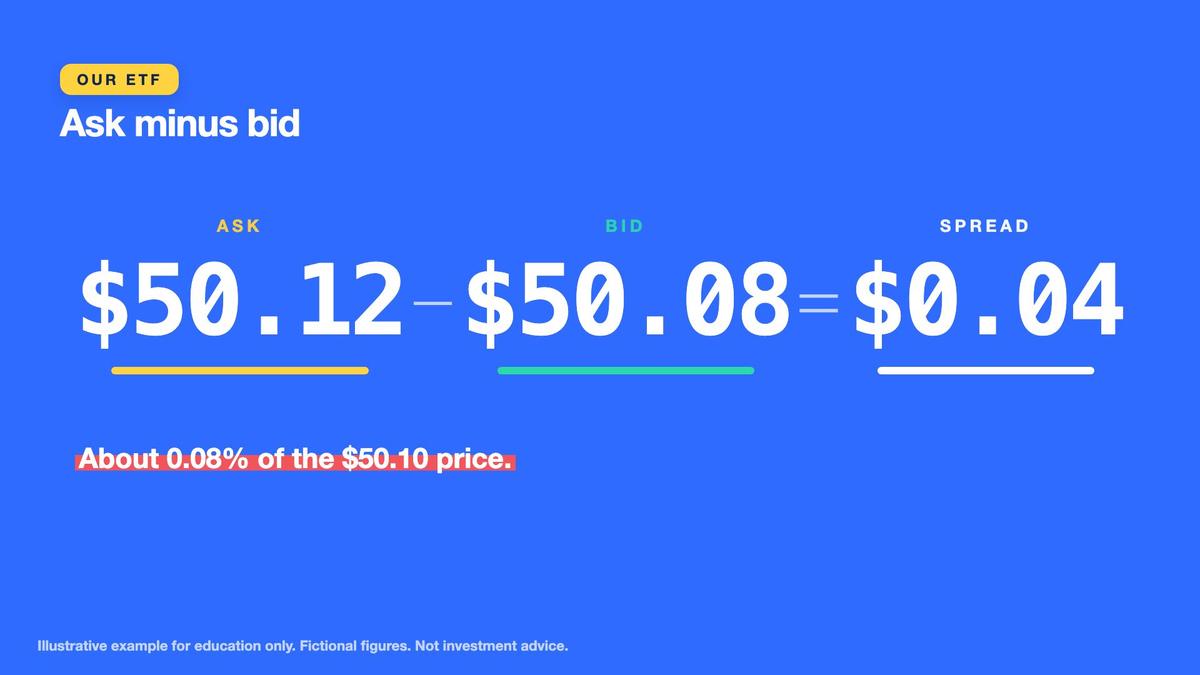
ETF shares trade through market quotations. The bid is the quoted price available from a buyer, while the ask is the quoted price requested by a seller. Suppose Example 5 ETF has a bid of $50.08 and an ask of $50.12. The quoted bid-ask spread equals exactly $0.04 per share. Relative to the $50.10 reference market price, the spread is $0.04 divided by $50.10, multiplied by 100, or approximately 0.07984%, rounded to 0.08%. A wider spread generally increases the cost of entering and exiting a position.
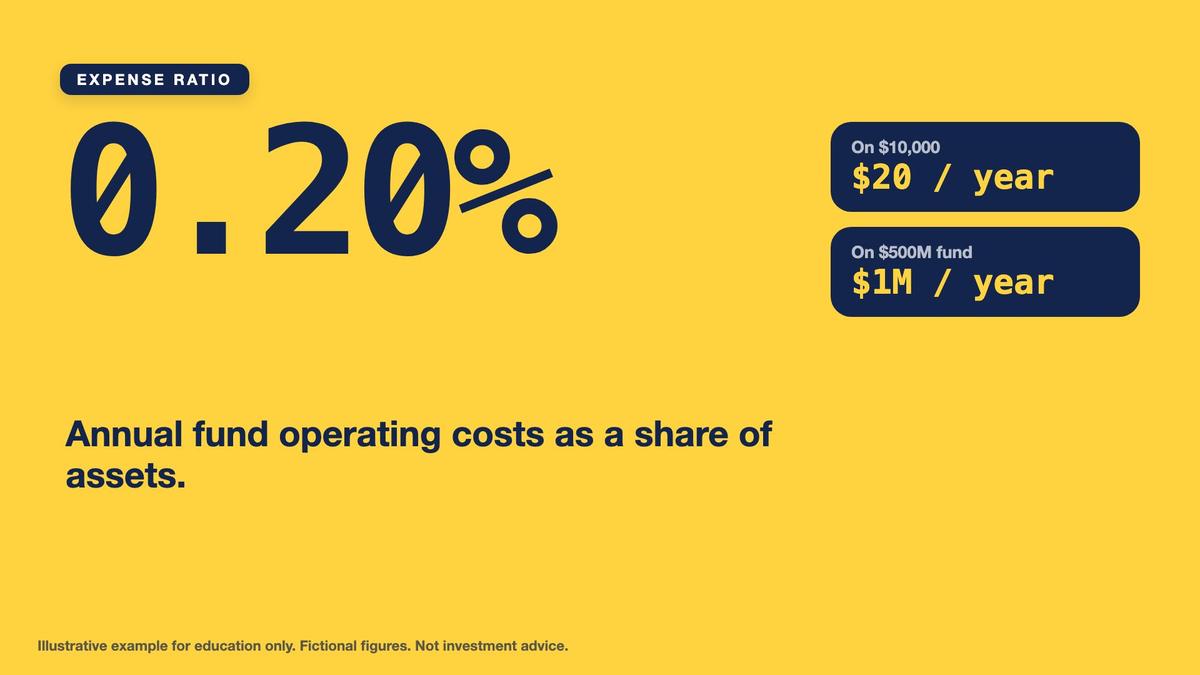
A fund's expense ratio expresses recurring operating expenses relative to fund assets. Example 5 ETF has a hypothetical annual expense ratio of 0.20%. Applied to a constant $10,000 investment for a full year, this corresponds to $20 of annual expenses. In practice, operating expenses are generally reflected within fund assets and NAV rather than collected through a separate annual invoice from the investor. The actual dollar impact depends on investment value, holding period, expense accruals, and fund mechanics.
Key points
- Spread: $50.12 − $50.08 = $0.04 (about 0.08%).
- Expense ratio 0.20% = $20 a year per $10,000.
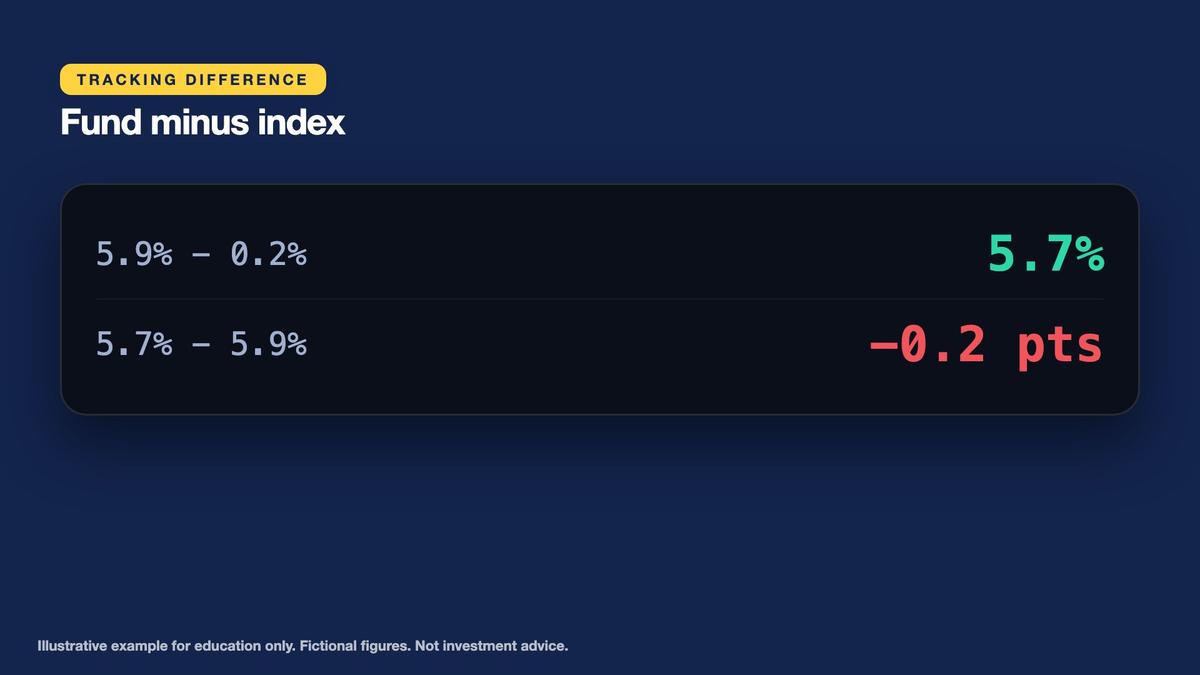
- Tracking difference: 5.7% − 5.9% = −0.2 points.
Tracking difference is the difference between a fund's return and its benchmark return over a matching period and on a comparable return basis. Assume the Example 5 Index earns 5.9% over a full year and fund expenses are the only difference. Subtracting 0.2 percentage points gives a simplified ETF return of 5.7%, so tracking difference is negative 0.2 percentage points. Real tracking differences may also reflect transaction expenses, cash holdings, replication methods, tax effects, distributions, and pricing differences. Therefore, fees alone do not always explain actual tracking results.
Fund Risks, Concentration, Dividends, and Fact Sheets
An ETF does not guarantee profits, market protection, perfect diversification, or exact index replication. If underlying securities fall, the ETF can lose value. Its exchange price can move away from NAV, and trading spreads can widen under difficult market conditions. Even a fund holding several companies may remain concentrated in a small number of dominant positions. In our hypothetical Example 5 Index, Companies A and B together account for 70% of the market-cap-weighted benchmark, meaning their combined performance has a substantial effect on the result.
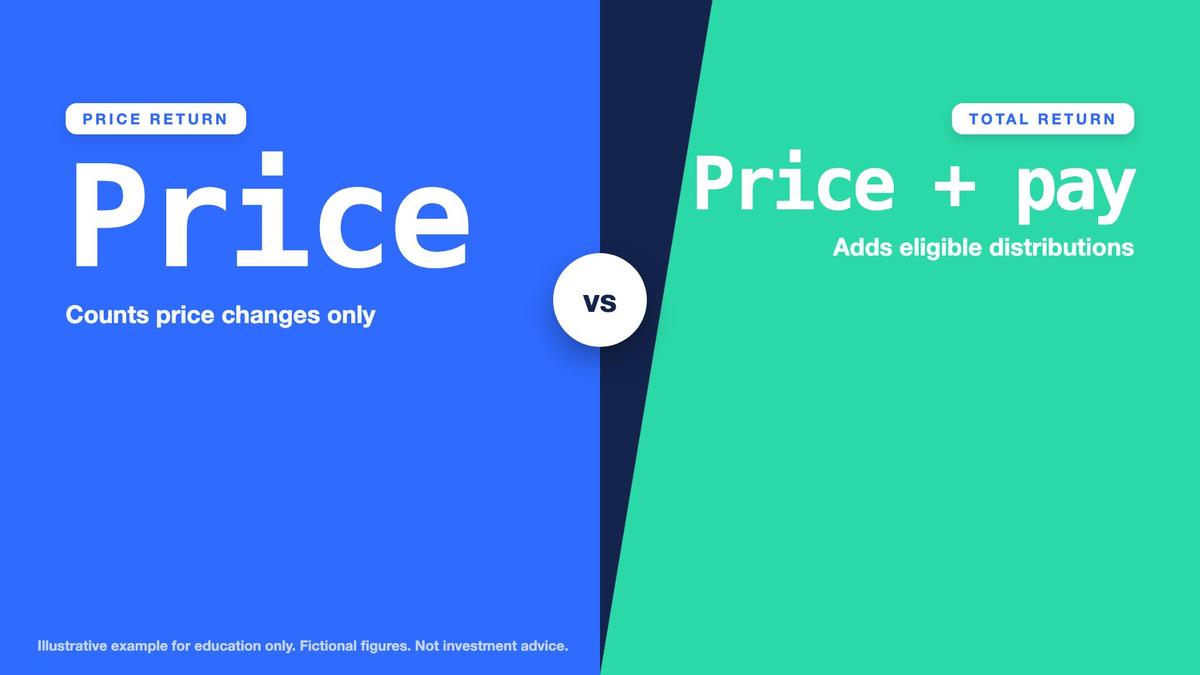
Distributions are another important consideration. A share or fund may distribute cash to shareholders, while an index may publish different return series depending on whether distributions are included. Price return and total return are therefore not interchangeable. A fund's total investor outcome may depend on distributions, reinvestment decisions, expenses, transaction costs, and changes in market price. Compare performance using consistent return definitions and measurement periods to avoid concluding that one product tracked better simply because its reported return was calculated differently.
Key points
- An ETF can fall, track imperfectly and trade away from NAV.
- Price return versus total return (dividends).
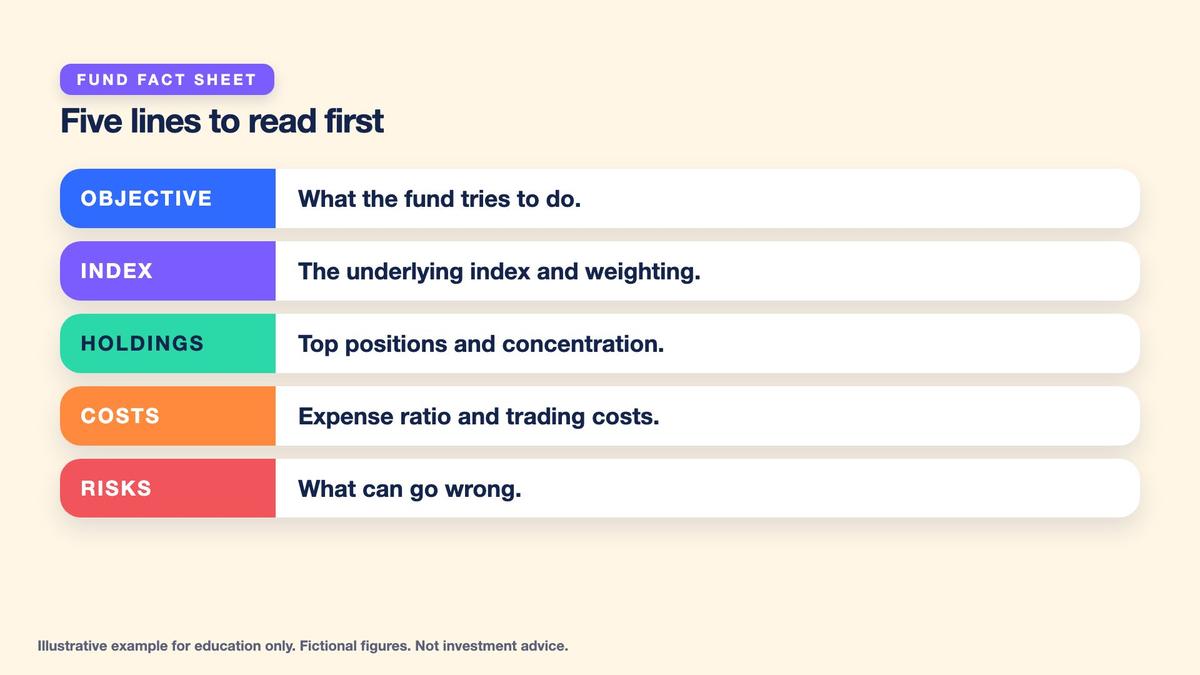
- Read the fact sheet: objective, index, holdings, costs, risks.
A useful fund fact sheet explains the fund's investment objective, benchmark index, holdings, weighting method, expense ratio, and important risks. Supporting disclosures may also describe the fund's legal structure, replication approach, distribution policy, trading market, and tracking experience. A beginner should ask whether the fund holds the expected securities, how concentrated its positions are, what recurring costs apply, and how its market price behaves relative to NAV. All research in this lesson uses fictional instruments, without identifying actual funds or tickers.
Final Practice: Identify What Each Layer Represents
Your final checkpoint is to classify the four layers correctly. A share represents an ownership claim in an individual company. A share class defines a specific set of ownership rights. An index is a rules-based measurement of selected securities, not a directly purchasable asset. An ETF is a separate fund wrapper holding assets and trading on an exchange. Use Example Corp's fictional share structure to demonstrate that ownership percentages and voting percentages can differ substantially when share classes carry unequal voting rights.

Practice Lab: Identify Shares, Indices, and ETF Mechanics
Use only fictional Example Corp, Example 5 Index, and Example 5 ETF. Begin by identifying the ownership, voting, index, and fund layers. Calculate share-class voting control, market-cap index weights, weighted and equal-weighted returns, NAV, premium, trading spread, annual expenses, and tracking difference. All calculations use hypothetical data, and the index return and simplified ETF fee comparison are assumed to cover the same one-year measurement period. Show formulas, retain appropriate rounding, and explain the limitations of each figure. No real-money investment or trading is required.
- Decision 1: Example Corp has 20 million Class A shares with one vote each and 10 million Class B shares with ten votes each. — Calculate the percentage of outstanding shares and voting power held by each class, and explain why the percentages differ.
- Decision 2: Example 5 Index has company market capitalizations of 400, 300, 150, 100, and 50 billion, with one-period returns of +10%, +5%, -4%, 0%, and +20%. — Calculate each company's market-cap weight, the cap-weighted index return, the equal-weighted return, and top-two concentration.
- Decision 3: Example 5 ETF has net assets of $500 million and 10 million fund shares outstanding, while its exchange price is $50.10. — Calculate NAV per share and determine whether the ETF trades at a premium or discount, including the exact percentage.
- Decision 4: Example 5 ETF has a bid of $50.08, ask of $50.12, reference price of $50.10, and annual expense ratio of 0.20%. A fictional learner considers $10,000 in simulated fund exposure. — Calculate the quoted spread, relative spread, and illustrative one-year operating expenses on an unchanged $10,000 value.
- Decision 5: Example 5 Index returns 5.9% over a hypothetical full year, and Example 5 ETF incurs a 0.20% annual expense ratio, with no other tracking effects assumed. — Calculate the simplified ETF return and tracking difference, then explain why a real fund could perform differently.
Answer key
Next, calculate Example 5 Index returns. Using market-cap weights of 40%, 30%, 15%, 10%, and 5%, the specified stock returns produce exactly 5.9%. Equal weighting produces 6.2%, and a starting index level of 1,000 increases to 1,059 under the cap-weighted example. Explain that the first two companies represent 70% of the benchmark and therefore create concentration. State whether an index return includes distributions before comparing it with an actual fund's total return.
Finish with Example 5 ETF. Its hypothetical NAV is $50.00 per share, market price is $50.10, and premium is 0.2%. Its quoted spread is $0.04, approximately 0.08% of the reference market price. Its 0.20% annual expense ratio represents $20 on a constant $10,000 investment over one year. Under the simplified fee-only assumption, its 5.7% return differs from the 5.9% index return by negative 0.2 percentage points. Record the definitions, assumptions, calculations, and limitations in your journal.
Worked example at a glance
Key terms
- Share: an ownership claim in one company.
- Share class: a version of a share with its own rights.
- Index: a rules-based measurement of selected securities.
- Market-cap weighting: weights proportional to market value.
- Equal weighting: the same weight for every company.
- ETF: an exchange-traded fund holding a basket of assets.
- NAV: fund assets minus liabilities per share.
- Premium or discount: market price above or below NAV.
- Bid-ask spread: the gap between the bid and ask prices.
- Expense ratio: annual fund costs as a share of assets.
- Tracking difference: fund return minus index return.
Multi Asset Trading Lab provides educational information only and does not constitute personalized investment, trading, financial, legal, accounting, or tax advice. Example Corp, Example 5 Index, Example 5 ETF, and the five fictional constituent companies are hypothetical examples created exclusively for this course. No real companies, funds, tickers, or investment recommendations are provided. All share counts, voting rights, market capitalizations, index weights, returns, index levels, fund assets, NAV calculations, market prices, spreads, expense ratios, and tracking differences are fictional. Learners should use simulated research and money only; no real-money investment or trading is required or encouraged. Company shares represent ownership claims whose voting, dividend, economic, and other rights vary by security and share class. Financial indices are mathematical measurements governed by methodologies and cannot generally be purchased directly. Index-tracking funds and ETFs are separate financial products whose actual holdings, expenses, market prices, distributions, performance, and risks can differ from the benchmark. ETFs do not guarantee profitability, capital preservation, diversification, liquidity, perfect index replication, or execution at NAV. Market prices can trade at premiums or discounts to NAV, and bid-ask spreads can widen during stressed or illiquid conditions. Market-cap weighting can create substantial concentration in the largest companies. Index price returns and total returns may differ because of dividends and reinvestment conventions; comparisons should use matching definitions and periods. Expense ratios describe recurring fund operating costs, while realized investor costs can also include spreads, brokerage fees, taxes, and other expenses. The $20 annual expense example assumes a constant $10,000 investment value for one full year and a 0.20% annual rate. The simplified 5.7% ETF return assumes the 5.9% index return and a 0.20-percentage-point expense effect cover an equivalent annual measurement period, with no other tracking effects; actual results may differ. Tracking difference can be influenced by expenses, replication choices, cash holdings, transactions, taxation, distributions, and valuation methods. Historical or simulated index returns do not guarantee future outcomes. Learners should examine fund objectives, fact sheets, prospectuses, disclosures, share-class rights, concentration, liquidity, and other risks before drawing conclusions about actual financial instruments. Nothing in this lesson constitutes a recommendation to buy, sell, or hold any security, fund, or financial product.
Lesson Checkpoint
Review what you learned and get feedback on your work.