



In this eighteen-minute beginner lesson, learners estimate hypothetical equity value using three scenarios rather than relying on a single price prediction. Through fictional Example Corp, learners forecast revenue, apply net profit margins, calculate earnings per share, select hypothetical P/E multiples, and compare implied values with a fictional market price. They also practice probability weighting, reverse valuation, sensitivity analysis, and evaluating whether cash flow and balance-sheet conditions support their assumptions.
Valuation Is an Estimate, Not a Prediction
Valuation is the process of estimating an asset's worth using information, assumptions, and a chosen analytical method. Market price is different: it is the price available in a transaction at a particular moment. An estimated value may be higher or lower than the observed market price, but this difference does not prove that the market will eventually move toward the estimate. Future business results, investor expectations, interest rates, and market conditions remain uncertain. This lesson uses only fictional Example Corp.

Our approach is intentionally simple. We forecast a company's revenue, estimate net income using an assumed net margin, divide by the expected number of shares, and apply a hypothetical price-to-earnings multiple. The resulting figure is called an implied value per share. It represents the mathematical outcome of those assumptions, not an independently established fair value. The method omits numerous financial and operational considerations, so the estimate must always be presented with its assumptions and limitations.

Key points
- Valuation is an estimate built from assumptions, not a prediction.
- Price is what the market asks; value is what you estimate.
- Three scenarios show a range instead of one number.
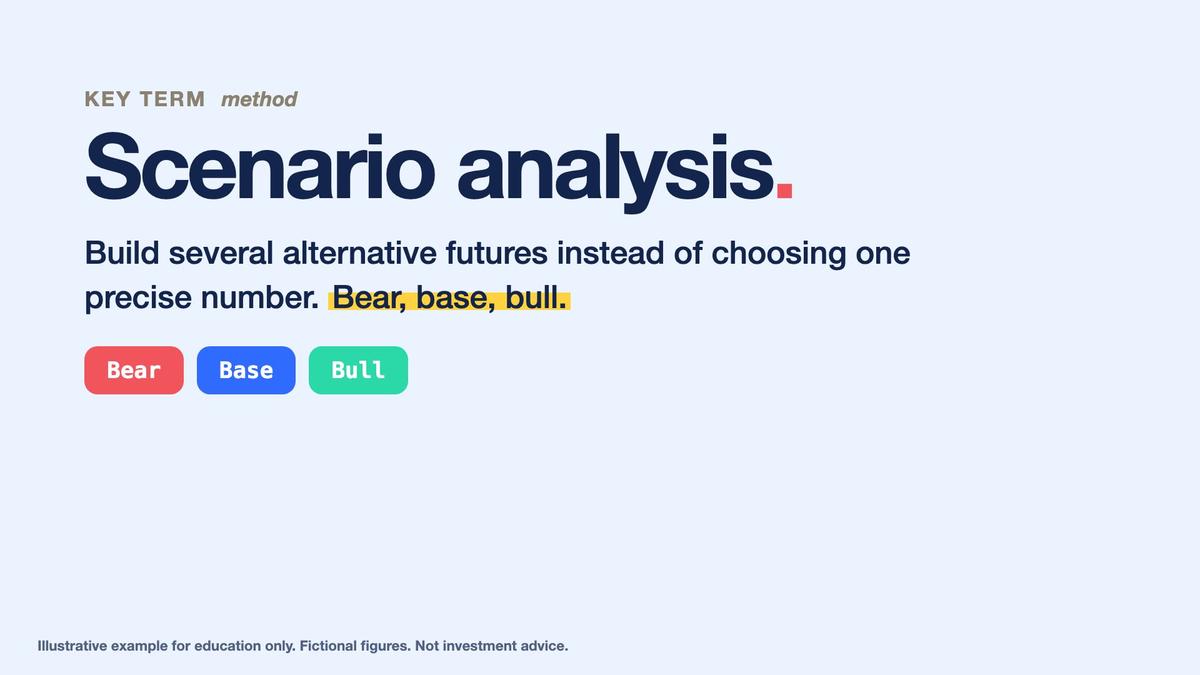
The central learning objective is comparing three different combinations of revenue growth and profitability rather than depending on one seemingly precise answer. We will build bear, base, and bull scenarios three years into the future. Each scenario will use a distinct growth rate, net margin, and P/E multiple. We will then test how changing individual assumptions affects the estimate. All prices, values, and returns in this exercise are hypothetical and involve no real-money investment decisions.
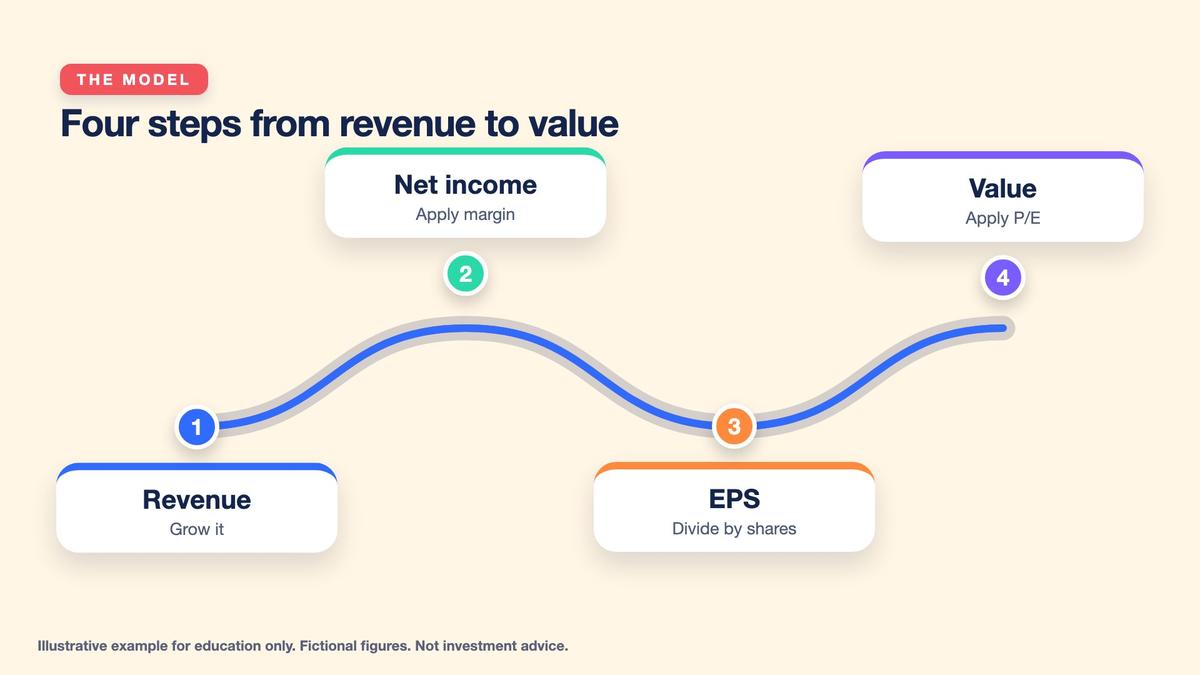
Build the Four-Step Revenue-to-Value Model
Begin with Example Corp's fictional Year 2 income statement from Lesson Seven. Revenue is $1,100 million, net income is $90 million, and the company has 30 million weighted-average shares. Under the simplified assumption that earnings attributable to common shareholders equal net income and share count remains unchanged, Year 2 EPS is exactly $3.00. This historical figure establishes a reference point. It does not imply that the company's future earnings will remain at the same level.

The first modeling step forecasts revenue through Year 5. Because Year 5 occurs three years after Year 2, apply the hypothetical annual growth rate three times using compounding. The second step multiplies forecast revenue by an assumed net profit margin to estimate net income. The third step divides forecast net income by 30 million assumed shares to calculate EPS. The final step multiplies projected EPS by a hypothetical P/E multiple to produce implied value per share.
Key points
- Four steps: grow revenue, apply margin, divide by shares, apply P/E.
- Year 2 starting point: revenue 1,100, net income 90, 30M shares, EPS 3.00.
- Units: millions of dollars, millions of shares, dollars per share.
In mathematical terms, Year 5 revenue equals $1,100 million multiplied by one plus the annual growth rate cubed. Forecast net income equals Year 5 revenue multiplied by net margin. EPS equals forecast net income divided by shares, and implied value equals EPS multiplied by P/E. For consistency, this lesson rounds forecast revenue and net income to one decimal place in millions, EPS to two decimal places, and then calculates implied value using that rounded EPS.


Calculate the Bear, Base, and Bull Scenarios
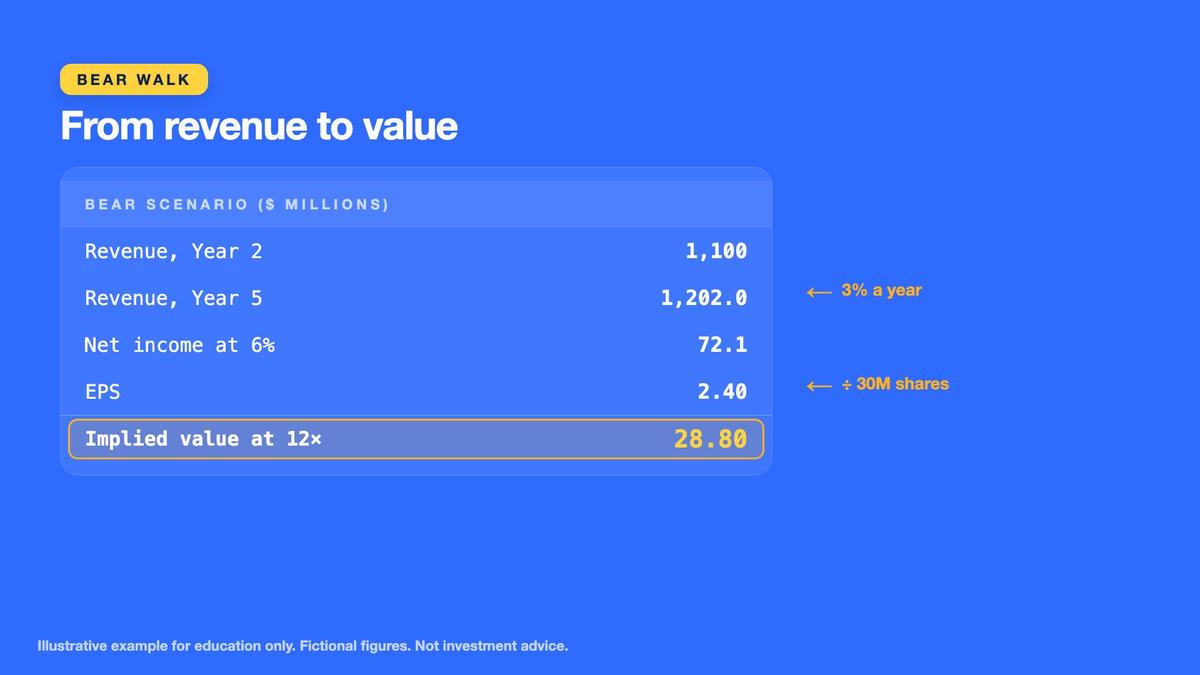
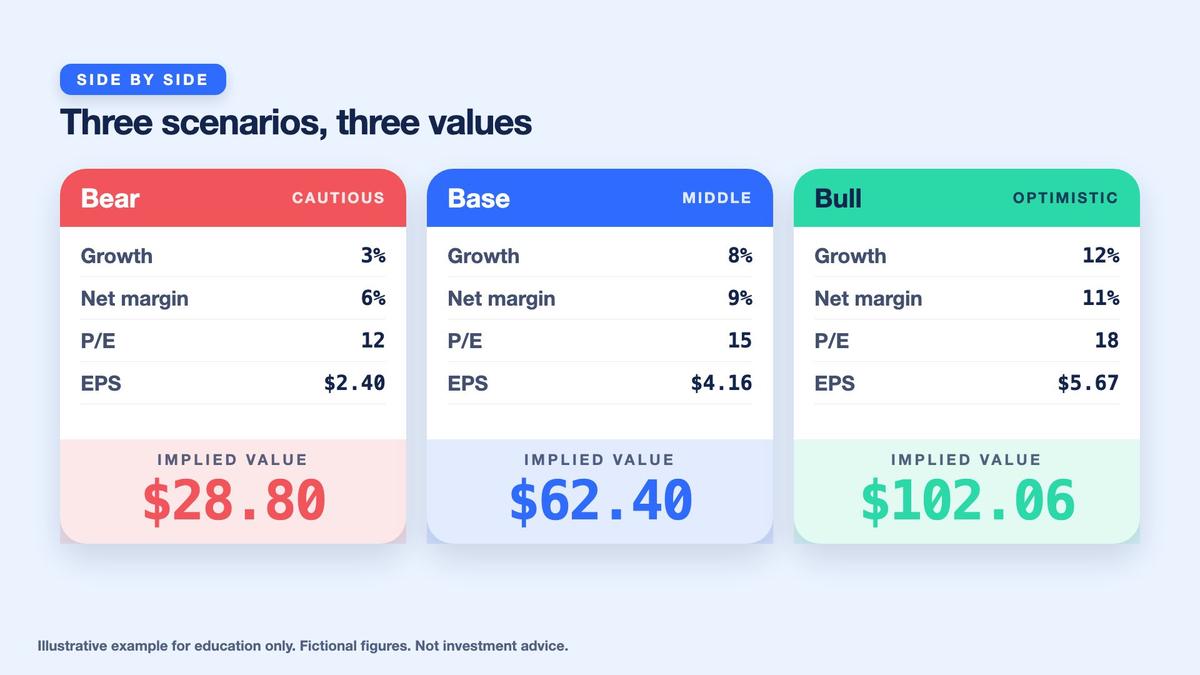
The bear scenario assumes three-percent annual revenue growth, six-percent net margin, and a twelve-times P/E multiple. Three years of compounding produce $1,201.9897 million revenue, rounded to $1,202.0 million. Applying the six-percent margin produces $72.12 million net income, rounded to $72.1 million. Dividing by 30 million shares gives approximately $2.40 EPS. Multiplying the rounded EPS by twelve produces a bear implied value of exactly $28.80 per share under the prescribed calculation.
The base scenario assumes eight-percent annual revenue growth, nine-percent net margin, and fifteen-times earnings. Revenue becomes $1,385.6832 million, rounded to $1,385.7 million. Applying a nine-percent net margin yields $124.713 million, rounded to $124.7 million. With 30 million assumed shares, rounded EPS is $4.16. Multiplying by the fifteen-times multiple gives an implied value of $62.40 per share. The result reflects stronger growth and profitability assumptions than the bear case.

Key points
- Bear: 3%, 6%, 12× gives revenue 1,202.0, net income 72.1, EPS 2.40, value 28.80.
- Base: 8%, 9%, 15× gives 1,385.7, 124.7, 4.16, value 62.40.
- Bull: 12%, 11%, 18× gives 1,545.4, 170.0, 5.67, value 102.06.
The bull scenario assumes twelve-percent annual revenue growth, eleven-percent net margin, and an eighteen-times P/E. Revenue becomes $1,545.4208 million, rounded to $1,545.4 million. The eleven-percent margin produces $169.994 million net income, rounded to $170.0 million. EPS is approximately $5.67 after rounding. Multiplying by eighteen gives an implied value of $102.06. Across the three scenarios, the bull-bear spread is exactly $73.26 per share, illustrating how strongly assumptions influence valuation.

Compare Implied Values With a Fictional Market Price
To practice interpreting the scenario results, assume Example Corp has a fictional reference market price of $50.00 per share. The bear implied value of $28.80 is $21.20 below that reference price, equivalent to negative 42.4 percent. The base implied value of $62.40 is $12.40 higher, or positive 24.8 percent. The bull implied value of $102.06 is $52.06 higher, or positive 104.12 percent, rounded to 104.1 percent.
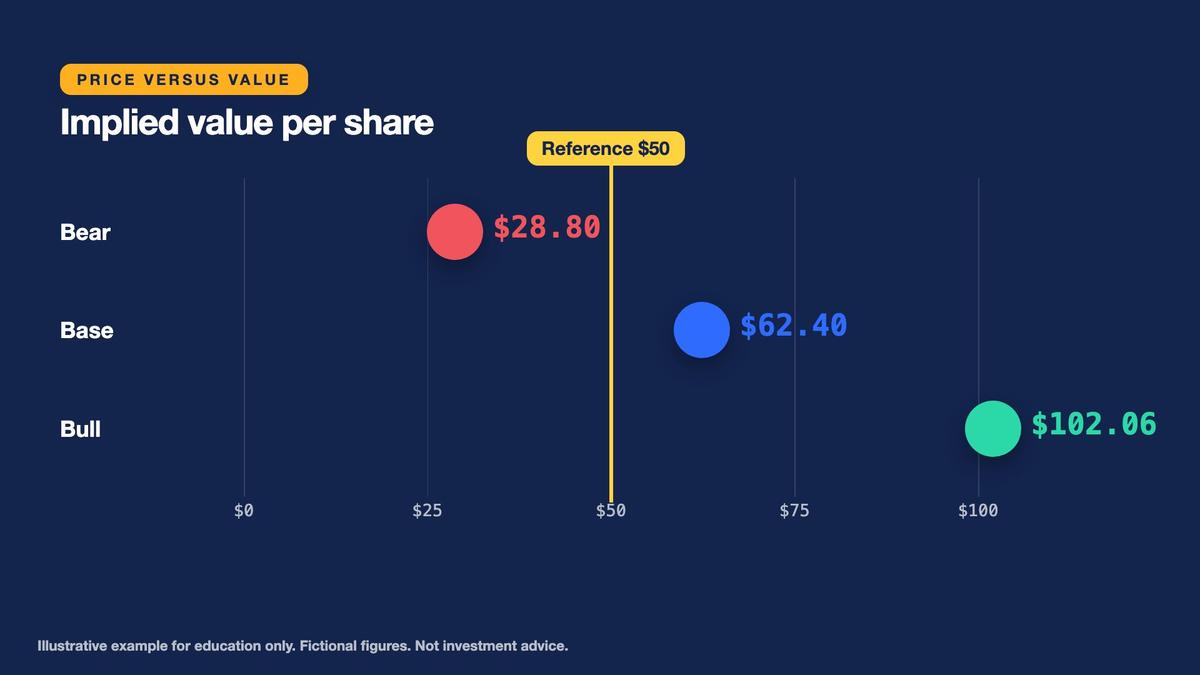
These comparisons measure the distance between a hypothetical market price and values calculated under specific assumptions. They are not forecasts of realized investment returns. Actual returns depend on future transaction prices, timing, distributions, corporate actions, and other variables. A scenario value may never occur in the market. A large implied upside figure can be the result of optimistic inputs rather than evidence of an attractive opportunity. Present these percentages as conditional comparisons, not promises.
Key points
- Range: 102.06 − 28.80 = 73.26 per share.
- Versus a fictional $50: −42.4%, +24.8%, +104.1%.
- These are gaps between assumptions and a price, not predicted returns.
The P/E multiple is particularly important. It represents an assumed relationship between earnings per share and the market's valuation of those earnings. Higher expected growth, lower perceived uncertainty, or lower interest rates may support higher multiples in some circumstances, but no multiple is guaranteed. Market preferences, financial conditions, and business risks can change. The same future EPS multiplied by different P/E assumptions produces different implied values, even when the underlying operating forecast remains unchanged.
Probability Weighting and Reverse Valuation
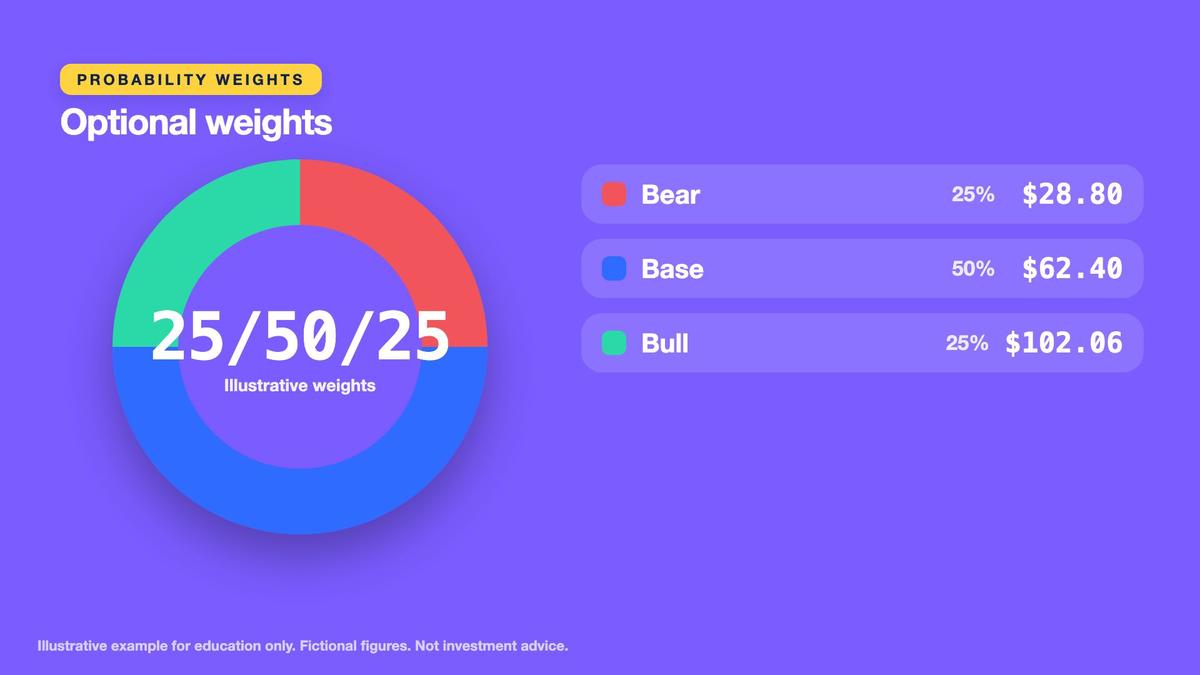
A probability-weighted scenario estimate combines the modeled outcomes using assumed weights. For this educational example, assign twenty-five percent to bear, fifty percent to base, and twenty-five percent to bull. The contributions are $7.20, $31.20, and $25.515 respectively. Adding them produces exactly $63.915 per share, approximately $63.9 when rounded to one decimal place. Compared with the fictional $50 reference price, the unrounded weighted result is 27.83 percent higher, approximately 27.8 percent.
Probability weighting can organize uncertainty, but its output is only as credible as its assumed scenarios and weights. Our twenty-five, fifty, and twenty-five percent weights are illustrative choices, not measured probabilities. Different weights change the estimate. The three scenarios may also overlook outcomes that are better or worse than those modeled. Do not interpret the weighted value as a statistically validated forecast or automatically more accurate than the individual cases.
Key points
- Weights 25/50/25 give about 63.9 (+27.8% versus $50).
- Weights are assumptions too.
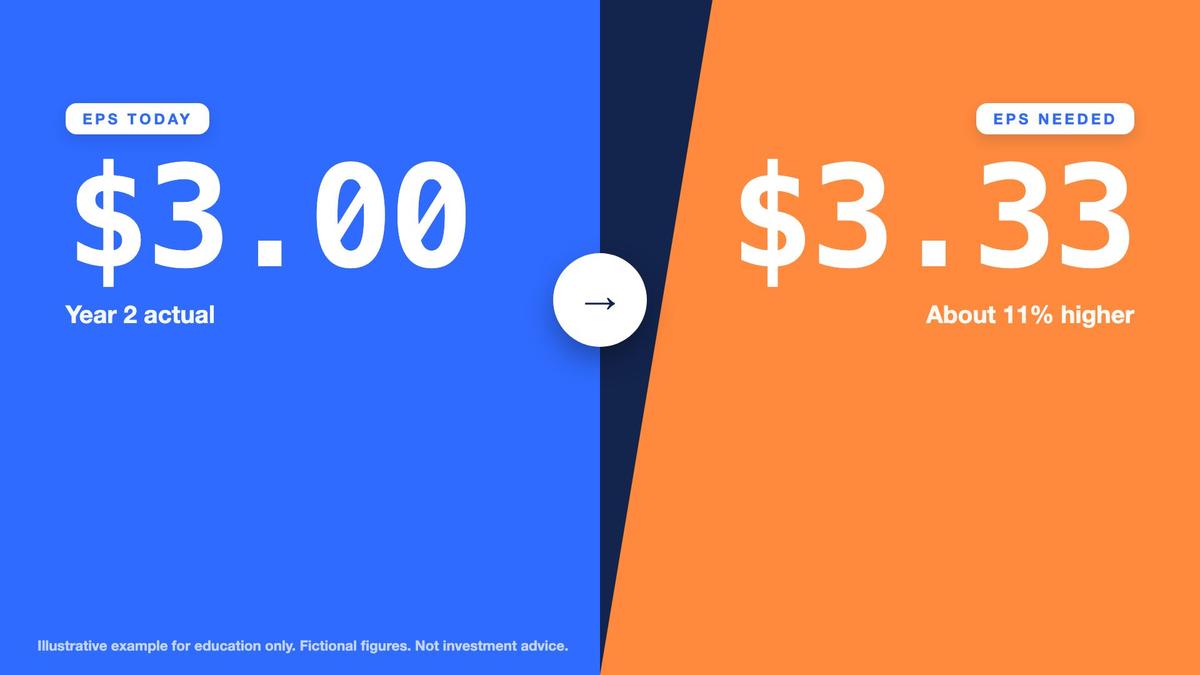
- Reverse view: $50 ÷ 15 ≈ $3.33 EPS needed.
Reverse valuation asks a different question: what earnings would justify an observed price under a selected multiple? At a fictional $50 market price and fifteen-times P/E, required EPS equals $50 divided by fifteen, or exactly ten-thirds dollars, approximately $3.33. This reverses the usual calculation. Instead of predicting a value from assumed earnings, the learner examines the earnings implied by the price and chosen multiple, then asks whether those assumptions appear supportable.
Sensitivity Analysis and Margin of Safety
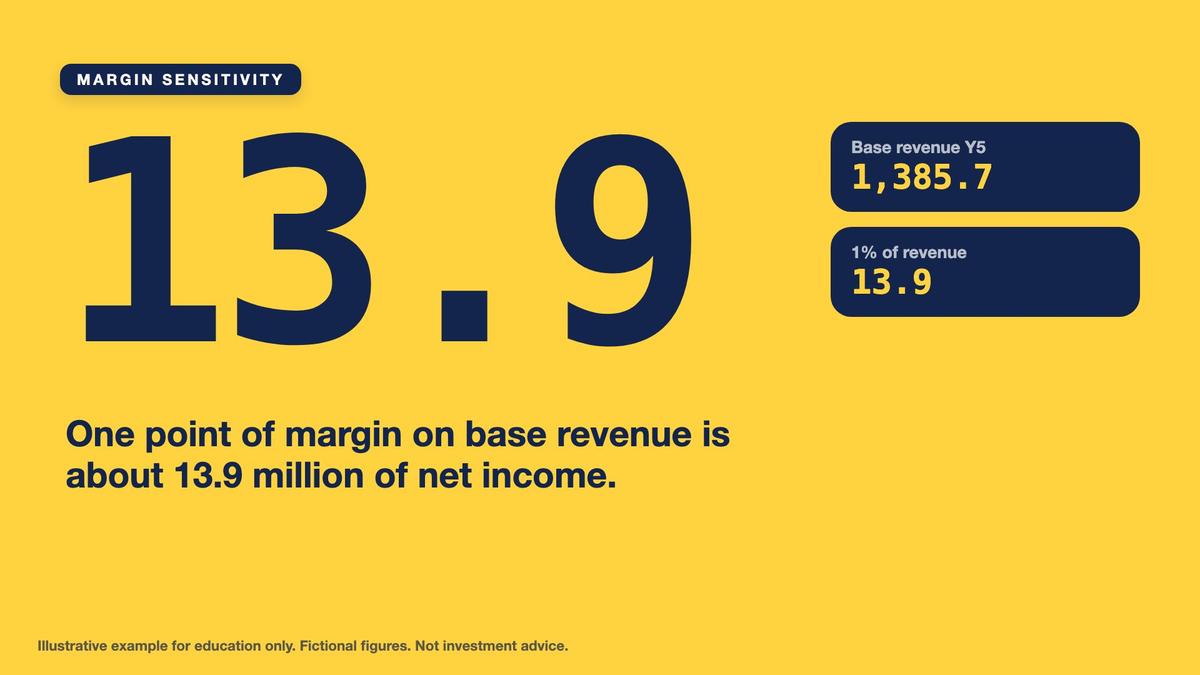
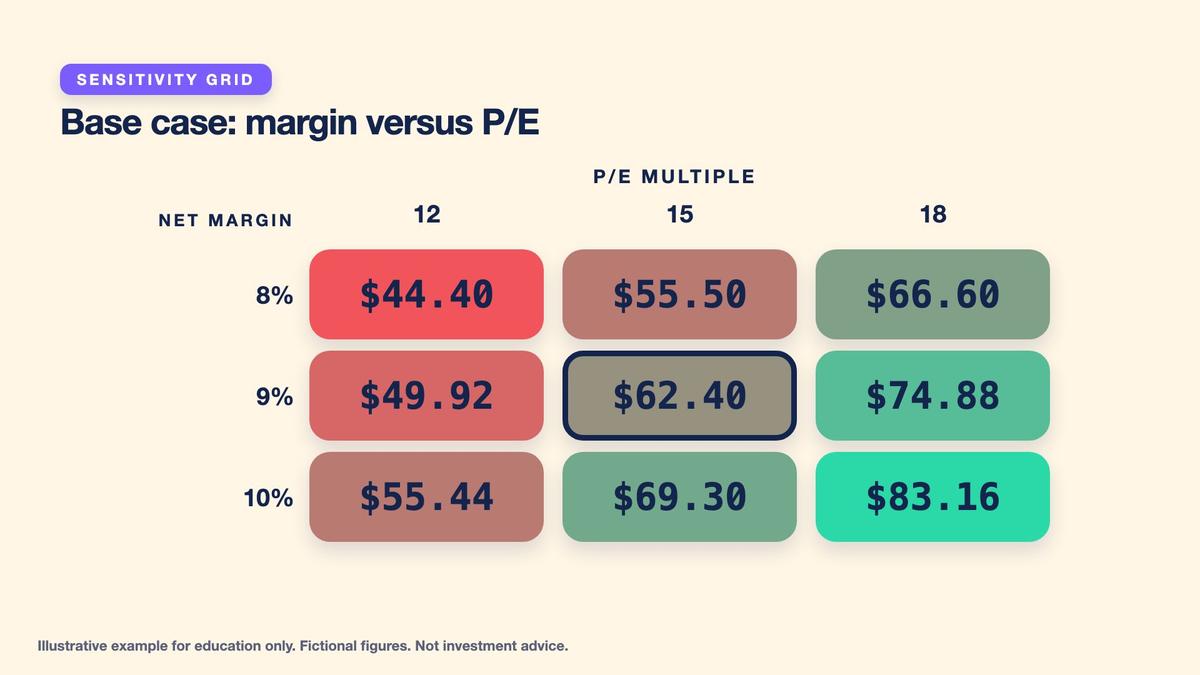
Sensitivity analysis changes one assumption while holding others constant. Start with the base scenario's rounded Year 5 revenue of $1,385.7 million and fifteen-times P/E. Reducing net margin from nine to eight percent produces $110.856 million net income, rounded to $110.9 million. Dividing by 30 million shares gives rounded EPS of $3.70. Multiplying by fifteen produces $55.50 implied value. Increasing net margin to ten percent produces $138.57 million net income, rounded to $138.6 million, EPS of $4.62, and value of $69.30.

Now hold the base scenario's rounded EPS of $4.16 constant and change only the P/E multiple. A twelve-times multiple produces $49.92 implied value, while eighteen times produces $74.88. This exercise demonstrates that valuation can change materially even when forecast earnings remain identical. Sensitivity analysis helps identify which inputs deserve further research. It does not establish which assumption will occur, and it cannot eliminate model risk.
Key points
- Margin 8% gives $55.50; margin 10% gives $69.30.
- P/E 12 gives $49.92; P/E 18 gives $74.88.
- Margin of safety is a buffer, not a guarantee.
Margin of safety is the conceptual idea of allowing a buffer between estimated value and a hypothetical transaction price to account for uncertainty and possible analytical errors. A larger apparent buffer may offer more room for mistaken assumptions, but it is not guaranteed protection. If estimated value is based on unrealistic growth, margins, or multiples, the apparent discount may be misleading. The concept therefore requires cautious assumptions and an awareness that valuation models can be wrong.

Model Limitations and Financial Statement Cross-Checks
Simple valuation models are vulnerable to garbage-in-garbage-out errors. An unrealistic growth rate, unsupported net margin, inaccurate share count, or arbitrary P/E multiple can produce a precise-looking but unreliable estimate. Anchoring occurs when analysts allow a familiar market price to influence their supposedly independent assumptions. Recency bias occurs when recent business performance is projected forward without sufficient consideration of changing conditions. False precision appears when detailed decimals create the impression of certainty despite uncertain inputs.

The model also omits important balance-sheet and cash-flow considerations. From Lesson Eight, learners know that debt, cash, maturity schedules, and financing costs affect financial flexibility. From Lesson Nine, Example Corp generated $90 million operating cash flow but spent $130 million on capital expenditures, producing negative $40 million FCF in Year 2. This historical result does not invalidate future growth scenarios, but it creates an important question about whether projected earnings could translate into sustainable cash generation.

Key points
- Watch garbage in/out, anchoring, recency bias and false precision.
- Cross-check against Lesson 7 earnings and Lesson 9 cash flow.
- Consider debt, liquidity, capex and dilution.
When testing a scenario, ask whether projected revenue growth requires additional inventory, receivables, equipment, or financing. Consider whether margins can improve while interest expenses, taxes, share dilution, and competitive pressures remain manageable. Compare the assumptions with financial statement notes and management discussion. The simple P/E approach does not explicitly model every cash flow, debt obligation, or change in capital structure. A responsible journal records these limitations alongside the valuation calculations.
Final Practice: Compare Three Growth and Margin Assumptions
Your final checkpoint is a three-column valuation comparison for fictional Example Corp. Record the common starting inputs: Year 2 revenue of $1,100 million, net income of $90 million, 30 million shares, and EPS of $3.00. Forecast Year 5 using three years of compounding. The bear scenario assumes three-percent growth, six-percent net margin, and twelve-times P/E. The base scenario uses eight-percent growth, nine-percent margin, and fifteen-times P/E. The bull scenario uses twelve-percent growth, eleven-percent margin, and eighteen-times P/E.

Practice Lab: Compare Three Hypothetical Valuation Scenarios
Use fictional Example Corp only. Start with Year 2 revenue of $1,100 million, net income of $90 million, and 30 million shares. Forecast three years ahead to Year 5. For each scenario, compound revenue using its annual growth assumption, round revenue and net income to one decimal place in millions, round EPS to two decimals, and multiply rounded EPS by the assumed P/E multiple. Compare implied values against the fictional $50 reference price. Apply illustrative probability weights and perform sensitivity tests. These are conditional valuation estimates, not price predictions or investment recommendations.
- Decision 1: Example Corp's bear scenario assumes annual revenue growth of 3%, net margin of 6%, and P/E of 12 over the three-year forecast horizon. — Calculate Year 5 revenue, net income, EPS, and implied value per share using the lesson's rounding rules.
- Decision 2: Example Corp's base scenario assumes annual revenue growth of 8%, net margin of 9%, and P/E of 15 over three years. — Calculate forecast revenue, net income, EPS, implied value, and percentage difference versus the fictional $50 reference price.
- Decision 3: Example Corp's bull scenario assumes annual revenue growth of 12%, net margin of 11%, and P/E of 18 over the same three-year horizon. — Calculate implied value, comparison with the fictional $50 price, and the spread between bull and bear implied values.
- Decision 4: The learner assigns hypothetical probabilities of 25% bear, 50% base, and 25% bull to implied values of $28.80, $62.40, and $102.06. — Calculate the weighted value and percentage difference versus the fictional $50 price, then explain the limitation of the weights.
- Decision 5: Example Corp's base scenario has rounded revenue of $1,385.7 million, 30 million shares, rounded EPS of $4.16, and a base P/E of 15. — Calculate implied values at 8% and 10% net margins with P/E fixed at 15, then at P/E multiples of 12 and 18 with EPS fixed at $4.16.
Answer key
Using the lesson's rounding method, the three implied values are $28.80, $62.40, and $102.06 per share. Compare them with the fictional $50 reference price, producing negative 42.4 percent, positive 24.8 percent, and positive 104.1 percent respectively. Apply the illustrative twenty-five, fifty, and twenty-five percent weights to obtain approximately $63.9 weighted value. Then perform sensitivity tests on net margin and P/E, showing how one changed assumption can materially alter the output.
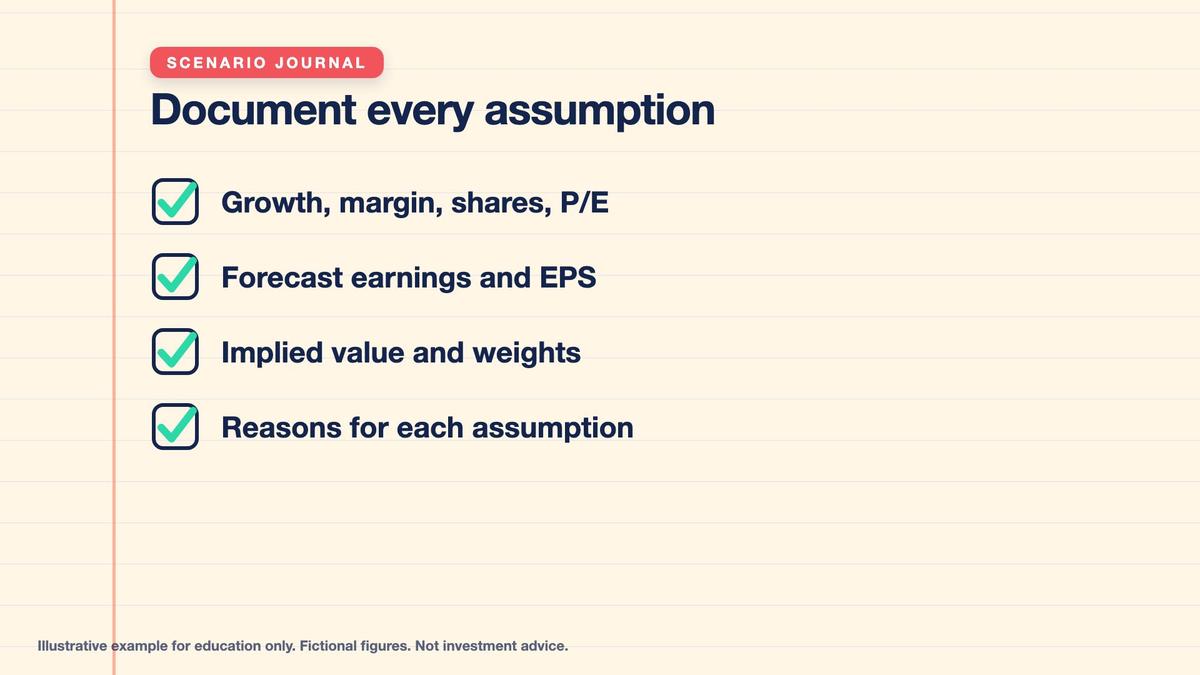
Finish your journal by identifying which assumptions you consider uncertain and what further evidence would be needed to support them. Revisit the income statement to examine historical earnings and the cash flow statement to consider whether projected profitability could produce cash after investment spending. Record the forecast horizon, rounding conventions, scenario weights, and model limitations. The outcome is a transparent scenario comparison, not a real-company price target, trading signal, or personalized investment recommendation.
Worked example at a glance
Key terms
- Valuation: an estimate of what an asset might be worth under stated assumptions.
- Scenario: one set of assumptions: bear, base or bull.
- Net margin: net income divided by revenue.
- EPS: earnings per share: net income divided by shares.
- P/E multiple: price divided by earnings per share; here an assumed multiplier.
- Implied value: EPS multiplied by the assumed P/E.
- Probability weight: the share of confidence you give a scenario.
- Reverse valuation: starting from the price and asking what must be true.
- Sensitivity analysis: changing one assumption at a time.
- Margin of safety: a buffer between estimated value and the price you would accept.
- Anchoring: letting a familiar price distort your estimate.
Multi Asset Trading Lab provides educational information only and does not constitute personalized investment, trading, financial, accounting, legal, or tax advice. Example Corp is entirely fictional, and all historical results, forecast revenues, margins, earnings, share counts, valuation multiples, implied values, market prices, probability weights, sensitivity calculations, and scenario comparisons are hypothetical. No real-money trading or investment is required or encouraged. The fictional $50 reference market price is used only for mathematical comparison and does not refer to an actual security. No implied value in this lesson constitutes a real-company price target, expected future trading price, guaranteed return, or recommendation to buy, sell, or hold any security. Valuation estimates depend on uncertain assumptions about revenue growth, profitability, earnings, share count, financing conditions, market valuation multiples, and business risks. The bear, base, and bull scenarios are illustrative possibilities rather than exhaustive outcomes, and their probability weights are educational assumptions rather than statistically validated probabilities. Probability-weighted valuation does not eliminate uncertainty or guarantee that the resulting value will be achieved. Price-to-earnings multiples can change substantially because of business expectations, interest rates, investor preferences, market conditions, and perceived risk. The simplified valuation model does not independently account for every aspect of debt, cash balances, working capital, capital expenditures, dilution, taxation, dividends, financing needs, or future cash flow. Historical earnings and free cash flow may not predict future results. The lesson uses staged rounding conventions for forecast revenue, net income, and EPS, so calculations made without intermediate rounding may produce different final values. Sensitivity analysis illustrates how assumptions affect outcomes but cannot identify which future scenario will occur. Margin of safety is an analytical concept, not guaranteed downside protection. Analytical errors, unsupported assumptions, anchoring, recency bias, survivorship bias, and false precision can materially distort valuations. Learners should use hypothetical data, verify all calculations, consult original financial disclosures for real-world research, recognize the limitations of simplified models, and seek qualified professional advice before making actual financial decisions.
Lesson Checkpoint
Review what you learned and get feedback on your work.