



In this twelve-minute hands-on lab, learners transform a fictional company research thesis into a separate, rule-based paper-trading plan. Using Example Corp and a $10,000 simulated account, learners define a hypothetical limit entry, stop-loss invalidation, risk budget, position cap, take-profit targets, and time-based review rule. They calculate risk-based quantity, apply a stricter position cap, evaluate reward-to-risk, and document the plan before submitting any demo order. The lab emphasizes that business thesis invalidation and trade-order invalidation operate on different timescales and must never be confused.
Two Documents: Company Thesis Versus Demo Trade Plan
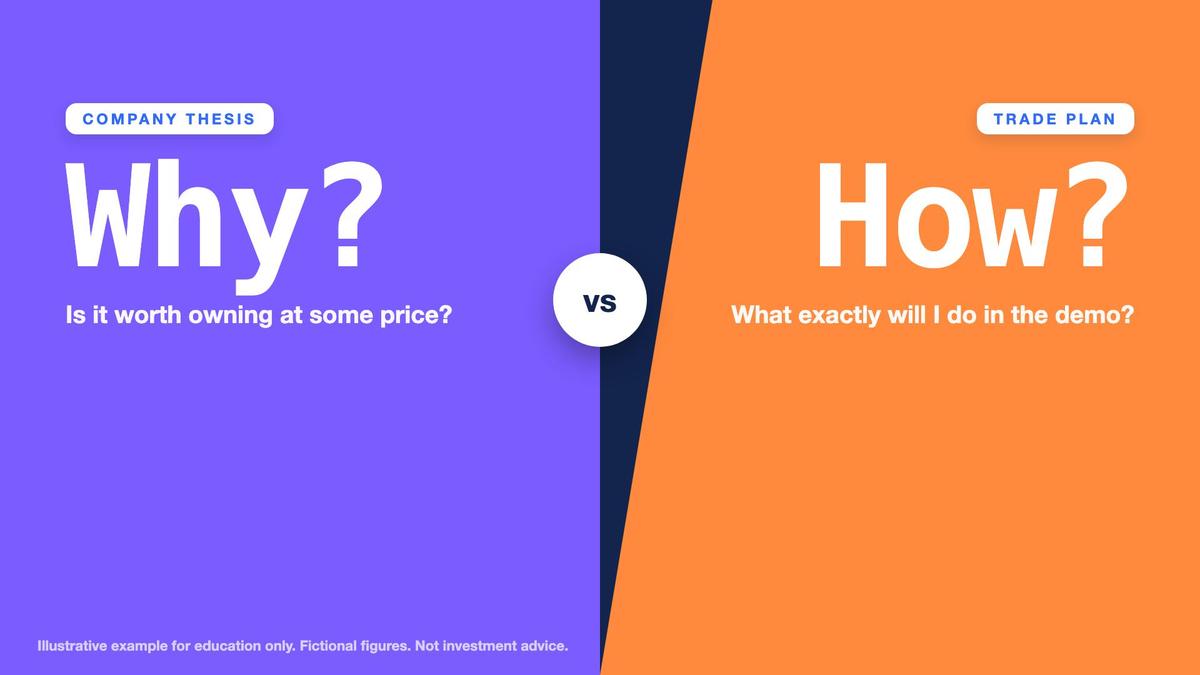
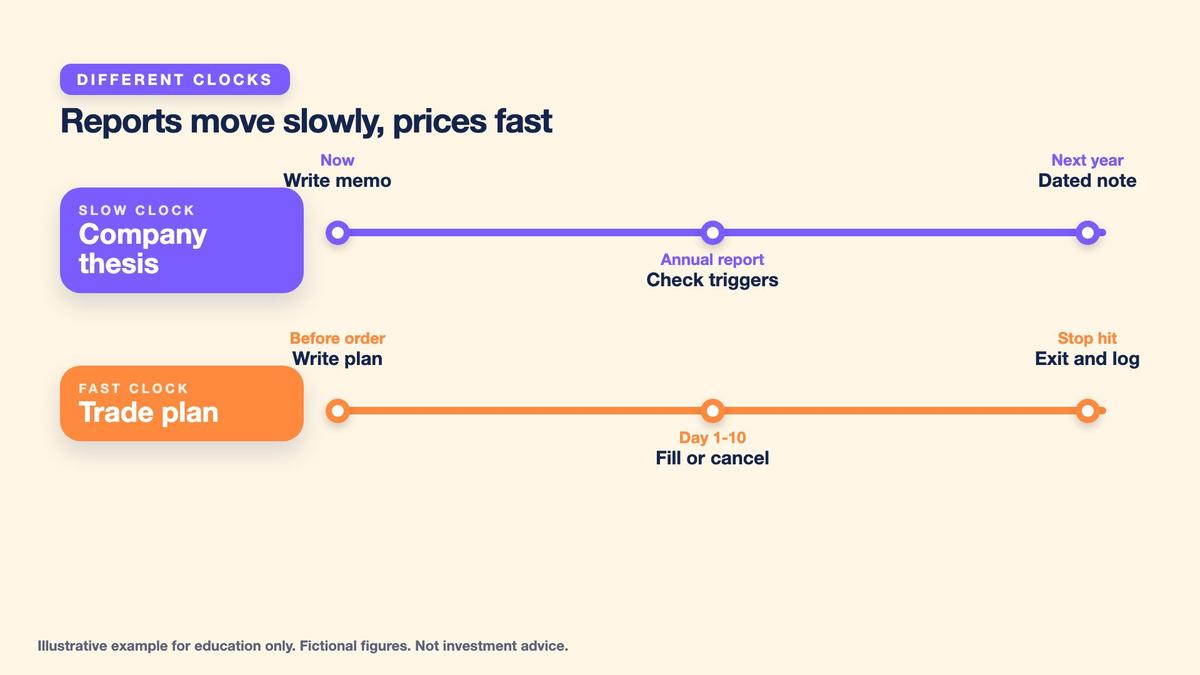
A company thesis describes why a business may be worth owning at some price and which developments would cause the researcher to reconsider that view. It focuses on the business model, financial statements, risks, valuation assumptions, and evidence that can be checked in future filings. A thesis is normally reviewed over a longer horizon, often around quarterly or annual disclosures. It is a research document, not an instruction to enter a market position. A business can appear attractive under a valuation scenario without presenting an appropriate entry at the current market price.

A trade plan answers a different question: exactly what will the learner do in a simulated account, at which prices, with what quantity, and under which invalidation conditions? The trade plan must be specific enough that another learner can independently calculate its intended loss and possible reward. It identifies the side, order type, entry, stop, position size, take-profit levels, execution costs, review time, and related journal entry. Its rules should be written before submission rather than invented in response to unfavorable market movement.
Key points
- A thesis asks why a business may be worth owning; a plan asks how you will act.
- They are two documents on two clocks.
- Write the plan before the order.
The essential distinction is that the thesis and trade plan operate on different clocks. A business thesis may remain unchanged when a simulated trade hits its stop. Conversely, a company's financial disclosures may invalidate the thesis while a hypothetical order has not yet reached its technical stop. In this lab, we use the fictional Example Corp memo from Lesson Eleven, the scenario valuation from Lesson Ten, and the Week One simulated trading workflow. No real security or exchange connection is involved.
Review Example Corp's Thesis and Business Invalidation Conditions
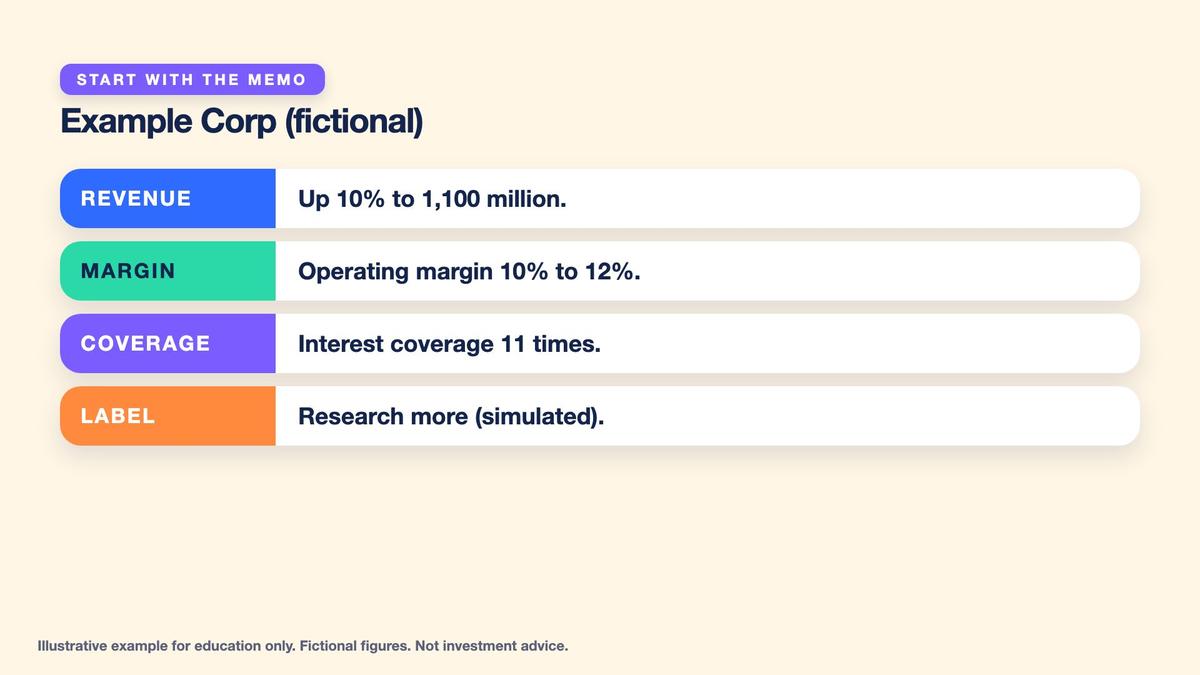
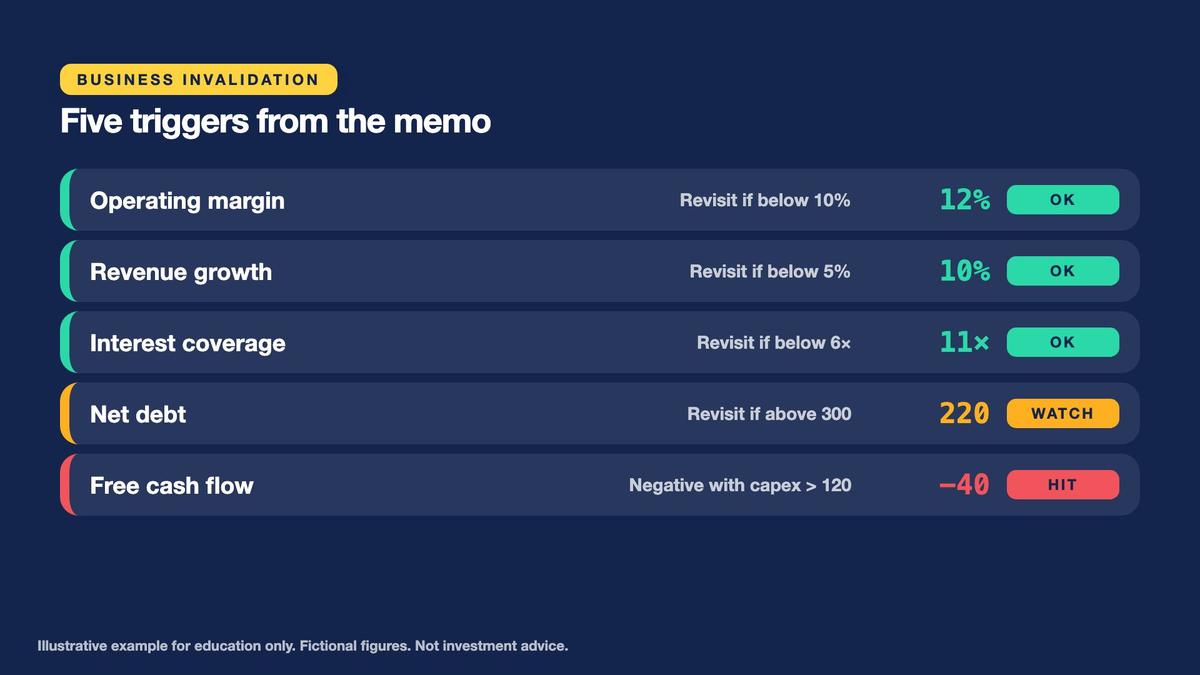
Example Corp's fictional research memo records stronger historical earnings, improving operating margins, and operating-income interest coverage of eleven times. It also highlights negative $40 million free cash flow, rising net debt, and uncertainty surrounding capital expenditures. Lesson Ten modeled bear, base, and bull implied values of $28.80, $62.40, and $102.06 per share against a fictional $50 reference price. These are conditional valuation estimates rather than predictions or execution prices. The illustrative memo label is research more, reflecting unanswered questions about financial sustainability.
The memo specifies measurable business-level review triggers. Revisit the thesis if operating margin falls below 10%, revenue growth falls below 5%, operating-income interest coverage falls below six times, or net debt exceeds $300 million. Another trigger requires both negative free cash flow and annual capital expenditures above $120 million. These conditions are intentionally tied to corporate financial evidence rather than daily price movements. They provide a way to question the original thesis using predefined criteria rather than changing the rules after outcomes are observed.
Key points
- Memo evidence: revenue +10%, margin 10% to 12%, coverage 11×.
- Business triggers (reviewed at reports): margin below 10%, growth below 5%, coverage below 6×, net debt above 300, FCF negative with capex above 120.
- A price stop does not disprove a business.
The scheduled business review occurs at the next annual report, although material interim disclosures can justify an earlier review. Crossing a trigger requires examining new financial data and recording whether the original argument remains supportable. It does not mechanically establish that a company has become unattractive, nor does it command any trade. The fictional base scenario value of $62.40 can inform an educational target illustration, but the research estimate and the specific market order remain separate concepts.
Specify the Demo Order, Entry, Stop, and Time Rule
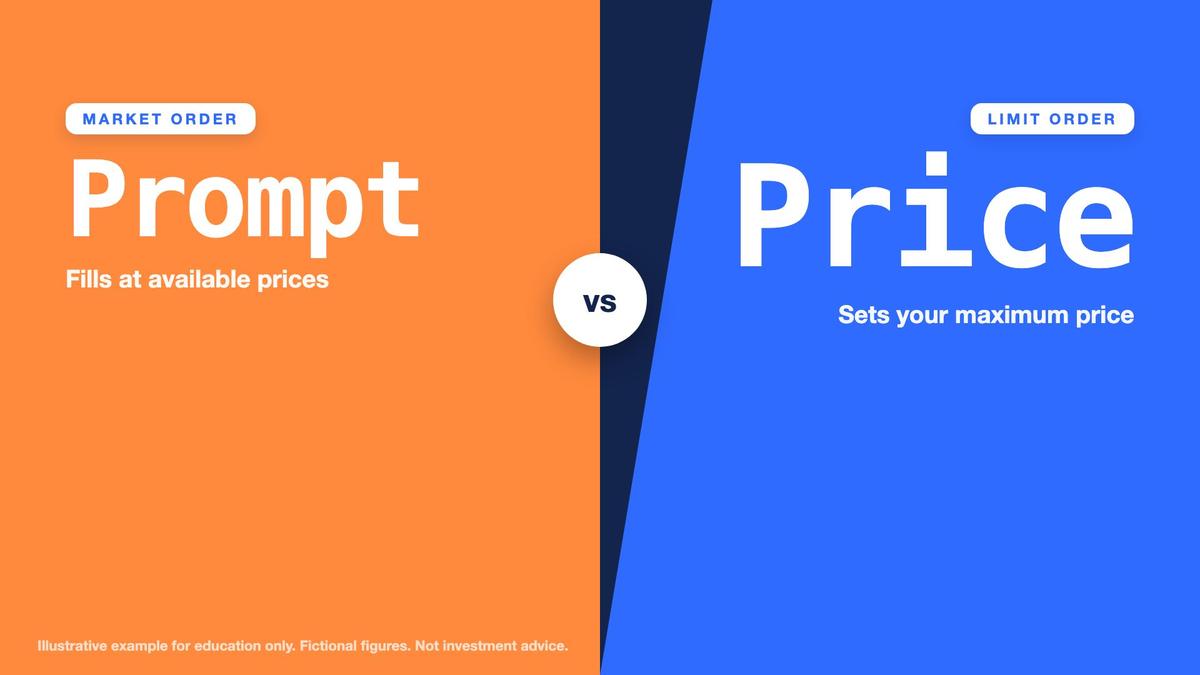
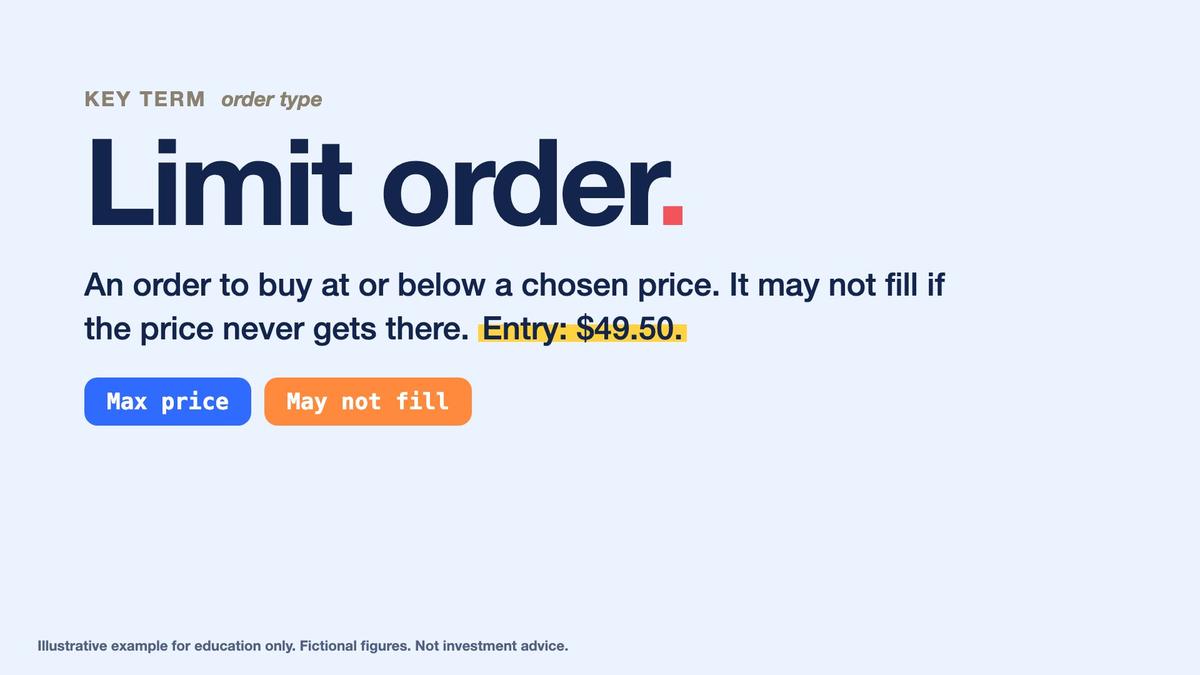
Begin with a hypothetical $10,000 simulated account and a fictional Example Corp reference price of $50.00 per share. The proposed trade side is long, meaning the learner constructs a setup that benefits from a higher price after entry. Use a limit buy order at $49.50. A limit buy specifies the maximum acceptable execution price, while a market order seeks prompt execution at available market prices. Neither instruction guarantees a fill, and actual execution can be affected by liquidity and the available order book.
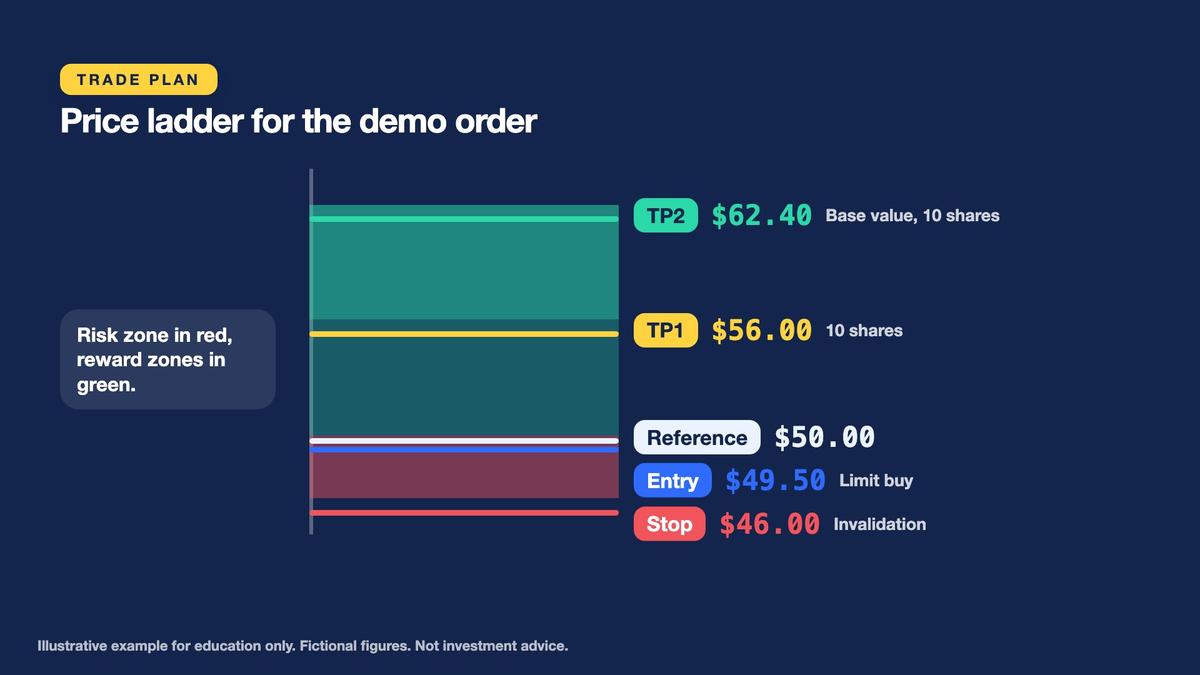
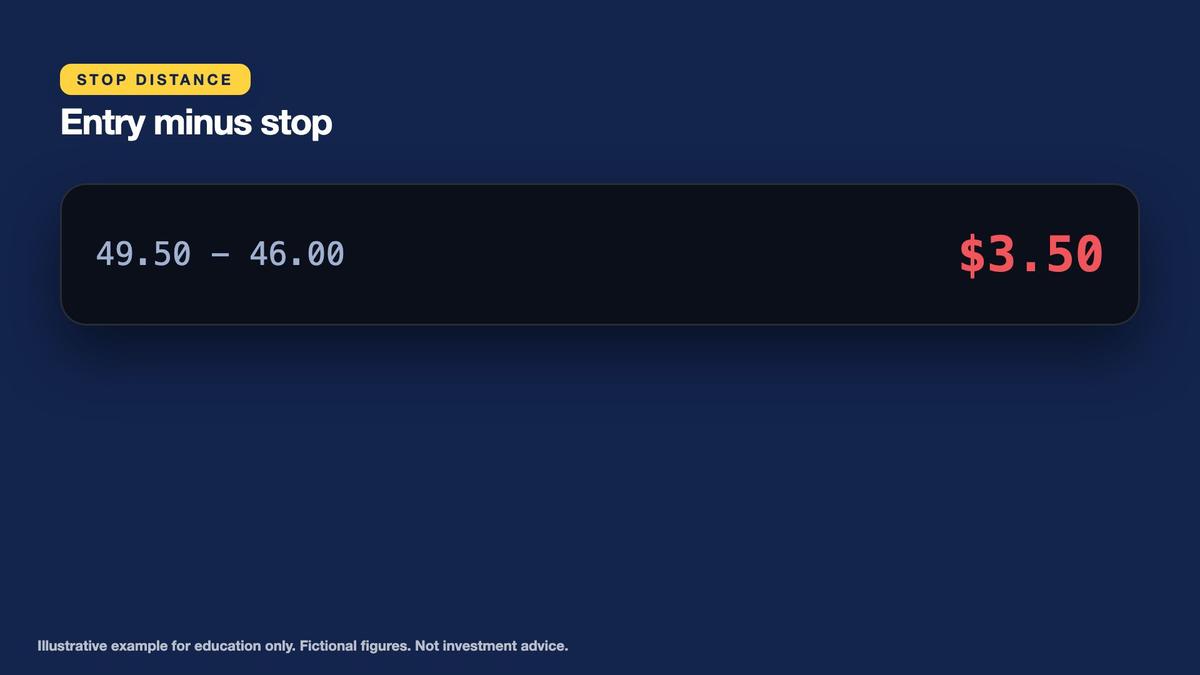
The simulated protective stop is $46.00. The difference between the planned $49.50 entry and $46.00 stop is exactly $3.50 per share. This is the trade's initial price invalidation distance. If the order fills and the stop condition is subsequently reached, the plan calls for the supported protective exit process. The stop does not mean Example Corp's business thesis has become false. It means the particular hypothetical trade setup has reached its predefined adverse price level.
Key points
- Demo order: long, limit buy at $49.50, stop at $46.00.
- Stop distance = 49.50 − 46.00 = 3.50.
- Limit orders set a maximum price but may not fill.
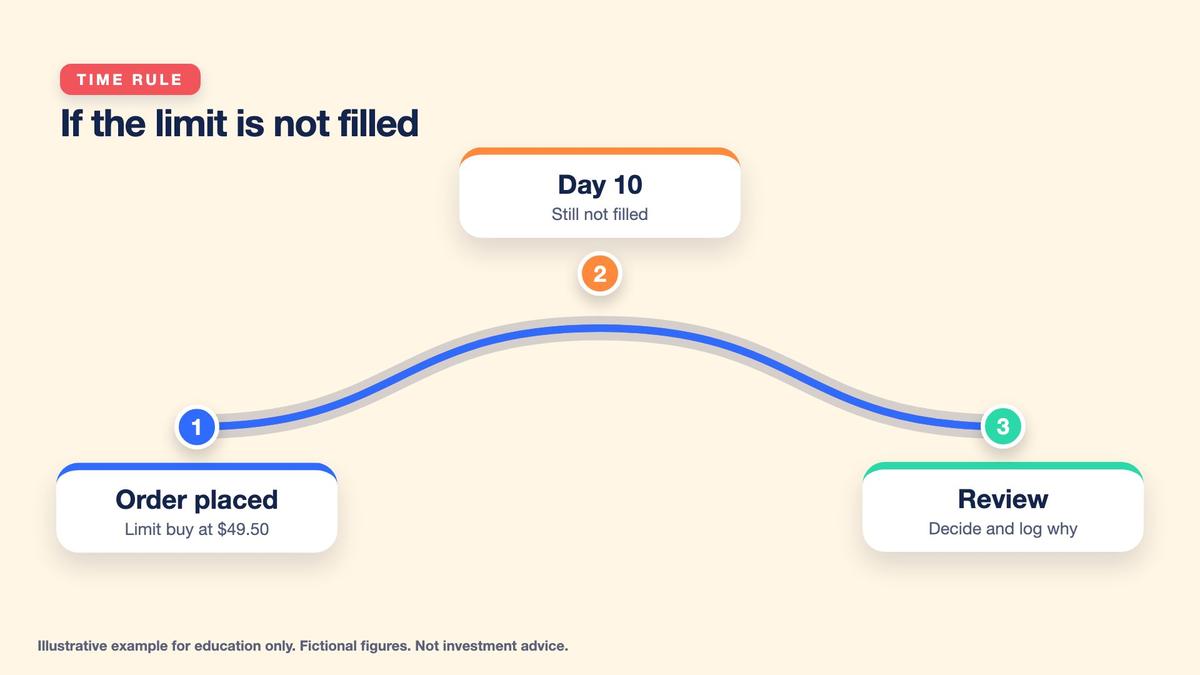
Add a time rule: if the limit order remains unfilled after ten trading days, review the pending setup. Trading days refer to relevant exchange sessions rather than calendar days. The rule requires reassessment; cancellation occurs only if the order-management workflow permits it and the learner chooses to cancel. If the application rejects immediately executable pending orders, confirm the current reference price and applicable entry restrictions before submitting. For this exercise, the assumed $50 reference price makes the $49.50 buy limit a hypothetical pending entry.
Calculate Risk-Based Quantity and Enforce the Position Cap
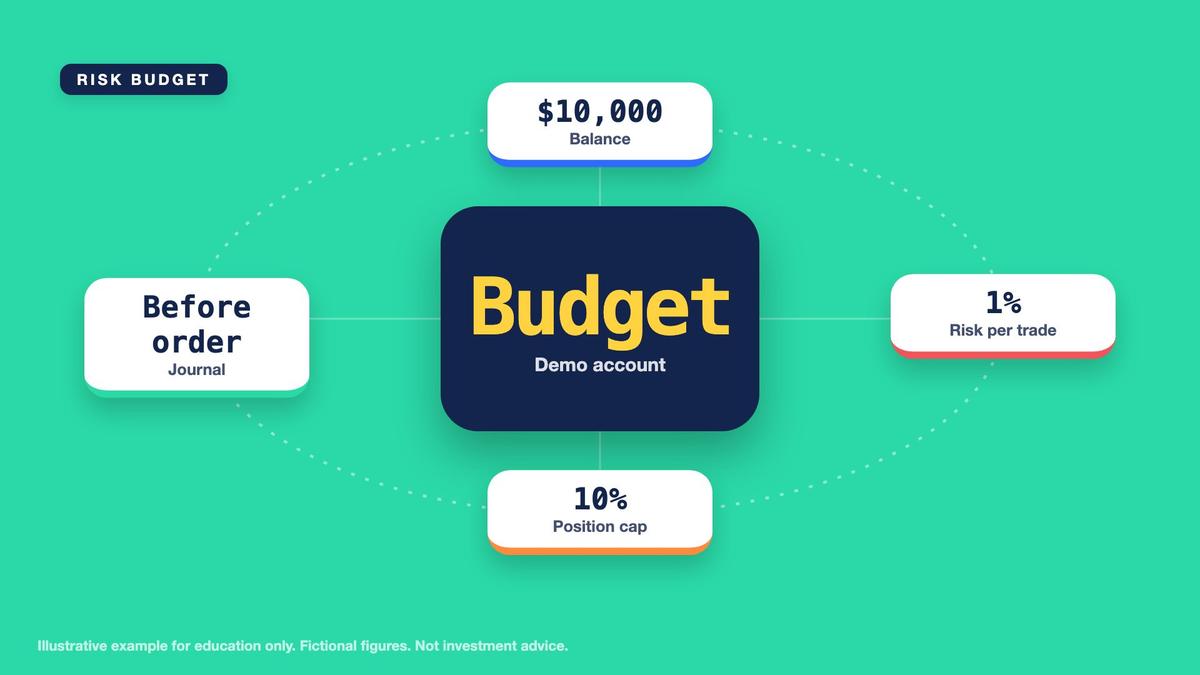
The Week One investment policy provides two separate limits. The learner selects an illustrative maximum planned stop-loss budget of 1% of the simulated $10,000 account, equal to $100. The policy also limits the value of one position to 10% of account balance, equal to $1,000. These limits address different exposures. The risk budget controls planned loss at the stop under simplified execution assumptions, while the allocation cap controls how much simulated account value is committed to the position.
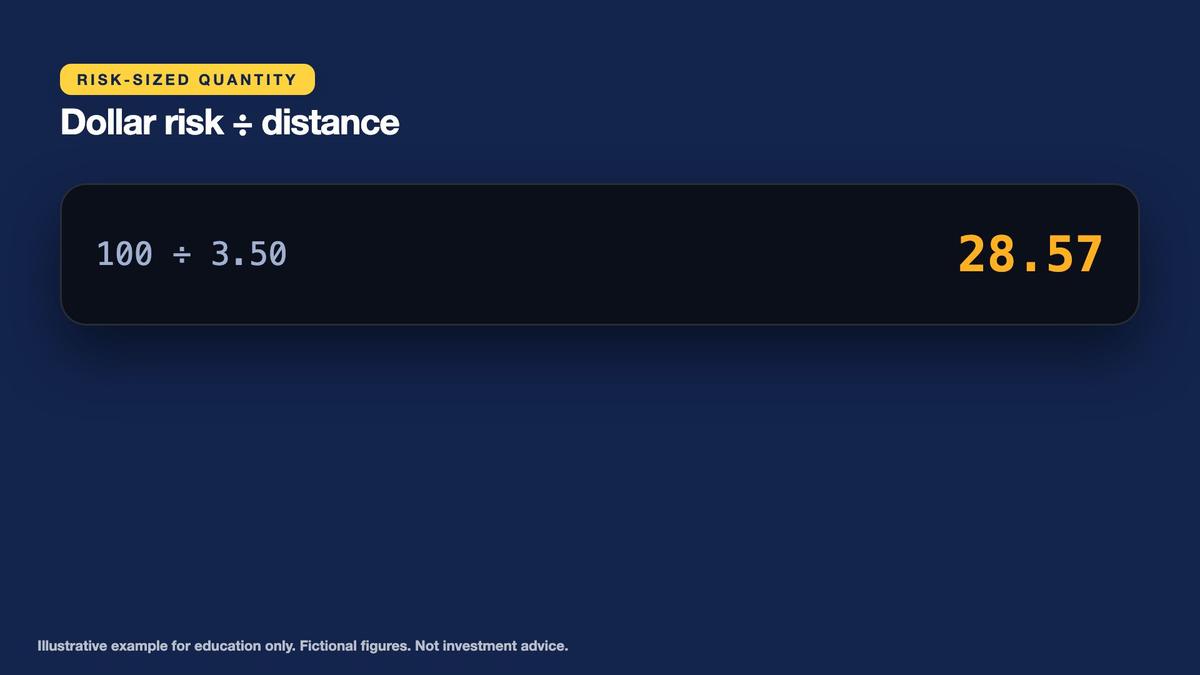
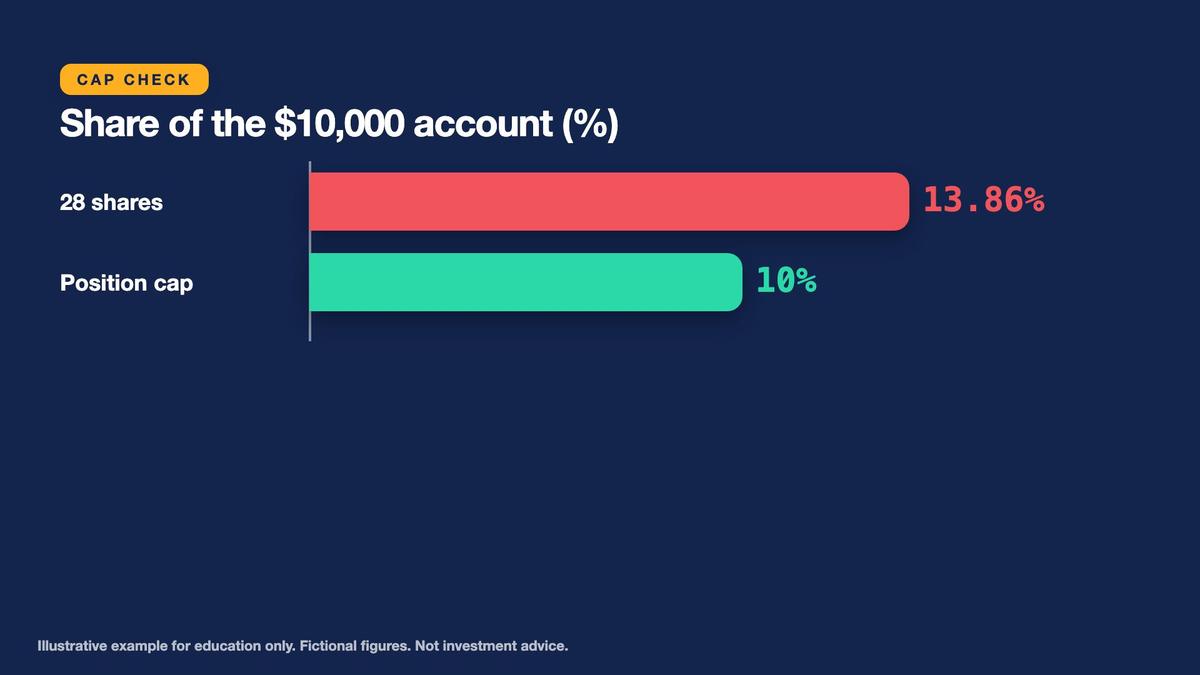
Start with risk-based sizing. Divide the $100 planned risk budget by the $3.50 entry-to-stop distance. The result is 28.571428... shares. Assuming the simulator supports whole shares only, round down to 28 shares. However, purchasing 28 shares at $49.50 requires exactly $1,386, equal to 13.86% of the $10,000 account. This exceeds the policy's $1,000 maximum position allocation. A size that satisfies the stop-risk calculation can still violate a separate position-value limit.
Key points
- Risk budget 1% of 10,000 = $100; cap 10% = $1,000.
- Risk quantity: 100 ÷ 3.50 = 28.57, so 28 shares (cost $1,386, over the cap).
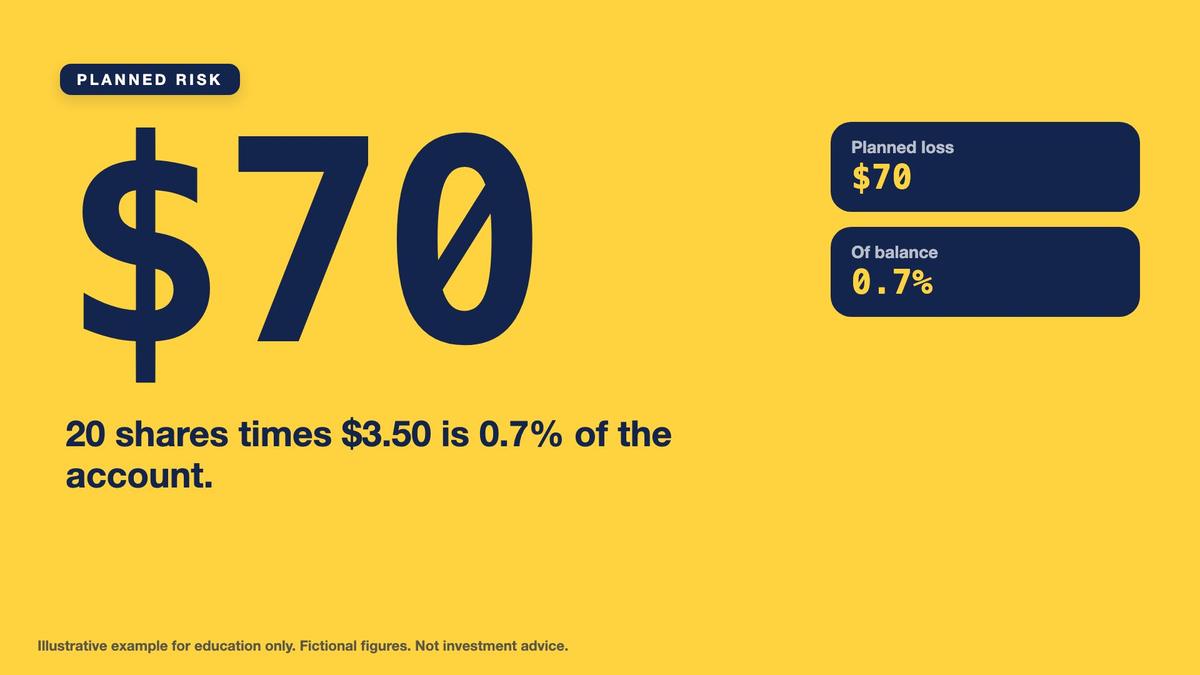
- Capped quantity: 1,000 ÷ 49.50 = 20 shares ($990); planned loss $70 = 0.7%.
Apply the stricter allocation rule. Divide the $1,000 position cap by the $49.50 entry price, producing approximately 20.2020 shares. Round down to 20 whole shares. The final planned position costs exactly $990, or 9.9% of the account. Its planned stop-loss exposure is 20 shares multiplied by $3.50, equal to $70, or 0.7% of balance. The unused $30 of the original risk budget does not need to be spent. Both limits are maximum allowances rather than quantities to maximize.

Configure Take-Profit Legs and Calculate Reward-to-Risk
For the capped 20-share position, establish two hypothetical take-profit legs. Take-profit one is $56.00 for 10 shares. Take-profit two is $62.40 for the remaining 10 shares, using the fictional base scenario implied value from Lesson Ten as an illustrative target. These targets are selected for educational calculation only. A modeled valuation does not guarantee that market price will reach that level or that an order will execute there. The two target shares sum to the full original 20-share position.
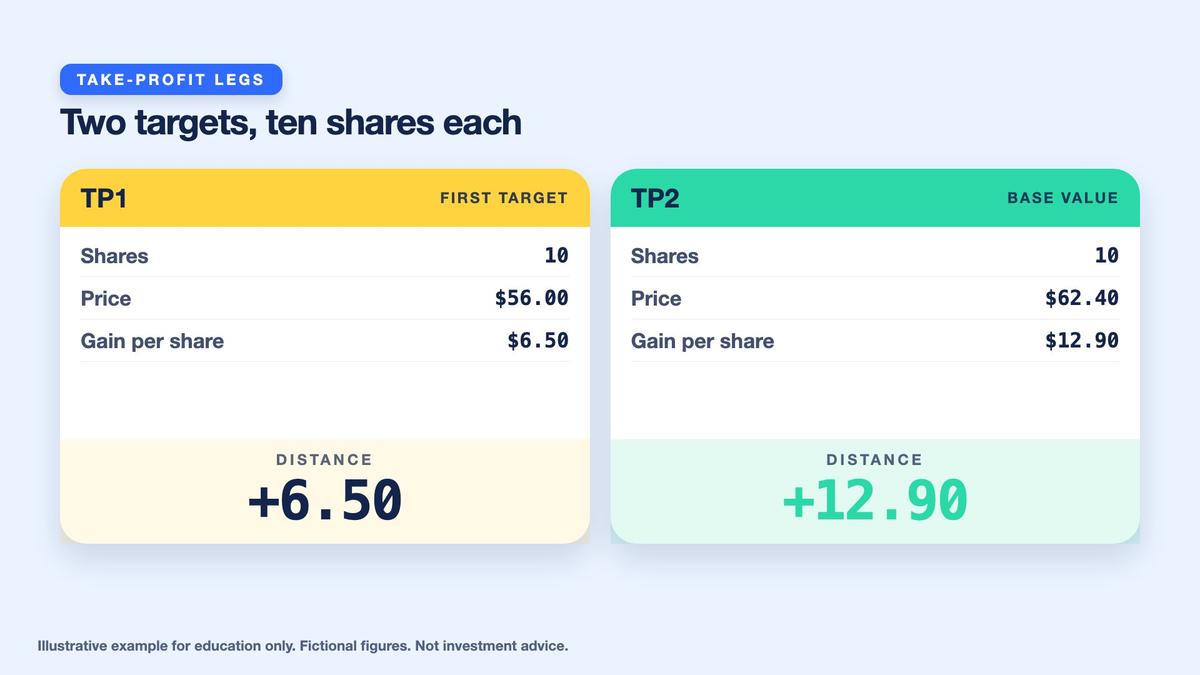
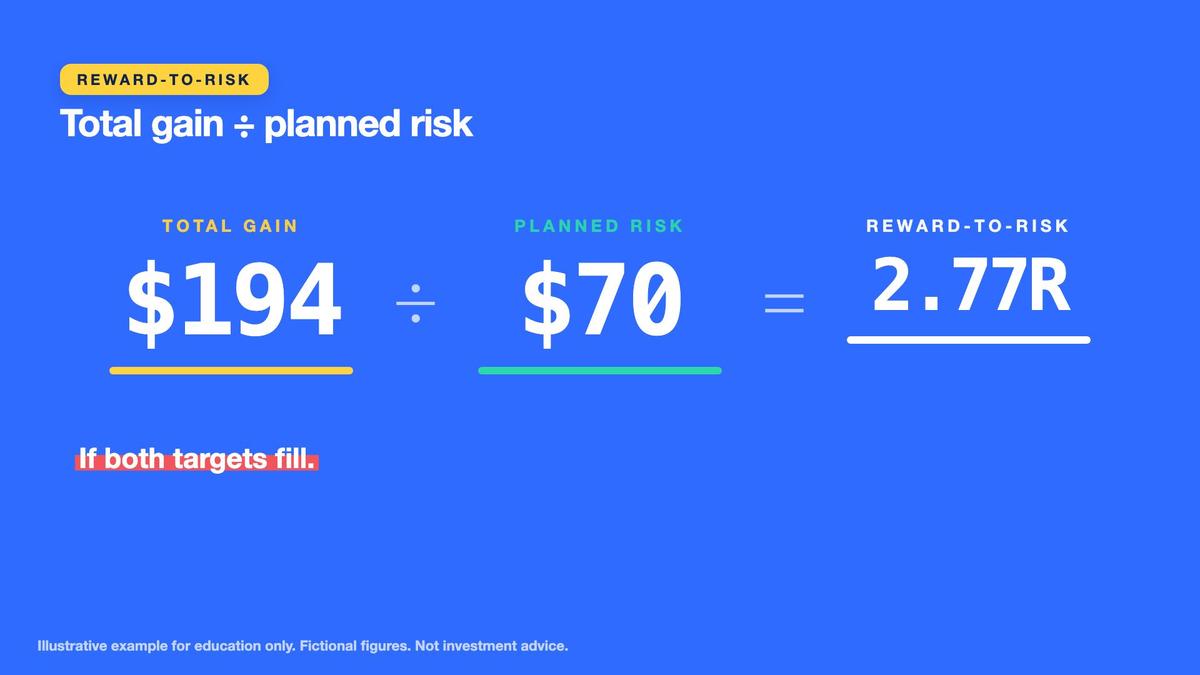
The first target is $56.00 minus $49.50, or $6.50 above entry per share. Ten shares would generate $65 gross profit if executed at that price. The second target is $62.40 minus $49.50, or $12.90 per share. Ten shares would generate $129 gross profit. If both legs execute as specified, the combined gross profit equals $65 plus $129, or exactly $194. The original planned stop-loss exposure is $70, so combined reward-to-risk equals $194 divided by $70, approximately 2.77R.
Key points
- TP1 $56.00 for 10 shares: +$65. TP2 $62.40 for 10 shares: +$129.
- Total $194 ÷ $70 risk = 2.77R.
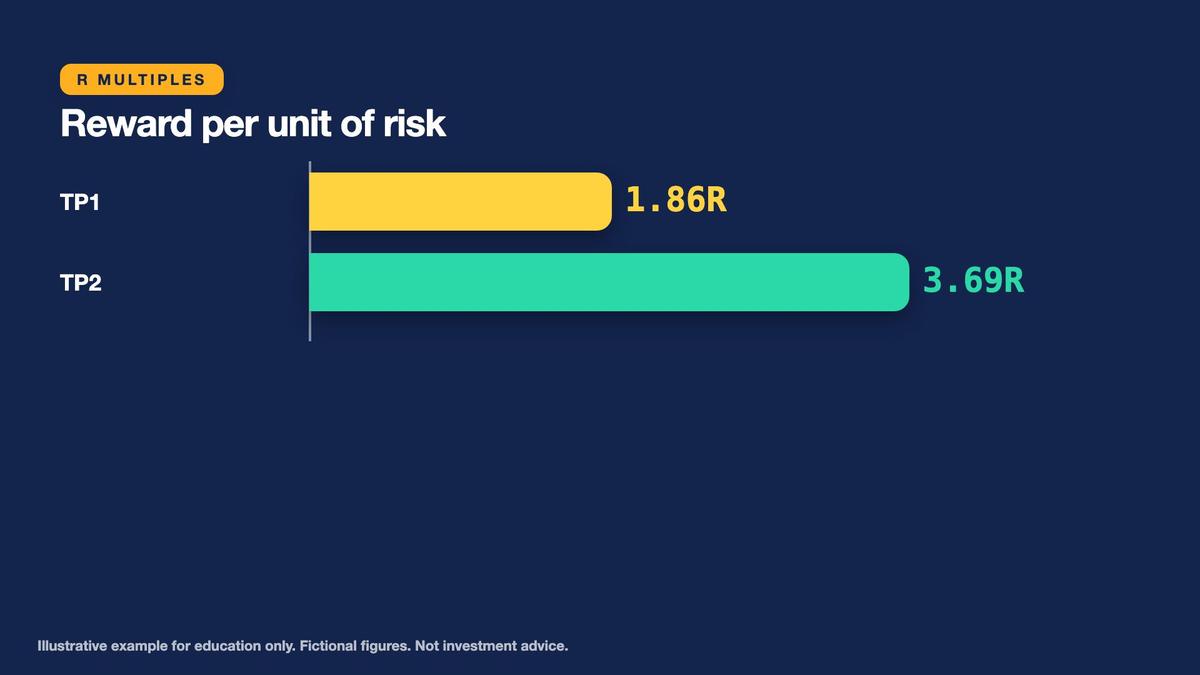
- TP1 is 1.86R and TP2 is 3.69R.
Individual target distances can also be expressed in R units. The first target is $6.50 divided by the $3.50 initial stop distance, approximately 1.86R. The second is $12.90 divided by $3.50, approximately 3.69R. Because each target closes half the original position, their weighted gross result is exactly 194/70, or approximately 2.77R. This assumes both targets execute as planned. If only one fills, the other shares may subsequently lose value, so the realized result can be lower or even negative.
Understand Execution Risk, Order Changes, and Stop Discipline
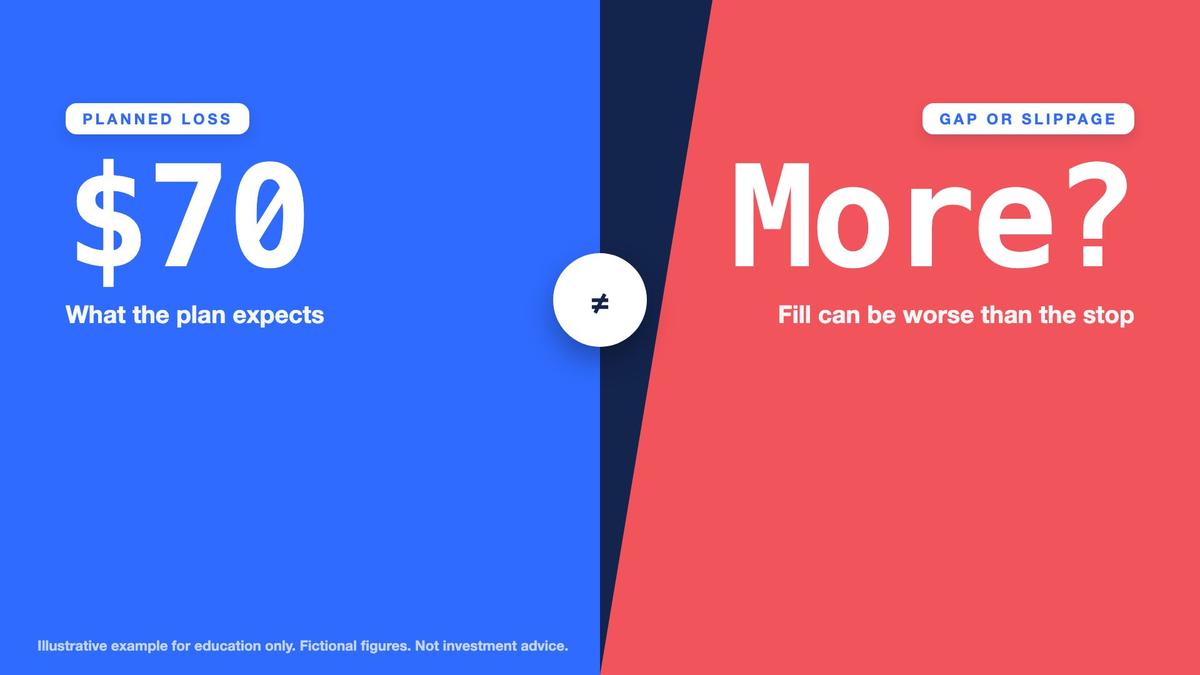
A planned maximum stop-loss calculation is not a guaranteed maximum realized loss. The $70 figure assumes all 20 shares enter at $49.50 and exit at precisely $46.00, with no costs or slippage. Market gaps can cause execution beyond the planned stop. Liquidity shortages and bid-ask spreads can also worsen execution. In the Week One paper-trading application, background monitoring occurs approximately once per minute, so simulated fills and exits may be detected later than the actual underlying price movement.
Record estimated transaction costs and slippage separately from the gross reward-to-risk calculation. An execution cost reduces realized net profit, while an unfavorable stop fill can increase losses. A stop-market mechanism, where supported, prioritizes obtaining an exit rather than guaranteeing the stop price. A stop-limit mechanism, where supported, restricts acceptable execution prices but may remain unfilled. The specific behavior depends on the demo application. Do not assume a generic order label guarantees real-exchange execution characteristics.

Key points
- Planned loss is not guaranteed: gaps and slippage can fill worse.
- Record costs and slippage separately.
- Never move the stop away to avoid a loss.
Do not move a protective stop farther from the entry simply to avoid recording a loss. Such a change increases the planned risk and undermines the original rule unless supported by a new, documented plan and fresh risk assessment. Likewise, do not silently enlarge position size after submission. When the demo application permits editing stops or take-profit levels, retain the original journal entry and document every subsequent change. Company-level review triggers remain separate from trade-level order management throughout this process.
Complete the Journal Before Submitting the Demo Order
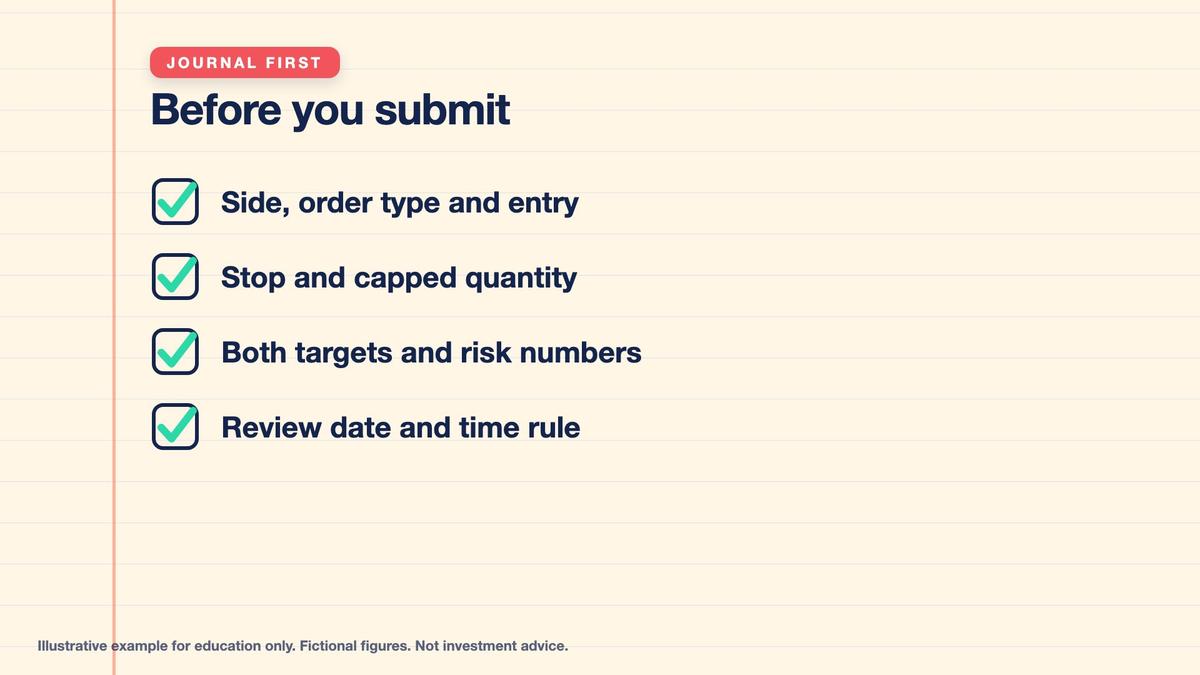
Open the Week One simulated trading journal and create a new record before placing the order. Include the date, fictional company, memo reference, account starting balance, trade side, order type, planned entry, protective stop, quantity, and take-profit allocations. The proposed entry is $49.50, the stop is $46.00, and the final capped quantity is 20 whole shares. Record the $990 position value, $70 planned loss, 0.7% account-risk percentage, and the separate 10% position-allocation maximum.
The journal should also explain the reason for the trade setup and why the order is a hypothetical limit buy instead of an immediately executable market order. Record targets of $56.00 for 10 shares and $62.40 for 10 shares. State the conditional combined gross profit of $194 and approximate 2.77R reward-to-risk. Add estimated commissions, spreads, slippage, and the ten-trading-day unfilled-order review condition. Link to the dated Example Corp memo so the business thesis and trade plan can be retrieved independently.
Key points
- Log the plan before submitting, then add dated execution notes.
- Time rule: review if unfilled after 10 trading days.
- Check what your demo platform allows.
Submit only through the isolated paper-trading environment after checking that the application supports the fictional instrument and the required order settings. If the platform does not list Example Corp, record the hypothetical trade on the journal worksheet rather than substituting an unrelated real ticker. The completed written plan satisfies the educational calculation objective even without an actual pending order. If an order later fills or closes, record the simulated execution prices, costs, realized R, and one lesson in a dated update without replacing the original plan.
Final Checkpoint: Separate Thesis Invalidation From Trade Invalidation
Your final checkpoint requires two clearly labeled documents. The company thesis records Example Corp's fictional business reasoning, scenario range, strongest countercase, and annual-report review triggers. The trade plan records a hypothetical long limit order at $49.50, protective stop at $46.00, 20-share capped quantity, and two ten-share take-profit legs. The company thesis can be revisited because of operating margin, revenue growth, debt, cash flow, or interest-coverage evidence. The trade plan can be invalidated by its price stop or reconsidered after the ten-trading-day pending-order review.

Practice Lab: Convert a Fictional Stock Thesis Into a Capped Demo Trade Plan
Use only fictional Example Corp and a $10,000 simulated account. Keep the company thesis and demo trade plan as separate documents. Apply a 1% planned stop-risk budget and a 10% maximum position-allocation rule. Calculate whole-share quantities by rounding down, apply the stricter position cap, and evaluate two equal take-profit legs. Assume entry and exit at the specified prices with zero fees and slippage for the stated gross calculations, while explicitly recognizing that actual fills may differ. Record all order details and invalidation conditions before submitting a simulated order. If the fictional symbol is unavailable in the demo application, complete the order as a paper worksheet without using a real ticker.
- Decision 1: Example Corp has a fictional base-case implied value of $62.40, but its business memo also identifies negative free cash flow, rising net debt, and annual-report review conditions. The reference market price is $50.00. — Explain why a company thesis and a demo trade plan must remain separate, and identify the appropriate review clocks.
- Decision 2: The simulated account has $10,000, the planned risk budget is 1%, the maximum position value is 10%, and Example Corp's hypothetical long entry and stop are $49.50 and $46.00. — Calculate the risk-based whole-share quantity and the final quantity after applying the separate position cap.
- Decision 3: Example Corp's final demo position consists of 20 shares with limit entry at $49.50 and protective stop at $46.00. The simulated account balance is $10,000. — Calculate position value, planned dollar loss, planned account-risk percentage, and account-allocation percentage.
- Decision 4: The hypothetical 20-share long position has entry $49.50, stop $46.00, take-profit one at $56.00 for 10 shares, and take-profit two at $62.40 for 10 shares. — Calculate each target's gross dollar profit, the combined reward, and the reward-to-risk ratio if both take-profit legs execute at their specified prices.
- Decision 5: Example Corp's thesis memo has predefined triggers involving operating margin, revenue growth, interest coverage, net debt, and FCF. Separately, the hypothetical pending limit order has a $46.00 stop and a ten-trading-day unfilled-order review. — Classify the invalidation conditions and explain what to do if either type of review trigger occurs.
Answer key
Explain the complete sizing calculation. A 1% risk allowance on $10,000 equals $100. Dividing by the $3.50 stop distance produces 28.5714 shares, rounded down to 28. But 28 shares cost $1,386, exceeding the $1,000 allocation cap. The stricter cap allows only 20 shares, costing $990 and creating a planned loss of $70, or 0.7% of balance. The two take-profit legs would produce $65 and $129 gross gains, totaling $194 and approximately 2.77R if both execute as assumed.
Conclude by stating why a profitable company thesis does not automatically make every price entry acceptable and why a stopped demo trade does not automatically disprove the company's business outlook. Record the plan before execution, respect the stop and position cap, preserve the journal, and review business assumptions on their own evidence-based schedule. No real-money trading is necessary. The final deliverable demonstrates the ability to separate research conviction from operational trading rules using a hypothetical example.
Worked example at a glance
Key terms
- Company thesis: a reasoned case for why a business may be worth owning.
- Trade plan: the exact demo order rules: entry, stop, size, targets and time.
- Invalidation: the condition that shows a thesis or a trade setup is wrong.
- Limit order: an order with a maximum buy price.
- Market order: an order that seeks immediate execution.
- Stop distance: entry price minus stop price.
- Risk budget: the dollars you allow to lose on one trade.
- Position cap: the maximum share of the account in one position.
- Reward-to-risk: total target gain divided by planned risk.
- R multiple: gain or loss expressed in units of planned risk.
- Slippage: the gap between planned and actual fill price.
Multi Asset Trading Lab is an educational course and does not provide personalized investment, trading, financial, legal, accounting, or tax advice. Example Corp is entirely fictional, and every company description, financial result, scenario valuation, reference price, order level, account balance, position size, reward-to-risk calculation, and review condition in this lab is hypothetical. The $10,000 account contains simulated money only. No real-money investing, trading, brokerage connection, exchange credentials, or actual security transaction is required or encouraged. The fictional $50.00 reference price, $49.50 limit entry, $46.00 protective stop, $56.00 first target, and $62.40 second target are educational inputs rather than recommendations or price targets for a real company. The $62.40 base scenario implied value depends on uncertain growth, margin, share-count, and P/E assumptions and does not guarantee that a market price will reach it. A company thesis is an evidence-based research interpretation and must be distinguished from a specific demo order plan. Business-level review conditions concern financial disclosures and do not automatically trigger or invalidate price-based orders. Trade-level stops, targets, pending-order review rules, and order execution do not independently prove or disprove the company's business prospects. The stated 1% risk budget and 10% position cap are fictional learning-policy constraints, not universally appropriate investment limits. Position-sizing calculations assume whole-share trading, a simple linear share instrument, and specified execution prices. The preliminary risk-sized quantity of 28 shares violates the independent allocation cap; the capped quantity of 20 shares is used throughout the final demo plan. The $70 planned stop loss represents 0.7% of the simulated balance under simplified assumptions but is not a guaranteed maximum realized loss. Market gaps, slippage, liquidity shortages, spreads, commissions, order type behavior, delays, partial fills, and the demo application's approximately minute-granular monitoring may produce materially different outcomes. The $194 conditional gross target gain and approximately 2.77R combined reward-to-risk assume both ten-share take-profit legs execute at their specified prices and exclude trading costs. If only one target fills, the remaining shares may produce gains or losses, and the realized result may differ substantially. A limit order does not guarantee execution, a market order does not guarantee a specific price, and stop orders do not provide guaranteed execution at the stop level. Moving a stop farther away increases planned risk and can undermine predefined constraints. The ten-trading-day pending-order condition is a review trigger and does not automatically cancel an order unless an applicable workflow explicitly implements cancellation. The educational company-thesis triggers involving operating margin, revenue growth, negative FCF with high capex, net debt, and interest coverage are not universal indicators of investment attractiveness or distress. Learners should preserve dated original research memos, document changes transparently, maintain separate thesis and trade invalidation rules, and perform all activities using fictional instruments and an isolated simulated account. If the platform cannot represent the fictional security, learners should complete the order as a hypothetical journal worksheet rather than substitute an actual ticker. Nothing in this lab constitutes a recommendation to buy, sell, short, or hold any real financial instrument, and no simulated result guarantees future investment performance.
Lesson Checkpoint
Review what you learned and get feedback on your work.